Publisher’s version / Version de l'éditeur:
Vous avez des questions? Nous pouvons vous aider. Pour communiquer directement avec un auteur, consultez la première page de la revue dans laquelle son article a été publié afin de trouver ses coordonnées. Si vous n’arrivez Questions? Contact the NRC Publications Archive team at
[email protected]. If you wish to email the authors directly, please see the first page of the publication for their contact information.
https://publications-cnrc.canada.ca/fra/droits
L’accès à ce site Web et l’utilisation de son contenu sont assujettis aux conditions présentées dans le site LISEZ CES CONDITIONS ATTENTIVEMENT AVANT D’UTILISER CE SITE WEB.
1st International Structural Specialty Conference (CSCE 2006) [Proceedings], pp.
1-13, 2006-05-01
READ THESE TERMS AND CONDITIONS CAREFULLY BEFORE USING THIS WEBSITE.
https://nrc-publications.canada.ca/eng/copyright
NRC Publications Archive Record / Notice des Archives des publications du CNRC :
https://nrc-publications.canada.ca/eng/view/object/?id=8aa4d0f6-7688-46b5-9160-34b19b72ca7b https://publications-cnrc.canada.ca/fra/voir/objet/?id=8aa4d0f6-7688-46b5-9160-34b19b72ca7b
NRC Publications Archive
Archives des publications du CNRC
This publication could be one of several versions: author’s original, accepted manuscript or the publisher’s version. / La version de cette publication peut être l’une des suivantes : la version prépublication de l’auteur, la version acceptée du manuscrit ou la version de l’éditeur.
Access and use of this website and the material on it are subject to the Terms and Conditions set forth at
Field performance of water mains buried in expansive soil
http://irc.nrc-cnrc.gc.ca
F i e l d p e r f o r m a n c e o f w a t e r m a i n s b u r i e d i n
e x p a n s i v e s o i l
H u , Y . ; V u , H . Q .
N R C C - 4 8 6 2 4
A v e r s i o n o f t h i s d o c u m e n t i s p u b l i s h e d i n
/ U n e v e r s i o n d e c e d o c u m e n t s e t r o u v e
d a n s : 1
s tI n t e r n a t i o n a l S t r u c t u r a l S p e c i a l t y
C o n f e r e n c e , C a l g a r y , A l b e r t a , M a y 2 3 - 2 6 ,
2 0 0 6 , p p . 1 - 1 3
Field Performance of Water Mains Buried in Expansive Soil
Yafei Hu1 and Hung Q. Vu1,21 Centre for Sustainable Infrastructure Research (CSIR), National Research Council, Regina, Saskatchewan, Canada
2 Clifton Associates Ltd., Regina, Saskatchewan, Canada
Abstract: Water mains buried in expansive soils are often subjected to severe distress subsequent to installation. As the soils go through wet and dry periods, the soils swell and shrink. Water mains buried in the soils move with the soils. Excessive stresses may be induced due to uneven movement of the soils along the water mains, impairing the performance of or even breaking the water mains. Field monitoring is an important means to understand the soil behaviour and its interaction with water mains. For this purpose, field instrumentation was successfully installed to monitor the performance of a section of water main placed in an older area of Regina where frequent pipe breakage has been observed in recent years. The instrumentation included sensors to measure pipe wall strains, pipe displacement, in situ soil moisture
content, soil pressure and temperature in the soil backfill and native soil around the backfill. The measurements from the sensors during the first 3 months were analyzed and the results are presented in this paper. Preliminary results indicate that the water contents in the trench backfill tended to decrease due to water drainage. The pipe initially bent downward with the mid span portion of the section having very high displacement and bending strain. The results also show that the average in situ longitudinal
stress at the mid-point of the pipe section was higher than the stresses at two locations close to the joints of the pipe, probably due to soil friction effect. Some theoretical predictions agree fairly well with or fall within the measurement ranges.
1. Introduction
Expansive clay soil has long been recognized to be one of the important factors that affect the performance of water mains buried in the soil. Baracos et al. (1955) analyzed the pipe breakage data of
cast iron (CI) and asbestos cement (AC) water mains in the City of Winnipeg (Manitoba, Canada) for the years 1948-1953 and found that the monthly number of circumferential failures for this period had a cyclic pattern, with two peaks that occurred in September and January. The circumferential breakage pattern was compared with the monthly mean temperatures, precipitation and approximate depth of snow cover in this area, and a close correlation with the seasonal climate changes was suggested. The high plasticity (i.e., high swelling-shrinkage potential) of soils in this area was used to explain the observed phenomenon. Three test installations consisting of instrumented CI and AC pipes were also made to investigate the pipe movement. As much as 50 mm upward displacement was observed during the investigation. More importantly, differential movement of the buried pipe was exhibited by all three test installations. This amounted to as much as 20 mm and could cause 0.5° of rotation at the tightened joints. Such movement in corrosion-weakened pipe could well cause flexural or joint failure.
Mordak and Wheeler (1988) analyzed data from four water authorities with a large inventory of AC pipes in the U.K., with one predominant with clay soil and the other three sand/gravel. It was found that the distribution of failures through the year was fairly random for the three areas where sand/gravel soil is predominant whereas in area with clay soil, most of the failures occurred during the dry summer months. For the analyzed period from 1952 to 1982, two peaks in the annual failure rate were observed for this water authority and they all corresponded to two hot summers with long dry periods. Also in this study area, over 60% of the failures occurred during July, August and September when the soil moisture deficit was at a maximum. The breakage pattern was also attributed to the shrinkage of the clay soils that causes loading on the buried pipes. The high incidence (over 97%) of circumferential failures, and the large proportion of failures on small diameter mains (over 98% being 75, 100 and 150 mm, with these pipe diameters representing 80% of the network total length), are consistent with such external loading imposing bending stresses on the pipes.
In another study conducted by Hudak et al. (1998), the pipe breakage was analyzed in an area with soils
having shrinkage-swelling potential ranging from moderate (3 - 6% volume change in an unconfined clod of soil as the moisture content increases from air-dry to field capacity) to high (6 - 9%) and to very high (more than 9%). Long hot summers and moderately wet spring and fall seasons characterized the climate of the study area. The highest density of breaks was observed to have occurred in the areas with the highest plasticity indices. Breaks were more common in the smaller diameter pipe. Most of the breaks occurred from September to December, which were attributed to water content increase in the soils that had dried during the summer. In January to May, soil moisture fluctuations were less extreme, leading to less swelling /shrinkage, and, therefore, lower break frequency. In some years, there was a significant number of breaks in June and July. These breaks were attributed to the short periods of rain that moistened dry soil during these months. The effect on pipe ruptures due to soil shrinkage during dry months was observed in this study as well. In a nineteen-month period, there were eight months with an above-average number of breaks. Each of those eight months had below average rainfall. The association between plasticity index and break density observed in this study suggests that expansive clays may play an important role in rupturing water pipes.
In a recent study on the failures of asbestos cement water mains in Regina, Saskatchewan, Canada, by Hu and Hubble (2006), the breakage pattern of the water mains was analyzed for the period from 1980 to 2004. A monthly breakage pattern that was similar to that of Winnipeg was observed for the 25 year period. The rainfall deficit (a surrogate measure for soil moisture level) and the freezing index (a surrogate measure for the severity of a winter season) were calculated and compared with the annual and winter pipe breakage rate, respectively. It was found that most of the annual and winter breakage rate peaks corresponded to peak rainfall deficits and freezing indices. The highest annual breakage rate also corresponded to a year with the highest rainfall deficit. Similar to that of Winnipeg, the soil in Regina is a montmorillonite type clay with high swelling-shrinkage potential.
It can be seen that the previous work has revealed the close correlation between high pipe breakage and extreme climate condition where expansive soil is predominant. The soil dries out during periods of hot, dry weather due to high temperatures and relatively low precipitation. Clay soil shrinks and moves due to the reduction in moisture content. Conversely, cool wet and rainy periods cause these soils to expand. In general, the soil movement is uneven and bending stresses are induced on the pipes. In some cases, the stresses are believed to be of such magnitude that they could cause the failure of pipes whose integrity may have already been compromised by other factors such as corrosion. Clay can shrink in winter too. This action is believed to be caused by the progressive freezing of the soil from the surface, which can draw pore water from the lower depths to form ice lenses (Shah and Razaqpur 1993). Percolation of surface water into the soil is negligible during winter months, because the ground is frozen, and because precipitation is predominantly in the form of snow. The reduced moisture content at the lower depth results in shrinkage. This shrinkage may cause differential soil movement and, thus, an increase in pipe breakage rates in extreme cold periods.
In spite of the known influence of expansive soils on the performance of the water mains, little work has been done so far to model the interaction and quantify the relationship, which would be very helpful to municipal engineers in the design, construction, maintenance and management of water mains buried in expansive soils. One possible reason may be the complex factors that can influence the local soil moisture conditions. Although an extreme climate condition can be readily associated with an increased pipe breakage city wide, the local soil moisture condition may be quite different from one specific location to another. Hamilton (1966) identified many other factors that may influence the local soil moisture condition, including surface features such as pavements, trees, grass cover, adjacent structures and summer watering. For example, trees are usually planted between the sidewalk and the pavement, on a narrow strip of grassed area. These areas usually receive no artificial irrigation because they are on public property and do not pond water during periods of heavy precipitation because they are well graded. As trees grow towards maturity they are forced to extend their root system to greater distances and depths. A mature tree may extract 0.25 to 0.5 m3 water per day in the summer (Perpich et al. 1965). If there are
pipes in the vicinity of the tree roots, the large water uptake may significantly change the local soil water conditions.
To understand the working environments and the corresponding responses of pipes in expansive soils, field instrumentation was installed to monitor the performance of a section of water main in an expansive soil area of an older area of Regina where frequent pipe breakage has been observed in recent years. The instrumentation included sensors to measure pipe wall strains, pipe displacement, soil moisture content, soil pressure and temperature in the soil backfill and native soil around the backfill. This paper presents the details of the instrumentation and the results of the test section (150 mm diameter PVC pipe) during the first 3 months. The preliminary results are discussed with the theoretical analysis.
2. Field Installation
The test site was on Emerald Park Road in the Whitmore Park area of south Regina. This location was selected because it is in an area with a high number of AC pipe breaks. It is located near a source of power and adjacent to a park to locate the instrumentation enclosure on public land and minimize cable length. Other factors, such as the site being relatively clear of utilities and minimal water service connections to minimize public inconvenience, were also considered.
2.1 Trench excavation & backfill
The field installation was carried out between October 24 and 28, 2005. A trench was excavated and the existing AC pipe section was removed. The trench was 2.4 m wide and 8.2 m long. The AC water main was 2.9 m below the ground surface. Installation of the instrumented section of pipe and other sensors was then carried out at different depths (levels) below the ground surface. The trench backfill was completed to the pavement base level and the first layer of pavement was placed right after the compaction of the final lift. The top layer of asphalt over the trench area was completed 2 days later. Sand provided by the City of Regina was used as backfill material for the haunch and bedding areas throughout the entire trench. Only one lift was used from the bottom of the trench to the springline of the pipe, about 360 mm thickness, because of the difficulty in compacting the sand around the pipe. The material used for backfill above the springline up to pavement base level was a material referred to as “mixed concrete (MC)”, which is a blend of recycled crushed concrete and subbase gravel with a ratio of 2:1 by weight. The MC was installed in layers of 150 mm up to the level of the underside of the pavement according to the Standard Construction Specifications (2004) of the City of Regina. The backfill was compacted with vibrating plate compactors.
2.2 Pipes
The pipe removed from the site was a 4 m long section of 150 mm diameter Class 150 AC pipe, originally installed in 1959. The instrumented pipe section installed was 150 mm C900 PVC water main pipe. The new PVC pipe is 4 m long and has an inside diameter of 155 mm and an outside diameter of 175 mm.
2.3 Soil conditions
The stratigraphy of the site consists of highly plastic glacial lake lacustrine clay from the surface to a depth of about 8.5 m underlain by glacial till. The soil conditions at the site were assessed before the installation in two sample boreholes. One borehole was in the street, about 1.65 m west of the centreline of the pipe. The other one was in the Park, about 6 m east of the pipe. The soil samples from the two boreholes are currently being tested and analyzed.
The bedding and backfill materials used in this excavation were sampled for classification and subsequently laboratory testing. The moisture content and dry density were measured in situ using a
Troxler 3400 Surface Density-Moisture Gauge every two lifts. Based on preliminary field data, soil densities higher than 95% Standard Proctor Maximum Dry Density were generally achieved for all backfill lifts.
3. Field Monitoring System
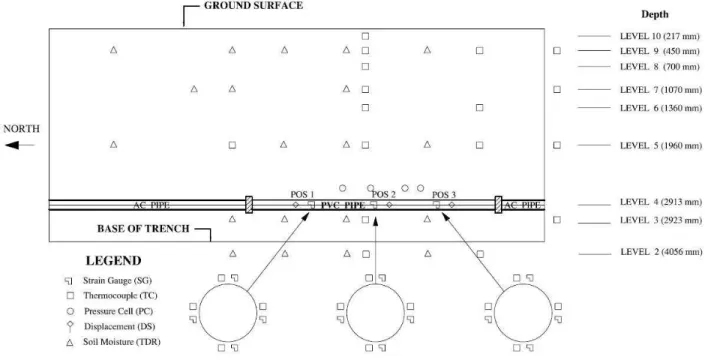
The typical section layout of the sensors that were installed for this project is shown in Fig. 1. Some thermocouples and time domain reflectometry probes (TDR) were installed at the same levels as those
shown in this figure but in sections away from this section. The detailed layout of all sensors can be found in a progress report by Hu and Loftian (2005).
Figure 1. Schematic of sensor layout in typical section These sensors included:
• 24 strain gauges on the exterior pipe surface for measuring deformation of the pipe,
• 49 thermocouples for temperature measurements on the exterior pipe surface, in the backfill and in the native soil.
• 4 earth pressure cells approximately at the pipe level in the backfill to measure soil pressure changes.
• 3 displacement transducers installed between the base of the pipe exterior surface and stable ground below the trench to measure vertical displacement of the pipe, and
• 30 TDR probes for in situ soil moisture content measurements.
The monitoring system was installed from October 23 to 26, 2005, and is intended to provide two years of continuous datalogging as part of an on-going study.
3.1 Strain gauges
Strain gauges were installed to measure the deformation response of the PVC pipe. Micro-Measurements general-purpose strain gauges SK-06-250TM-350 with 15000µε (1.5%) range at room temperature were selected. Three sets of strain gauges were installed. Each set consists of four pairs of gauges: one on the top of the pipe, one on the base of the pipe and the other two on the springlines (see Fig. 1). Each pair consists of two separate gauges: one gauge is oriented along the longitudinal axis of the pipe and the other gauge is oriented perpendicular to the first gauge. The three sets of strain gauges are equally spaced along the pipe section (Pos 1, 2 and 3).
Three dummy strain gauges mounted on small rectangular coupons, prepared from PVC pipe of identical specifications to the installed pipe material, were placed in the backfill very close to the three sets of strain gauges on the pipe surface. The apparent deformation due only to temperature change will be measured by the dummy strain gauges and will be used to correct the deformation measured by the strain gauges on the pipe surface.
Strain gauge readings were taken before the installation to get the initial gauge readings. Readings were obtained during pipe installation and backfill operations to observe the pipe deformation behaviour during construction process.
3.2 Thermocouples & pressure cells
Forty nine type T thermocouples were installed during the field work: 12 thermocouples on the exterior pipe surface to measure the temperatures around the strain gauges; three thermocouples adjacent to dummy strain gauges for measuring the temperatures on the coupons; 33 thermocouples in the backfill and the native soil surrounding the trench to get an insight into the temperature profile around the pipe and one thermocouple outside the instrument enclosure for ambient air temperature.
Four Geokon model 4810X vibrating wire earth pressure cells with 350 kPa capacity were installed in the trench backfill about 170 mm above the top of the pipe (Fig. 1). The four pressure cells were placed in 2 groups of two. In each group, one pressure cell was installed with its flat surface horizontal (to measure vertical stress) while the other pressure cell was placed with its flat surface vertical (to measure horizontal stress). The pressure cells were surrounded by a thin layer of sand for uniform contact between the pressure cells and the backfill
.
Calibration curves were developed and provided by the manufacturer toconvert the frequency output measured from each pressure cell to a pressure value.
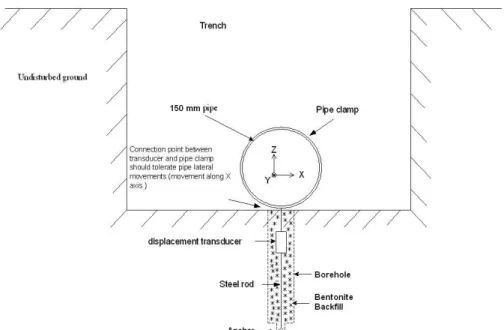
3.3 Rod extensometers
Three custom-built Geokon Model 4450 vibrating wire displacement transducers were installed. One end of each extensometer was attached to the instrumented pipe section with a custom-built clamp to make sure that the extensometers have the same displacement as the pipe at the clamped position. The other end of each extensometer was installed in a borehole and anchored to the ground about 3.6 m below the bottom of the trench (i.e., about 6.6 m below the ground surface). It is believed that the soil at this level will have little movement due to changes in conditions of interest to this work. Thus, the displacements measured by the extensometers should reflect those of the pipe. The boreholes were sealed with Bentonite to prevent water flow into the boreholes and, thus, unintended changes in soil moisture conditions (Figure 2).
3.4 TDR probes
Thirty Campbell Scientific Model CS616 TDR probes were placed in the trench backfill and surrounding native soil to measure the moisture distribution profiles. All TDR probes were installed horizontally, except the four installed about 600 mm below the bottom of the trench which were placed vertically (Fig. 1). For TDR probes placed in native soil, holes were dug for the two rods to facilitate the insertion of the rods.
3.5 Data acquisition system
A Campbell Scientific CR1000-55 datalogger and its peripherals were installed to collect the data from the sensors. During the installation, the system scanned the sensors every six minutes and stored the data. After completion of the installation, this system scans the sensors every hour and the recorded data is
nsferred to CSIR every 24 hours via a cellular communication link.
tra
The data-logging equipment was housed on-site in a metal instrumentation box installed in Emerald Park, east of the trench. On-site communication with the datalogger was established through a serial port connection (RDS-232 link). The link served to monitor initial measurements and transfer recorded construction data to a portable computer.
Figure 2. Schematic of Rod Extensometer Connection and Installation 4. Preliminary results and discussion
The following results are based on the data collected in the 3 month period following installation, from October 25, 2005 to January 31, 2006.
4.1 Temperature
Figure 3 shows the average temperatures from representative levels. It can be seen from this figure that, above the pipe level (Level 4), the closer to the ground surface, the more variable the temperatures; at and below the pipe level, temperature dropped at a fairly stable rate and has not gone below freezing. The deepest 0° isotherm has reached about 700 mm below the pavement surface to the end of January.
4.2 Moisture contents
The volumetric water contents at different levels are shown in Fig. 4. This figure shows the water content measurements in the backfill only. The manufacturer-provided calibration curve for the clay soil needs to be re-calibrated and this work is currently being performed. A sudden increase in water content was observed for all sensors at Level 3 and some of the sensors at Level 7 because water from snow melt entered into the trench from the cracks between the new pavement and the curb on November 19, 2005. Although the cracks were later sealed, some TDRs close to the cracks were still affected. Except for Level 3, the water content values in all other levels tended to decrease. It may indicate that water was draining from the top of the trench to the bottom of the trench. Because the clay soil below the trench bottom has a very low permeability, water will accumulate at the bottom of the trench, which may explain the increase in water content at Level 3. The TDRs at Level 9 experienced a big drop in water content that then leveled out. This drop is associated with the freezing of the water at that level. In mid-December the soil temperature at this level was below zero and from that time on the readings from the probes were not valid.
-25 -20 -15 -10 -5 0 5 10 15
25-Oct 14-Nov 4-Dec 24-Dec 13-Jan 2-Feb
Date Te m pe ra tur e ( °C ) 2005 2006 Air Level 9 (450 mm) Level 7 (1070 mm) Level 4 (2913 mm) Level 2 (4056 mm)
Figure 3. Temperature versus time at different levels in the trench
0 10 20 30 40
25-Oct 14-Nov 4-Dec 24-Dec 13-Jan 2-Feb
Date V o lu m e tr ic W a te r C o n te n t (% )
Melt Water Entered
2005 2006 Level 3 (2923 mm, sand) Level 5 (1960 mm, MC) Level 7-2 (1070 mm, MC) Level 7-1 (1070 mm, MC) Level 9 (450 mm, MC)
Figure 4. Volumetric water content versus time at different levels in the trench
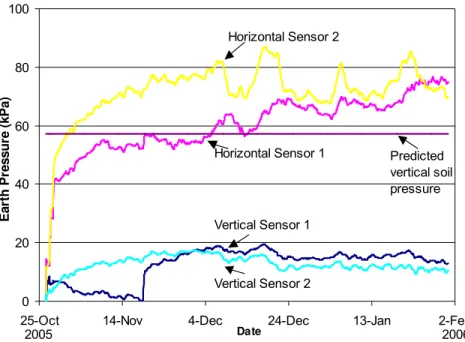
4.3 Soil pressures
Figure 5 shows the earth pressures experienced by the four pressure cells. The vertical and the horizontal soil pressure increased during the first month, indicating the stabilization of the backfill. After the initial stabilization, it appears that the backfill entered a relatively stable stage with the two vertical measurements approaching each other and the two horizontal ones close to each other as well.
0 20 40 60 80 100
25-Oct 14-Nov 4-Dec 24-Dec 13-Jan 2-Feb
Date Ea rth Pr e s s u re (k Pa ) 2005 2006 Horizontal Sensor 1 Horizontal Sensor 2 Vertical Sensor 2 Vertical Sensor 1 Predicted vertical soil pressure
Figure 5. Earth pressures in the trench
4.4 Pipe displacements
The pipe displacements measured by three displacement transducers are shown in Fig. 6. An initial downward movement was observed for all the three locations. The downward movement was induced by increased pressure from the backfill during construction. After the construction, the pipe tried to establish its new equilibrium position and the displacements were recovering gradually. It can also be observed that the pipe had bigger displacements in its mid-span location (Pos 2) than those of the two other measured locations (Pos 1 and Pos 3). It is understandable because the two ends of the pipe were restrained by joints and could only move slightly in the vertical plane. If the sand bedding was more or less evenly distributed, the pressure from backfill and soil stabilization would produce a bigger displacement around the mid point of the pipe section.
-12 -10 -8 -6 -4 -2 0
25-Oct 14-Nov 4-Dec 24-Dec 13-Jan 2-Feb
Date P ip e D isp lacem en t (mm) 2005 2006
Pos 1 Pos 2 Pos 3 North Joint Joint
Pos 3
Pos 2 Pos 1
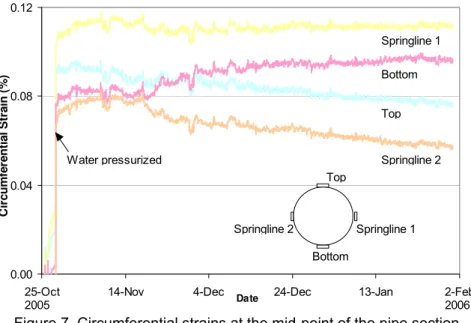
4.5 Circumferential strains
Figures 7 shows the measured circumferential strains at the mid-point of the pipe section (Pos 2). The strains at the other two locations (Pos 1 and Pos 3) have the same magnitude and similar change pattern and are therefore not included here. All the sensors experienced a sudden increase in tensile strain because the pipe was water pressurized at the 4th day of the construction. This figure shows that after pressurization the circumferential strains were in the range between 0.06% and 0.12%.
0.00 0.04 0.08 0.12
25-Oct 14-Nov 4-Dec 24-Dec 13-Jan 2-Feb
Date C ir c um fe re nt ia l S tr a in ( % ) 2005 2006 Top Springline 1 Springline 2 Bottom Top Springline 1 Springline 2 Bottom Water pressurized
Figure 7. Circumferential strains at the mid-point of the pipe section
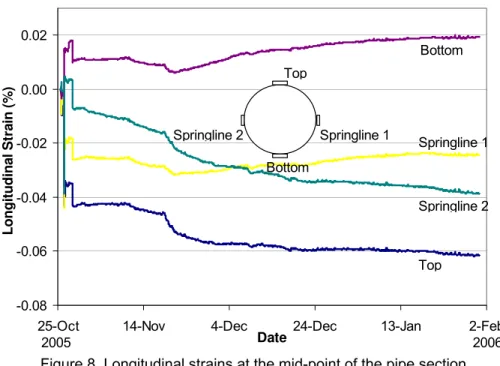
4.6 Longitudinal strains
The longitudinal strains at the mid-span section (Pos 2) of the pipe are shown in Fig. 8. The longitudinal strains at the other two locations have a pattern similar to that shown in this figure and are not included here. It is noted that the strain at the top of the pipe has a negative sign whereas that on the bottom of the pipe a positive sign, indicating the pipe was bending downwards, which is consistent with the measurements from the displacement transducers. The strains from the two springlines fall between the top and the bottom, suggesting that the horizontal deformation of the pipe is not as great as the vertical.
4.7 Discussion
In previous sections, the measured soil properties (temperature, water content and pressure) and pipe deformation (displacement and strain) in the three month period following installation are shown. In this section, the longitudinal and circumferential stresses were calculated from the measured strains and their characteristics are discussed. Also, the soil pressure and circumferential stresses are predicted theoretically and compared with those based on the measurements.
Soil pressure
PVC pipe is a flexible pipe, the external loading on the pipe can be taken as the prism soil load (Moser 1990):
(1) W =
γ
⋅h⋅Bcwhere W is the earth load on flexible pipe, γ the unit weight of soil backfill above the pipe, h the height of soil backfill above the pipe, and the pipe outside diameter. The unit weight of the soil backfill above the pipe can be calculated based on the field measured dry density and water content data. From Eq. (1), the soil weight on the pipe was calculated and is shown in Fig. 5. A fairly good agreement was observed between the calculated soil weight and the measured vertical soil pressure. It should be noted that the predicted vertical soil pressure is based on the field measured dry density and water content data during construction only. As can be seen from Fig. 4, the water content was changing constantly. Also the soil dry density may also change with time after construction due to soil stabilization. Therefore, it is expected that
c B
the predicted vertical soil pressure will also change with time. A more accurate prediction would require detailed numerical analysis.
-0.08 -0.06 -0.04 -0.02 0.00 0.02
25-Oct 14-Nov 4-Dec 24-Dec 13-Jan 2-Feb
Date Lon git u d ina l S tr a in ( % ) 2005 2006 Top Springline 1 Springline 2 Bottom Top Springline 1 Springline 2 Bottom
Figure 8. Longitudinal strains at the mid-point of the pipe section
Longitudinal and circumferential stresses
Although stresses on pipe cannot be directly measured, the stresses can be indirectly obtained from the measured strains and the water pressure, using the stress-strain relationships that include the thermal strain components: (2a)
[
(
)
]
T Ep a h r p a=σ
−υ
σ
+σ
+α
Δε
1 (2b)[
(
)
]
T Ep h r a p h=σ
−υ
σ
+σ
+α
Δε
1 (2c)[
(
)
]
T Ep r a h p r=σ
−υ
σ
+σ
+α
Δε
1where Ep,
υ
andα
p are the elastic modulus, the Poisson’s ratio and the coefficient of thermal expansion of the PVC pipe material, respectively,Δ
T
the temperature change of the pipe,ε
a andε
h the measured longitudinal and circumferential strains, respectively,ε
r the radial strain, andσ
a,σ
h andσ
r the longitudinal, circumferential and radial stresses, respectively. For simplified evaluation,σ
r is assumed to be the soil pressure measured by the two horizontal pressure cells at the pipe level, thenσ
a andσ
h, referred to as in situ stresses by Kuraoka et al. (1996), can be solved from Eqs. (2a) and (2b)based on the measured longitudinal and circumferential strains, and the measured soil pressure.
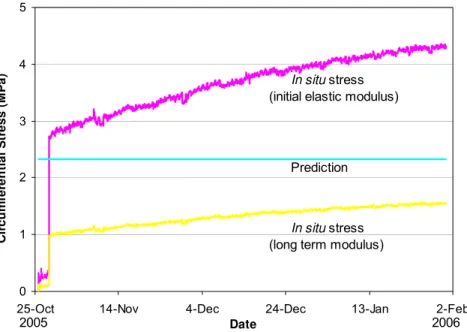
Figure 9 shows the average in situ circumferential stresses at the mid-point of the pipe section. Because
PVC pipe undergoes creep deformation under loading, two moduli were used to calculate the average stresses: one being initial elastic modulus of 3030 MPa, the other the long-term modulus of 1090 MPa (AASHTO 1998). The third curve is the predicted circumferential stresses on the outside pipe surface calculated from the following equation:
(3)
(
2 2)
2 2 2 2 2 2 i i e e i p h r r r r p r r r p − + − − =σ
where is the inside pipe radius, the outside pipe radius, the water pressure and the backfill soil pressure. The local operating water pressure is 390 kPa and the backfill soil pressure can be predicted from Eq. (1). As can be seen from the figure, the predicted circumferential stresses based on the operating water pressure and the predicted backfill soil pressure fall within the in situ stress ranges
calculated using the initial elastic and long term moduli of the pipe material. It should be noted that Eq. (3) is a simplified evaluation of the circumferential stress. The circumferential stress under external load also depends on the bedding conditions. The detailed analysis can be performed either analytically or numerically (Eatkins and Anderson, 2000).
i r re pi pe 0 1 2 3 4 5
25-Oct 14-Nov 4-Dec 24-Dec 13-Jan 2-Feb
Date C ir c u m fe re n ti a l S tr ess (M P a ) 2005 2006 In situ stress
(initial elastic modulus)
In situ stress
(long term modulus) Prediction
Figure 9. Comparison of the predicted circumferential stresses with
in situ stresses at the mid-span section of the pipe
The average in situ longitudinal stresses at the three locations (Pos 1, 2 and 3) were calculated using the
initial elastic modulus and are shown in Fig. 10. The stresses at the mid span (Pos 2) are higher than those of the other two locations (Pos 1 and 3). It is expected because the average longitudinal stresses were partly induced by temperature variation in the pipe while the pipe deformation is restrained by the surrounding soil (at each joint of the instrumented PVC section and the adjacent original AC pipe, longitudinal movement is allowed, thus, joint restraint along the longitudinal direction could be neglected). A drop in temperature, as observed in Fig. 3, will induce tensile stresses in the pipe due to the friction. The distribution of the longitudinal tensile stresses due to the thermal effect should be higher toward the center of the pipe and close to zero at the end of the pipe.
-0.5 0 0.5 1 1.5 2 2.5
25-Oct 14-Nov 4-Dec 24-Dec 13-Jan 2-Feb
Date Longit udina l S tr e s s ( M P a )
Pos 1 Pos 2 Pos 3 North 2005 2006 Joint Joint Pos 2 Pos 3 Pos 1
Figure 10 Average in situ longitudinal stresses along pipe
5. Summary and conclusions
An instrumented PVC pipe section was successfully installed to study the working environment and behaviour of a section of pipe in an area of Regina with a large inventory of AC water mains. This paper is a progress report on a research project on failure mechanisms of asbestos cement water mains in Regina, which is still under way. Additional results and analysis will be reported in due course as the monitoring study proceeds.
The sensors installed include gauges for measuring strains in the pipe wall; pressure cells in the backfill soil to measure the soil pressure near the pipe; thermocouples for soil temperatures; TDR for moisture content and displacement sensors for pipe vertical movement. The sensors are connected to an on-site data-logger and data are transferred daily to CSIR via a cellular phone link. The intended monitoring period is two years, starting in November 2005.
The data from the first 3 months suggest that most sensors are working well and agree qualitatively with our knowledge of the pipe and soil behavior under the specific environmental setting. The measured vertical soil pressure and the measured strains are within expected ranges.
The installation is the first of two installations with the second one comprised of an instrumented AC pipe section and backfilled with the clay soil removed from the trench. The two installations are expected to provide useful data on strains in the pipe, on pipe movement, on external loads, and on thermal performance of the pipe-soil system. The results of this in situ performance monitoring will provide a better
understanding of the pipe behaviour and pipe-soil interaction, and will be used to develop soil-pipe interaction models of AC pipes under expansive clay soil.
6. Acknowledgements
We extend our appreciation to Mr. Troy LaFreniere, Mr. John Sarasen, Mr. Greg McGorrian, and Mr. Brian Wirth and his field team of the Engineering and Works Department at the City of Regina, Mr. Kaveh Lotfian, Mr. Paul Kulpate and Ms. Yixiang Wang of CSIR, for their valuable assistance during the installation program.
7. References
1. American Association of State Highway and Transportation Officials (AASHTO). 1998. AASHTO LRFD Bridge Design Specifications, 2nd Edition, Section 12, Washington D.C.
2. Baracos, A., Hurst, W.D. and Legget, R.F. 1955. Effects of Physical Environment on Cast Iron Pipe,
Journal (American Water Works Association), 42:1195-1206.
3. City of Regina, 2004. Standard Construction Specifications, Third Electronic Edition, City of Regina
Engineering and Works Department.
4. Hamilton, J.J., 1966. Soil Moisture Depletion Calculations for Winnipeg, 1950-1963, Technical Paper No. 229, Division of Building Research, National Research Council Canada, Ottawa, Canada.
5. Hu, Y. and Hubble, D. 2006. Factors Contributing to the Failure of Asbestos Cement Water Mains, to be prepared to submit to the Canadian Journal of Civil Engineering.
6. Hu, Y. and Lotfian, K. 2006. Field Installation of an Instrumented Section of Water Main Pipe on Emerald Park Road, October 24 to 31, 2005, Progress Report to the Institute for Research in Construction, National Research Council, Ottawa.
7. Hudak, P.F., Sadler, B. and Hunter, B.A. 1998. Analyzing Underground Water-Pipe Breaks in Residual Soils, Water Engineering and Management, 145:15-20.
8. Kuraoka, S., Rajani B., and Zhan, C. 1996. Pipe-Soil Interaction Analysis of Field Tests of Buried PVC Pipe, Journal of Infrastructure Systems, 2:162170.
9. Mordak, J. and Wheeler, J. 1988. Deterioration of Asbestos Cement Water Mains, Final Report to the Department of the Environment, Water Research Center, Wiltshire, UK.
10. Moser, A.P., 1990. Buried Pipe Design, McGraw-Hill, New York.
11. Perpich, W.M., Lukas, R.G, and Baker, J. C.N. 1965. Desiccation of Soil by Trees Related to Foundation Settlement, Canadian Geotechnical Journal, 1:23-39.
12. Shah, K.R., and Razaqpur, A.G. 1993. A two-dimensional frost-heave model for buried pipelines. International Journal for Numerical Methods in Engineering, 36: 2545-2566.