SCHEME FOR UHV TRANSMISSION LINES
by
David Woo-Sang Tong
B.S., University of Pennsylvania (1968)
M.S., Massachusetts Institute of Technology (1971)
E.E., Massachusetts Institute of Technology (1972)
SUBMITTED IN PARTIAL FULFILLMENT OF THE REQUIREMENTS FOR THE DEGREE OF
DOCTOR OF PHILOSOPHY
at the
MASSACHUSETTS INSTITUTE OF TECHNOLOGY-June, 1975
Signature of Author... Department of Electrical
Certified by ...-. .
Accepted by...
Engineering & Com(Suter Science, May 23, 1975
:/e*@-@ ·. ·i11 i ·11-:...
Thesis Supervisor
Chairman, Departmental Committee on Graduate Students
ARCHIV!7 tPSS. uNSr TECe
Jut
9975
CAPILLARY ABSORPTION AS AN AUDIBLE NOISE REDUCTION SCHEME FOR UHV TRANSMISSION LINES
by
David Woo-Sang Tong
Submitted to the Department of Electrical Engineering and Computer Science on May 23, 1975 in partial fulfillment of the requirements for the Degree of Doctor of Philosophy.
ABSTRACT
Audible noise generated from water drops collected on the trans-mission line conductor surface during foul weather is a major concern in
UHV (ultrahigh voltage) transmission line design. Although the noise can be kept to an acceptable level by maintaining a surface electric gradient below 15 to 17 kV/cm, this alternative is quite costly since it would mean having larger conductor bundles and hence larger support towers as well. Several noise-reduction methods have previously been tried but none gave sufficiently satisfactory results.
A novel noise-reduction method is proposed in which capillary action is used to absorb the surface water drops into the field-free conductor interior. A high degree of surface wettability is a crucial ingredient in the absorption approach. Saturation places a theoretical limit to the effectiveness of this method during rain, but gravity-induced flow of the absorbed water helps to keep the conductor at an unsaturated state. Elec-trically shielded wicks can be placed at various points on the transmission line span to siphon off the draining water.
Fog and after-rain tests on several absorbent conductor designs demon-strated the effectiveness of the absorption scheme in reducing foul weather corona activity. Significant reduction in audible noise was achieved even at a surface electric gradient of 22 kV/cm. Degradation of surface wet-tability was found in the laboratory.
A quasi-one-dimensional model of vscosity-dominated,free surface flow is studied and laboratory experiments show that it is a useful repre-sentation of flow in an unsaturated conductor. It predicts that at the upper parts of the transmission line span, the flow tends to be uniform with a velocity linearly dependent on the conductor flow permeability and
angle of incline. At the horizontal midsection, the flow is shown to be diffusional in nature and must be promoted via the use of wicks.
Optimization of conductor geometry with respect to permeability is desirable since it minimizes the number of wicks needed per span. Sample calculations show that a near optimal design will require 5 to 7 wicks per span to prevent saturation in a continuous light rain fall.
Thesis Supervisor: Title:
Gerald L. Wilson
ACKNOWLEDGEMENTS
The author wishes to thank the following people:
Professor G.L. Wilson who supervised this thesis work and provided continual encouragement;
Professors J.R. Melcher and C.M. Cooke for their many helpful comments and suggestions;
Professor Inge Johansen for his cooperation during one of my most fruitful years of thesis research;
Mr. Joseph Cairns whose advice and help were invaluable in the making of the test conductors;
Messrs. Anthony Caloggero and Harold Atlas for their help in constructing experimental equipment;
Ms. Cha Mei Tang for our many useful discussions, for her assistance with the thesis preparations, and for putting up with me as her office mate;
Misses Barbara Smith and Susan Johnson for the professional tuping of this thesis;
Miss Jamie Eng who helped in drawing the illustrations;
members of the Electric Power Systems Engineering Laboratory who made life tolerable during moments of frustration.
TABLE OF CONTENTS Page TITLE PAGE ABSTRACT ACKNOWLEDGEMENTS TABLE OF CONTENTS LIST OF FIGURES LIST OF TABLES GLOSSARY OF SYMBOLS
THE STATE OF THE AUDIBLE NOISE PROBLEM
THE MECHANISM OF AUDIBLE NOISE GENERATION ON HV TRANSMISSION LINES
2.1 Introduction 2.2 Drop Formation
2.2.1 Surface Tension and Contact Angle 2.2.2 Effect of Weather
2.3 Electrohydrodynamic Instability 2.4 Drop-Corona Interactions
2.4.1 Zero Flow Rate 2.4.2 Nonzero Flow Rate 2.5 Corona-Noise Transduction
2.6 Proposed Noise Reduction Methods and Other Possibilities 2.6.1 2.6.2 2.6.3 2.6.4 2.6.5 2.6.6 2.6.7 Insulation dc Bias "Ultra-Corona"
Control of Surface Wettability Geometry Options Capillary Absorption Other Possibilities 1 2 4 5 CHAPTER 1 CHAPTER 2 9 13 14 16 22 22 22 23 26 27 29 30 39 41 43 45 46 46 47 48 49 49
CHAPTER 3 THE CAPILLARY ABSORPTION METHOD 51
3.1 The Basic Scheme 51
3.2 Capillary Absorption 51
3.3 Design of an Absorbent Conductor 53
3.3.1 Absorption Capability 53
3.3.2 Likelihood of Saturation 55
3.3.3 Drainage Efficiency 56
3.3.3.1 Random Porous Matrix 57 3.3.3.2 Regular Channel Structure 59
3.3.3.3 Wicking 63
CHAPTER 4 EXPERIMENTAL INVESTIGATIONS OF THE CAPILLARY
ABSORPTION METHOD 64
4.1 Aims 64
4.2 Description of Test Setup 64
4.3 Early Experimental Designs 67
4.4 The Grooved Stranded Conductor 73
4.5 Summary of Test Results 83
CHAPTER 5 A QUASI-ONE-DIMENSIONAL FLOW MODEL OF THE
ABSORBENT CONDUCTOR 86
5.1 General Discussion 86
5.2 Description of Model 88
5.3 An Alternative Approach 98
5.4 Theoretical Case Studies 98
5.4.1 Hydrostatic Limit 99
5.4.1.1 Uniform Flow 99
5.4.1.2 Steady State Drainage 99 5.4.1.2.1 q'=O; a Constant 100 5.4.1.2.2 a=O, q' Constant 103 5.4.1.3 Transient Drainage 104
Page EXPERIMENTAL CASE STUDIES OF FLOW IN A STRANDED
BUNDLE 6.1 Aims
6.2 Experimental Setup
6.3 Measurement of Permeability 6.4 Gravity Flow
6.5 Wicking and Horizontal Drainage 6.6 Transient Drainage
6.7 Summary
DESIGNING AN ABSORBENT CONDUCTOR 7.1 Design Considerations
7.2 Optimization of Conductor Geometry 7.3 Requirement on Transverse Permeability 7.4 Wick Design
7.5 Placement of Wicks
7.6 Evaluating Absorption Capability CHAPTER 8
APPENDIX A
CONCLUSIONS AND SUGGESTIONS FOR FUTURE RESEARCH BEHAVIOR OF PENDENT DROPS OF LOW SURFACE TENSION UNDER ELECTRIC STRESS
A.1 Discussion
A.2 Experimental Setup
A.3 Drop Behavior as a Function of Surface Tension and Conductivity
A.3.1 Positive dc A.3.2 Negative dc A.4 Description of Jets
A.4.1 Positive Jet A.4.2 Negative Jets
A.5 Formation of Jets at High Electric Gradients CHAPTER 6 109 CHAPTER 7 109 109 110 115 128 1 30 136 138 138 138 143 144 146 148 150 153 153 154 154 154 156 156 156 160 160
Page
APPENDIX B CALCULATION OF FOG CONDENSATION RATES B.1 Condensation by Droplet Settling
B.2 Droplet Impingement by Wind
B.3 Fog Droplet Collection by Electric Dipolar Attraction
B.4 Laboratory Measurements
APPENDIX C SURFACE TREATMENTS OF THE GROOVED CONDUCTOR C.1 Electropolishing
C.2 Anodizing
C.3 Maintaining Surface Wettability APPENDIX D
REFERENCES
REYNOLD'S NUMBER ESTIMATION FOR THE ABSORBENT CONDUCTOR BIOGRAPHICAL SKETCH 163 163 164 165 168 170 170 170 171 172 174 177
LIST OF FIGURES
page Fig. 2.1 Contact angle at a three phase boundary 25 Fig. 2.2 Illustration of contact angle hysteresis 25 Fig. 2.3 Shadowgraphs of pendent drops under electric stress 31 Fig. 2.4 Typical current waveforms from the positively stressed
pendent drop 32
Fig. 2.5 Visual corona from the positively and the negatively
stressed water drop 33
Fig. 2.6 a) Consecutive frames in high speed film of the tip portion of the positively stressed water drop (current
trace superimposed) 35
b) Scope current trace
Fig. 2.7 Typical current waveforms from the negatively stressed
pendent drop 36
Fig. 2.8 Consecutive frames in high speed film of the tip portion of the negatively stressed water drop 38 Fig. 2.9 Current waveforms of water drop under ac stress 40 Fig. 2.10 Conductor with insulating tubing 48
Fig. 3.1 A simple capillary tube 52
Fig. 3.2 Schematic of an unsaturated porous matrix 52 Fig. 3.3 A stranded bundle at successive stages of saturation 60
Fig. 3.4 Illustration of wicking 60
Fig. 4.1 Diagram of EPSEL test chamber 65
Fig. 4.2 Noise performance of wire-wound absorbent conductor 68 Fig. 4.3 Noise performance of porous conductor in fog and
in rain
Fig. 4.4 Draining the porous conductor with a wick 70 Fig. 4.5 Noise performance of porous conductor after rain and
page Fig. 4.6 Cross-sectional view of stranded conductor 75 Fig. 4.7 Fogging test results (at EPSEL)
of smooth conductor 76
Fig. 4.8 After-rain test results (at EPSEL)
77
Fig. 4.9 Noise performance of smooth vs. grooved conductors in
fog (Ohio Brass) 80
Fig. 4.10 Noise spectrum of smooth vs. grooved conductors after
1 hr. 20 min. of fogging, test voltage: 160 kV 81 Fig. 4.11 Noise performance of smooth vs. grooved conductors in
light rain (Ohio Brass), test voltage: 160 kV 82 Fig. 4.12 Comparison of visual corona from the smooth and the
grooved conductors 84
Fig. 5.1 Discrete modeling of parallel flow channels 87 Fig. 5.2 Continuum model of an absorbent conductor 89 Fig. 5.3 A stranded bundle at an intermediate level of saturation 89 Fig. 5.4 Control volume (dotted box) for integration 93 Fig. 5.5 Possible flow patterns with or without liquid addition 93 Fig. 5.6 Diagram of drainage with nonzero angle of incline 101 Fig. 5.7 Profiles of uniform flow with a saturated end condition 102
Fig. 5.8 Horizontal drainage by wicking 101
Fig. 5.9 A hypothetical transient flow profile 101 Fig. 5.10 Calculated profiles showing the effect of varying
K
x(q', O)
107
Fig. 6.1 Cross-sectional diagram of test bundle showing
position of manometer 111
Fig. 6.2 Diagram of flow experiments 112
Fig. 6.3 Diagram of apparatus for permeability measurements 113 Fig. 6.4 Approximating the interstice as a cylindrical pore 116
nage
Fig. 6.5 Profile of hm for 0 = 2 118
Fig. 6.6 Profile of hm for = 4 119
Fig. 6.7 Profile of hm for 0 = 6° 120
Fig. 6.8 Profile of hm for e = 8 121
Fig. 6.9 Graph of hm of uniform flow vs. flow rate 123 Fig. 6.10 Graph of maximum flow rate vs. angle of incline 123 Fig. 6.11 Apparent hysteresis in the flow profile 124 Fig. 6.12 Theoretical profile near a wick (hydrostatic limit) 125
Fig. 6.13 A possible flow situation 127
Fig. 6.14 Diagram of air-liquid interface in nonuniform flow 127
Fig. 6.15 Diagram of a wick 127
Fig. 6.16 Dependence of hm adjacent to wick on flow rate 131
Fig. 6.17 Drainage profile for L = 120cm 132
Fig. 6.18 Drainage profile for L = 60cm 132
Fig. 6.19 Drainage profile for L = 15cm 133
Fig. 6.20 Horizontal drainage rates 133
Fig. 6.21 Plot of tl/2 vs. distance from upper end of bundle 135
Fig. 6.22 Dependence of drainage velocity on angle of incline 135 Fig. 7.1 Another absorbent conductor design 140 Fig. 7.2 Dependence of flow capacity on channel size 140 Fig. 7.3 Increasing the permeability with nonconcentric
arrangement
Fig. 7.4 Diagram of flow in wicking 145
Fig. 7.5 Diagram of wick placement on transmission line span 147 Fig. A.1 Apparatus for observation of jet modes 155 Fig. A.2 Visual appearance of steady and unsteady jet modes
page Fig. A.3 Dependence of pendent drop behavior on surface tension
and conductivity 158
Fig. A.4 Three consecutive frames in high speed film of positive
jet 159
Fig. A.5 a) Consecutive frames in high speed film of negative
jet 161
b) Scope current trace
Fig. B.1 Electric dipolar attraction of fog droplets 166
Fig. B.2 Fog condensation by wind 166
LIST OF TABLES
Permeability of Some Materials
Table of Measured Permeabilities (in cc-sec/gm) Calculated Wick Spacing
Estimated Fog Collection Rates Table No. 3.1 6.1 7.1 B.1 Page 58 114 149 168
Glossary of Commonly Used Symbols
A,AC cross-sectional area of conductor
Aw contact area between wick and conductor
As area of flow at saturation
EEsEr electric field gradient f friction factor
g gravity
h height of liquid column, height of flow
hm height of liquid column in manometer (see Fig. 6.1)
ho height of conductor, height of flow structure
hs height of flow at saturation (may or may not be equal to h
o )
k permeability
kc channel permeability (related to available flow area) K permeability (related to total cross-sectional area and
nek includes liquid viscosity: K -ec)
ne pore volume ratio, pore area ratio
p pressure
Pb liquid pressure at the bottom of the flow structure
PC capillary pressure (determined by the curvature of meniscus) pO atmospheric pressure
Q flow rate (in conductor)
q' influx rate, condensation rate (cc/cm2-sec) Q' influx rate, condensation rate (cc/cm-sec) Qmax flow rate when conductor is completely filled
QS flow rate when conductor is saturated (Qs may or may not equal Qmax)
ro,rc characteristic dimension of flow channel
Rc radius of conductor V,Vs,vO,VO velocity
W,Weff width sin
cos e
y surface tension coefficient
0 conductor (flow structure) angle of incline contact angle
p density
co electric permittivity of air
CHAPTER 1
THE STATE OF THE AUDIBLE NOISE PROBLEM
Corona generated radio and television interference and power losses have continually been annoying problems associated with high voltage over-head transmission lines. The usual practice in designing the conductors has been to keep the maximum surface electric field strength below 70% of
dry corona threshold. The advent of extra-high voltage (EHV) transmission systems (500 kV - 750 kV), resulted in efforts, for economic reasons, to minimize conductor sizes with the effect of increasing the maximum field so that it more nearly approaches the dry corona threshold. For example, American Electric Power's 765kV system is designed to have a maximum field strength at about 80% of threshold.(') At these levels of field strength, corona-generated audible noise during periods of foul weather becomes
increasingly significant compared to the other corona-associated problems. Complaints from people residing near UHV lines have grown into court cases. In view of the recently developing consciousness of environmental pollution, audible noise reduction is considered by system planners to be critical in the design of UHV transmission lines.
Two types of corona phenomena on transmission lines are distinguished. Fair weather corona is usually associated with attached foreign particles. So far, the electromagnetic and acoustic disturbance created by this type of corona has been insignificant compared with the accompanying power losses. Foul weather corona, on the other hand, is associated with water drops or forms of solid precipitation which adhere to the conductor surface and greatly intensify corona activity. Power losses in foul weather,
only during a small percentage of the time. The other corona-associated problems cause much more concern. On a subjective basis, audible noise is more annoying than radio or TV interference since it is readily detected by the human ear.
The introduction of EHV and later of UHV (ultra-high voltage) trans-mission systems focused a great deal of attention on acoustic noise
generation during foul weather. The reported work can be classified into two categories. One is concerned with clarifying the basic mechanism of noise generation and has the goal of finding noise reduction methods that
are more economical than existing means. The other is concerned mainly with the empirical study of noise generation with emphasis placed on the
characterization of the noise and its psychological effects. Much of the reported work in this latter category deals with measuring the dependence of noise on various system parameters including weather conditions,
applied voltage, conductor bundle and subconductor (one of the conductors in a multiconductor bundle) sizes. The goal of these empirical studies is to establish design criteria using known techniques; e.g., manipulation of conductor geometry.
Early research work on audible noise focused on the behavior of the water drops and the associated corona characteristics. In 1964, Tsunoda
and Arai( 2) and later Akazaki( 3) made experimental studies of corona from single water sites. In their experiments, water was dripped periodically onto an energized cylindrical conductor. Measurement of the current wave forms revealed that the corona modes were positive streamer pulses( 4 ) for positive imposed voltage and Trichel pulses(4 ) for negative imposed volt-age. Two types of noise, described as crackling and hissing, were
detected depending respectively on whether the drop was emitting water or not.
About the same time Boulet and Jakubczyk(5 ) also studied this problem. The same kinds of corona waveform were recorded. Although the investigators recognized that the water drops caused local field intensi-fication, they did not delve into the details of the process. Wettability of the conductor surface was also recognized as having an effect. An attempt was made to eliminate the surface drops by using a nonwetting
sur-face, but no improvement was found.
Research on audible noise dwindled during the late 1960's until further interest was revived with the introduction of UHV transmission at about the turn of the decade. In the United States, a group of audible noise
related papers appeared in which American Electric Power and Westing-house(6 '7 ) and Project UHV of General Electric 8 '9) were the primary
con-tributors. Much of this research concentrated on developing the ability to predict the noise performance of a given conductor configuration. The same kind of work was pursued in Canada(10) as well as in Europe(l l ) where
UHV transmission was also anticipated.
At the Massachusetts Institute of Technology effort was continued toward developing further understanding of audible noise generation.
Hoburg and Melcher(12) studied the electrohydrodynamics of a single pendent drop with applied voltage and flow rate as controlled parameters. They found that the drop behavior could be classified into three distinct modes characterized by the drop motions and by the attendant corona. This work represents the first time that flow rate was recognized as a significant factor in noise generation.
At our laboratory, the Electric Power Systems Engineering Laboratory of M.I.T., the noise spectra of single corona sites and corona-to-noise transduction mechanisms were investigated. With the very regular corona
pulse patterns generated by metallic protrusions, a close correlation was found between the current pulse frequency and the noise spectral peaks(l3). Noise spectra were measured for the various modes of behavior as described by Hoburg and Melcher. These were in general quite flat in the audible
region above 1 kHz with positive corona noise noticeably higher than negative corona noise. Impulsive heating by streamers and field-induced
space charge motions were investigated by Bosack(1 4 ) as noise transduction mechanisms. These appear to be respectively responsible for the high and low frequency parts of the noise spectrum as measured in the field.
Various noise reduction schemes were proposed and tested. The ones considered in this thesis exclude the simple but costly enlargement of the conductor sizes to reduce the surface electric gradient. These schemes
can be categorized into several types which include insulation coverings, control of surface wettability, variation of conductor geometry, and the so-called "ultra-corona" method. Each of these met with various degrees of success while most introduce associated problems.
Without a suitable noise reduction method on hand, the power industry is preparing to accept, at least for the time being, the presence of corona as a necessary evil. Conductor bundle sizes are simply chosen to be large enough so that the audible noise is kept to an acceptable level. For the
projected levels of 1500 kV, the constraint of noise performance may well be impossible to meet economically with sufficiently large conductor bundles. A low cost and effective noise reduction method may yet have
critical bearing on the feasibility of UHV overhead transmission lines and would be an economizing means for lower voltage lines.
This thesis continues the effort to gain understanding of the noise generation process and develops a new reduction method. Although previous
research has shed light on various aspects of the process, the total
picture is not yet complete. For example, the very complex two-way inter-action of water drop and corona still remain unclear. Also surface
wettability has not been considered in more than very simple qualitative terms.
In Chapter 2, the process of foul weather audible noise generation is discussed at length. The overall process is broken down into distinct steps from the formation of surface drops to the actual generation of
acoustic sound. An attempt is made to combine previously reported work as well as new information into a coherent overall picture. At the end of the chapter proposed noise reduction schemes are reviewed and their potential evaluated in light of the overall picture.
The theme of this thesis is presented in Chapter 3, where the idea of capillary absorption is discussed, first on general terms, and then more specifically as applied to audible noise reduction. The effectiveness of this method under various weather conditions is also considered.
Experimental evaluation of the capillary absorption method is described in Chapter 4. Results of tests on several absorbent conductor designs are presented, most of which were performed in the small test chamber at our laboratory using 6 ft. long conductors. A 24 ft. long conductor of one particular design was tested at the Ohio Brass indoor HV test facility. The results show that this method is quite effective in reducing noise
even at very high surface electric gradients. Surface wettability is brought out as the single most important factor in the efficacy of this scheme.
An obvious limitation to the absorption method is the possibility of saturation. Estimates show that saturation can be reached even in light rain of average duration. Fortunately, flow is promoted inside the absor-bent structure by the action of gravity, thus tending to maintain an un-saturated state. The water collected at the lower midspan region can be siphoned off using wicks which are electrostatically shielded. In order to understand quantitatively the internal flow and the wicking process, a theoretical flow model is developed in Chapter 5, and flow experiments are described in Chapter 6. Comparison of experimental and theoretical re-sults show that the theoretical model is a useful representation of a
capillary flow structure in the unsaturated state. In addition to predict-ing the flow capability of a given absorbent structure, the model also predicts the existence of a limit on wicking efficiency.
Using the material developed in the previous chapters, Chapter 7 illus-trates the designing of a sample porous conductor having real transmission
line dimensions. The conductor geometry is optimized with respect to absorbency and flow capacity; design considerations of the wick are discussed; and the positioning of wicks on the line is calculated for a light rain condition.
CHAPTER 2
THE MECHANISM OF AUDIBLE NOISE GENERATION ON HV TRANSMISSION LINES
2.1 Introduction
Water drops on the surface of high voltage conductors have long been known to affect corona production. As early as 1915 Peek(1 5 ) showed that the corona threshold of a conductor is lowered by the presence of moisture and included a correction factor in his well-known formula of corona onset. Since that time, the subject of electrically stressed water drops has been
investigated in the disciplines of electrohydrodynamics and corona dis-charges. It is now possible to piece together a fairly complete picture of the foul weather audible noise generation.
The process begins with the formation of water drops on the surface of the conductor during foul weather. At a critical combination of drop size, shape, and surface electric gradient, the drop becomes unstable. The de-formation of the drop grows rapidly and in such a way as to increase the
field intensification. This leads, under atmospheric conditions, to localized corona and thus to the problems of radio and TV interference, audible noise, and power losses. The observed overall behavior of the water drop is the complex interaction between the drop surface and corona space charge via local electric field distortions. In the following sec-tions, each step of the drop formation-instability-corona-noise process is discussed in detail.
2.2 Drop Formation
The first step in the process of foul weather corona generation has been given relatively little attention. Wettability is known to affect
drop behavior and also noise generation. Water tends to spread out over an aged conductor surface and to collect as drops only at the bottom. In contrast, water tends to bead on a new conductor due to a thin film of lubricant from the manufacturing process. The lower noise levels recorded from aged conductors has been attributed to there being fewer corona sites. The wetting character of aged conductors prevails however only after pro-longed exposure to a humid atmosphere or after thorough drenching in rain. Drop formation in fog has hardly been investigated and noise measurements in fog have been largely neglected because of the irreproducibility of the data.
In this section, the effect of wettability is discussed using surface chemistry concepts. Drop formation is shown to be dependent on both sur-face and weather conditions.
2.2.1 Surface Tension and Contact Angle
Surface tension is commonly known as a force per unit length associated with a surface dividing two homogeneous media. The analogy to a rubber membrane is often made. Unlike a rubber membrane, surface tension is not derived from elastic energy of the medium; rather it results from molecules at a surface experiencing a net attraction toward the interior. Thus
sur-face tension is more correctly considered as an energy per unit area. For practical purposes the concept of force per unit length is easier to
visualize and leads to correct results. Although effects of surface tension are most commonly observed on deformable liquid-gas interfaces, surface energy is also associated with solid-liquid and solid-gas inter-faces.
When a drop comes in contact with a solid surface, a three phase boundary separating solid, liquid, and air results as shown in Fig. 2.1. The contact angle is a measure of the wettability of the liquid on the solid. A 0 or 1800 contact angle indicates respectively perfect wetta-bility or perfect nonwettawetta-bility. The angle of 900 roughly separates the wettable, or hydrophilic if water is involved, and the nonwettable, or hydrophobic, regimes. The Young-Dupre equation( 16 ) , derived from simple force balance,
Ysg-YsL-YLgCO S = 0 (2.1)
gives the relationship between 4) and the surface tension coefficients which are in fact the surface forces per unit length.
Since surface tension involves only the top most layers of molecules at the surface, contamination can occur quite easily. A single layer of
foreign molecules on the surface can drastically change the surface tension. For example, water on glass has a 00 contact angle if the glass surface is carefully cleaned. The fact that one commonly observes water beading on
glass is evidence of the ease of contamination.
In physical situations a complicating effect known as contact angle hysteresis is usually manifest to some degree; the apparent contact angle can assume any value within a finite range depending on the way the system arrived at the final configuration. This phenomenon is best illustrated by a drop resting on an inclined plane as shown in Fig. 2.2. On the lower
side where the liquid is advancing onto dry surface, the contact angle is larger and is referred to as the advancing angle. On the upper side where the liquid is advancing onto wetted surface, the contact angle is referred
YLg
Ysg
YsL
Fig. 2.1 Contact angle at a three phase boundary
I gravity
receding
gas
advancing angle
Fig. 2.2 Illustration of contact angle hysteresis
gi
to as the receding angle. The difference in the two contact angles can easily be 40 or 50 degrees. Another example is paraffin and water; the contact angle differs significantly depending on whether the paraffin sur-face is initially dry or has been soaking in water for some time. Because of hysteresis, a discussion of wettability must include the history of the wetting process.
There are three possible explanations for the occurrence of hystere-sis(l6). First, contamination of the surface results in an apparent value of the surface tension. As the liquid moves over the solid, dissolution of the contaminant changes the apparent surface tension. Second, surface irregularity can cause apparent hysteresis even though, on the microscopic level, the true contact angle exists. An extreme example of this is the three phase boundary that occurs at an edge of the solid; the boundary behaves as if it is pinned there. Third, adsorption of liquid molecules on a solid-gas interface changes the surface tension there.
2.2.2 Effect of Weather
The hysteresis phenomenon can explain the differences in surface drop formation in fog versus rain. During fog, microscopic-sized water droplets impinge on the conductor surface by the action of wind, gravity, or
electric dipolar attraction. Some percentage of the impinging droplets adhere to the surface and these conglomerate eventually into visible sur-face drops. The originally dry conductor sursur-face is covered by randomly arranged wet and dry patches. The drops which occupy the wet regions grow and expand into the dry regions so that the observed contact angle is pre-dominantly the advancing angle. The three phase boundary might be viewed as an energy barrier which prevents spreading even though the spread-out
configuration may be energetically stable. Upon continued water condensa-tion, the wet regions ultimately spread over all of the surface and the receding contact angle applies everywhere. If the receding angle is near zero, then a water film covers the entire surface. Of course if both the receding and the advancing angles are large, then the water continues to be concentrated as surface drops.
The situation in rain is somewhat different. When a rain drop impinges on the surface, there is sufficient mechanical energy to overcome the
spreading barrier. Also, the rate of water deposition is greater than that in fog by orders of magnitude, and the entire surface can be very quickly wetted.
From this discussion, variability in fog tests is not too surprising. In addition to surface contamination and contact angle hysteresis, tempera-ture gradients, fog parameters, and wind can all affect drop formation during fogging. In rain, all these effects are overwhelmed by the heavy flow rate. The much more consistent results for rain tests make them generally preferable over fog tests as a measure of noise performance of a given conductor geometry.
2.3 Electrohydrodynamic Instability
When a liquid surface is subjected to normal electric stress, the sur-face deforms in order to achieve force balance at the sursur-face. Since the surface in general places a boundary condition on the electric field, its deformation leads in turn to a rearrangement of the field pattern. Thus the problem of determining the surface configuration involves strong coup-ling between the electric field and the surface geometry and is usually very difficult to solve analytically or even numerically.
Qualitatively, the general behavior of electrically stressed liquid surfaces is well established. For sufficiently low field gradients, the surface attains a stable configuration in which an exact balance exists between electric forces and mechanical forces, which include here the internal pressure and surface tension. As the applied electric field is increased, a well defined critical point can be reached when the equilib-rium is no longer stable. The system configuration then undergoes con-tinuous motion or settles at another equilibrium point.
As early as 1887 Lord Raleigh(1 7) calculated the critical charge that a free drop can support.
Q2rit = 16 r (mks) (2.2)
where is the permittivity of the surrounding medium, r the drop radius, and y the surface tension coefficient. This particular configuration is relatively simple to analyze because the equilibrium shape remains spheri-cal up to the point of instability. Later, the stability problem of a free drop, either charged or uncharged, situated in a uniform electric field was investigated by Zeleny 18), Macky 9 ), Taylor 20 ), and others. This
problem is analytically more difficult since the equilibrium shape changes with the applied field. Wilson and Taylor(21), experimenting with soap
bubbles, and later Macky(1 9 ) with water drops showed that the critical electric field strength is given approximately by
Ecrit = (485 volts/dynel/2 )/y/r o (cgs) (2.3)
Thus the critical gradient for instability increases with decreasing drop radius.
Dudley(22) investigated the threshold of instability for pendent drops both theoretically and experimentally. He considered the 0 and the 900 contact angle cases under atmospheric pressure. His results showed that similar to Eq. (2.3) the threshold gradient increased with decreasing drop size. For both contact angles, the critical gradient for drops as small as 1 mm in height (as measured from the electrode surface to the drop tip at zero voltage) is about 15 kV/cm.
The concurrent appearance of corona with drop instability raises the question as to which one occurs first, corona or instability. Corona onset
is known to be a strong function of ambient pressure 4 ), whereas instability is totally independent of it. Working with drops of radii 1 mm or less, English( 2 3 ) and Dawson(24 ) showed that the voltage at which corona appeared was independent of the ambient pressure until the pressure was well below atmospheric. Also, in the pressure-independent range, this critical volt-age was polarity-independent. Considering Eq. (2.3) there is little doubt that for the much larger pendent drops of interest, instability is the
cause and corona appearance is the effect. 2.4 Drop-Corona Interactions
Existing high voltage transmission lines usually have a surface
electric gradient exceeding 16 kV/cm which surpasses the critical gradient of instability of visible surface drops. What is observed then is the behavior of the drops beyond the initial instability. For pure water drops in atmospheric conditions, the deformation always leads to corona. The rate of water addition and the surface electric gradient are the most important factors affecting drop behavior; contact angle appears to have little effect after instability. In this section single pendent drops on a
perfectly wetting surface are considered.
2.4.1 Zero Flow Rate
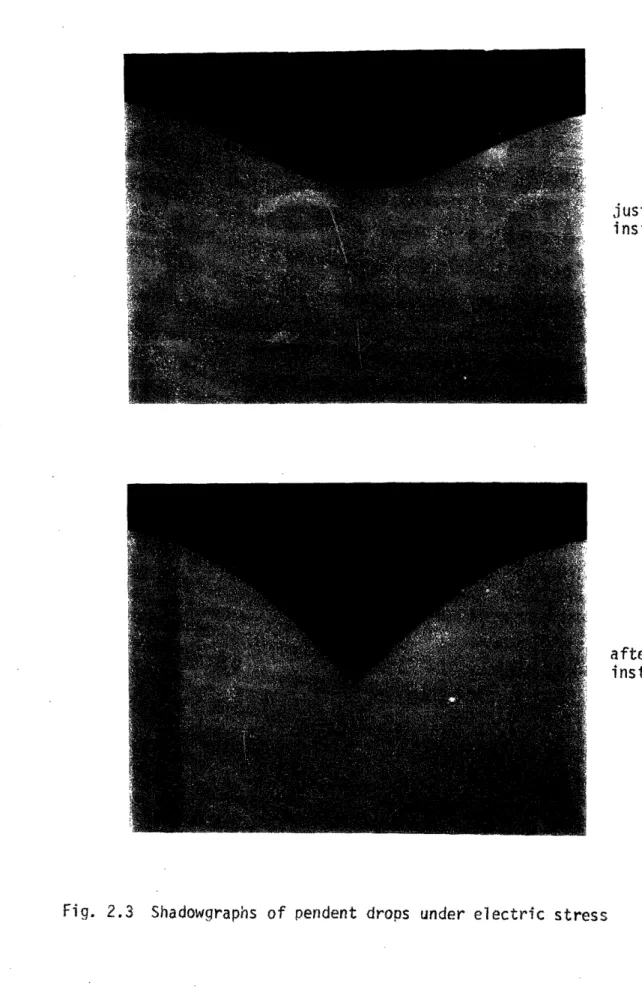
At instability, the drop either emits some water first or abruptly assumes a sharply pointed conical shape as shown in Fig. 2.3. This shape was reported numerous times in the literature(5' 18) Intrigued by its
common occurrence, Taylor(20)investigated the forces for an exact conical surface and found that, with gravity neglected, force balance is indeed possible, but only if the semivertical angle of the cone is 49.3 ° . The stability of the configuration as well as force balance at the singular tip remain unclear. For the pendent drop in air, the cone shape can be quite stable while corona issues from the tip. High speed movies of the tip region show that it is undergoing rapid oscillations (several hundred hertz) which correspond exactly with periodicities on the corona current waveform. The corona waveforms for the two polarities will be discussed separately.
a. Positive Polarity
The corona waveform is typically as shown in Fig. 2.4 where two dis-tinct periods are apparent. Pulse groups occur with a period of about 2 msec while pulses of each group occur with a period of about .1 msec. The number of pulses in each group is at least two and increases with
increasing voltage until the groups merge into continuous pulses. The fast rise time (on the order of 50 nsec) indicates the presence of
streamer corona which is further substantiated by time explosure photos of the luminosity showing the characteristic bright thin core and diffuse envelope of streamers (see Fig. 2.5).
just before instabi i ty
after
instability
Imsec/sq
1OV/sq (Oke resistance) (a) .l l psec/sq .5V/sq (00 series resistance) (b) 50psec/sq
,05V/sq
(lkQ series
resistance)
(C)positive
negative
Fig. 2.5 Visual corona from the positively and the negatively stressed water drop
It is known that streamer frequency is governed by space charge clear-ing time (4). For an ion mobility in air of about 2.5 cm2/V-sec, a 2 cm gap and an average field strength of 10 kV/cm, a clearing time can in fact be estimated on the order of .1 msec. The low amplitude tail following each pulse shown in Fig. 2.4c could be the result of drifting ions. The pulse waveform of Fig. 2.4.b is very similar in character to that measured by Akazaki(3) and Boulet and Jakubczyk(5 ) except for the difference in peak amplitudes which can be ascribed to the difference in surface gradients and electrode sizes.
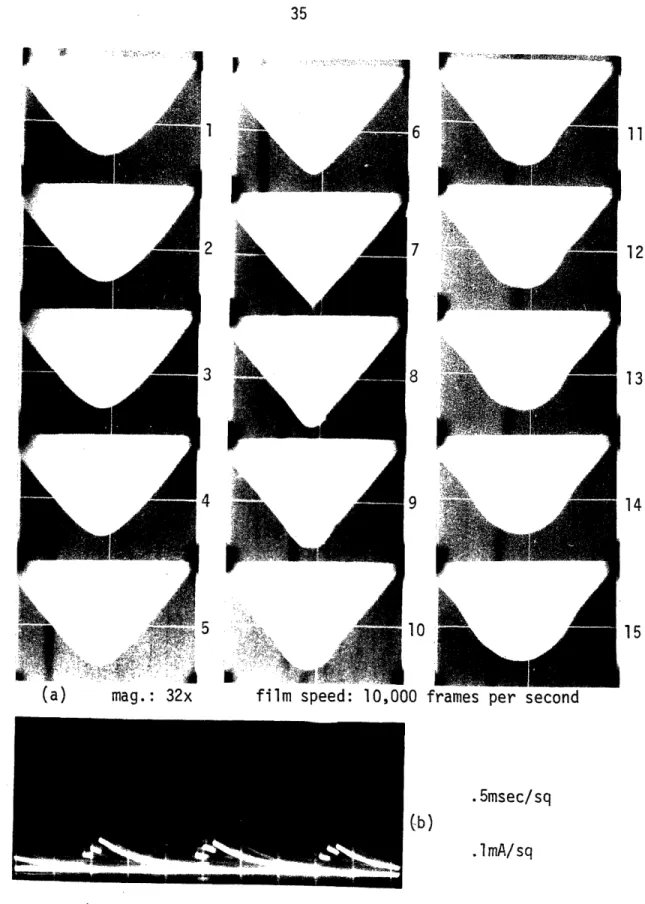
Figure 2.6 shows a section of the high speed movie containing one oscillation of the drop tip region. The superimposed current trace moves
from left to right for increasing current. A long decay time was intro-duced by the measurement circuit so that the current waveform is now as shown in Fig. 2.6b. Thus each jump in the current trace in the movie
indicates that a streamer pulse has just taken place. During each cycle of oscillation, the drop tip sharpens under the influence of the electric field until the appearance of the first streamer. Then either from space charge shielding or from streamer generated pressure wave, the net surface
stress reverses the tip motion. For a while as the tip recedes, conditions are still favorable for the formation of additional streamers. Finally all corona pulses cease; the electric stresses again predominate; and the entire process is repeated. It is noted that the first pulse of each cycle takes place with little variation, when the tip reaches a certain degree of sharpness.
b. Negative Polarity
I
v U1
3
mag.: 32x TIlm speea: u,uuu rames per second
Fig. 2.6 a) Consecutive frames in high speed film of the tip portion of the positively stressed water drop (current trace superimposed) b) Scope current trace
6 7 3 11 12 13 14 15 (a) 0 .5msec/sq (b) .lmA/sq 2 4 ] i c,_ 1 ... _1 '1 - A r
5V1 /so
res i
s t
an
Ce J(a
.
5
u,*
ti
(
O
t,
sri e{s
resi , r e ) VIsec/ V/ s sq(ikse series
resis'tane yistressed endeniq" ro}
i'
I -,2.7 T.ic
2.7~
, 0 -'cal; I ¢-- re.rre
,t.
wae-veforms
, .from
.thi-e
¢eatfive
. ,' "pulses which are similar in character to Trichel pulses. The period be-tween groups is lower than that in the positive case by about an order of magnitude. Each pulse group begins with a large amplitude pulse, followed by lower amplitude pulses which increase in amplitude and decrease in
frequency. Trichel pulses from a metallic electrode are known to increase in amplitude and decrease in frequency when the field strength is de-creased. Accordingly, it may be deduced that the pulses are occurring as the drop tip is receding. The first pulse has the largest amplitude probably because it occurs without space charge inhibition.
As in the positive case, the number of pulses in each group increases with applied potential. However, the pulses never completely fill the
entire period so that groups are always distinguishable.
A section from high speed movies taken of the magnified drop tip is shown in Fig. 2.8. Although the current trace is not included, there is little doubt that the current pulse groups are synchronized with the tip oscillations. This sequence of pictures shows no evidence of any water emission, in contrast to the observation of English(23) on a negatively stressed water point. English argued that since a water surface is unlikely to support negative corona, the corona he observed must be
positive corona emanating from emitted droplets. The results here refute that argument.
c. AC Applied Voltage
The addition of a forced 120 Hz oscillation complicates the drop dynamics. A point of instability exists, similar to the dc cases, which in fact corresponds closely to the dc threshold if the rms value of the voltage is used(22 ). Beyond instability, sharpending of the point again
1 2 6 7 3 4 5 8 9 0 mag.: 32x
film speed: 10,000 frames per second
Fig. 2.8 Consecutive frames in high speed film of the tip portion of the negatively stressed water drop (see Fig. 2.7 for current trace)
occurs, leading to positive streamer activity in the positive half cycle and to Trichel pulses in the negative half cycle. However, the regular pulse grouping of the dc cases is no longer present.
As shown in Fig. 2.9,a limited but distinct range of voltage exists in which only Trichel pulses are present without any observed positive
streamer. This concurs with previous observations(13'2 5 ) that negative corona threshold is somewhat lower than the positive corona threshold for a fine point electrode in atmospheric pressure.
2.4.2 Nonzero Flow Rate
In a series of experiments where flow rate and voltage gradient were controlled, Hoburg and Melcher(12 ) observed that the drop behavior for both dc and ac excitation could be classified into three distinct modes.
For low flow rates and gradients, mode I occurs where the drop periodically grows until disruption takes place. Some droplets are released each cycle with minor corona activity. In mode II, the regular drop disruption is
replaced by a somewhat steady elongation of the drop with water emitting from the tip periodically at few tens of Hz. Much greater corona activity is present which produces a crackling noise. Current waveforms show that positive streamers and Trichel pulses are the corona modes present.
Finally, for still higher flow rates and gradients, the drop tip elongates into a steady jet which terminates in a fine spray forming a conical
pattern. Corona occurs at a short distance above the jet-spray transition point. The current is steady, thus indicating glow corona, with possibly some superimposed pulses, and the attendant noise is much lower than in mode II. For the range of voltage gradients tested (up to 16 kV/cm), the flow rate necessary to maintain mode III is greater than 10 cc/min which
.07 ma/sq .2ms/sq (upper trace)
2ms/sq (lower trace)
applied gradient: 22 kV/cm (a) .3ma/sq 5ms/sq applied gradient: 33 kV/cm (b)Fig. 2.9 Current waveforms of water drop under ac stress
a) voltage just beyond onset (only Trichel pulses showing) b) voltage far beyond onset
is very large compared with the flow rates encountered in most foul weather conditions.
These experiments may be compared with those by Akazaki 3 , where water was dripped onto the conductor instead of being continuously fed. With the dripping scheme, the drop assumes more than one mode of behavior as water is periodically added and then depleted by emission. Mode III was not observed by Akazaki probably because the method used did not allow steady jet formation.
2.5 Corona-Noise Transduction
Having shown how corona comes about and the types of corona associated with the surface of water drops, we now consider the possible transduction mechanisms which convert electric energy into sound waves. These
mechanisms account for several major characteristics of foul weather audible noise which are apparent from field and laboratory measurements (see for example, ref. (7)):
1) The noise spectrum includes a relatively flat (white noise) region above several hundred Hz, a pronounced peak at 120 Hz, and other peaks at the harmonic frequencies of 60 Hz (hum).
2) The amplitude of the noise increases with the surface electric gradient.
3) The amplitude of the noise increases with the size of the conductor for the same surface electric gradient. This is equivalent to having a higher applied voltage or a smaller value of aE/arl at the surface.
Two likely mechanisms can be proposed. One involves the inhomogeneous heating of the air from energy dissipation and the other is the induced air
movements by the motion of ions in the applied electric field. In any given situation, both of these mechanisms act simultaneously.
Ianna, et.al. 3), investigated the noise spectrum above 1 kHz from single corona sites. For both metallic protrusions and water drops, the acoustic energy was well spread out in the audible range. Metallic pro-trusions produced pulses with fairly steady frequencies and noise spectral peaks could be detected at these frequencies and their harmonics. In contrast, corona pulses from water drops were sufficiently randomized by the drop motion that the noise spectrum contained no significant peaking above 1 kHz. With either type of corona source, the noise amplitude in-creased with increasing applied voltage, positive corona noise being always much greater than negative corona noise. Based on these observa-tions the following explanaobserva-tions can be made:
1) Noise increases with voltage since positive streamer amplitude and frequency increase with voltage.
2) Noise increases with conductor size for the same surface gradient since positive streamer amplitude also increases with conductor
size. Experimental measurements employing metal electrodes showed that streamers can vary in amplitude from .3 mA for thin needles
(4) to 250 mA for a .8 cm diameter hemisphere
From signal theory, a completely random train of pulses gives an exactly flat, white noise, spectrum even if the signal is modulated by a 60 Hz wave. Thus, based on randomly occurring corona pulses, the hum component in the transmission line noise spectrum cannot be explained. The ion drag mechanism, on the other hand, does offer an explanation. When there are many adjacent corona sites, their combined corona activity
creates sheaths of ions in the vicinity of the conductor surface. The coordinated motion of the ion sheaths under the applied electric field sets up pressure waves which are detected as sound. Since ions of both polar-ities are generated, the dominant frequency component is 120 Hz. With the ion drag mechanism, the average generated space charge governs noise
amplitude. Hence the smaller amplitude but higher frequency Trichel pulses could be equal in importance to the large amplitude, low frequency, positive streamers.
The complex nature of corona phenomena makes quantitative study of the noise generating mechanisms difficult. At our laboratory Bosack(1 4 )
tackled this problem with some limited success. He investigated theoretically and experimentally two simple cases, a single breakdown streamer site and a
long thin conductor in essentially uniform ac corona, and showed that the impulsive heating mechanism is dominant in the former case and the ion drag mechanism in the latter case. However, before such a theory can be applied to predicting noise on actual transmission lines, more details on the overall corona activity must be known. In particular, quantitative knowledge of the surrounding ion cloud is totally lacking at present. 2.6 Proposed Noise Reduction Methods and Other Possibilities
The foregoing discussion points out that audible noise generation includes very complex processes that remain only superficially understood. Yet with the available information, we can still make an assessment, though perhaps qualitative, of the various proposed noise reduction methods and develop as yet untried avenues. An appreciation of the following requires first some quantitative knowledge about existing HV transmission line con-ditions and the associated noise.
In HV transmission line design, the primary constraint on conductor size is surface electric gradient; the dry corona threshold must not be exceeded. As the transmission voltage increase, conductor sizes must in-crease to meet this constraint. For voltages exceeding a few hundred kilo-volts, each phase of the transmission line consists of a bundle of separate cables called subconductors, rather than a single conductor. For example, the existing 765 kV system of American Electric Power uses bundles of four 1.1" diameter ACSR conductors with a maximum surface gradient of 22 kV/cm. Acoustic noise is measured in terms of the pressure of the generated sound wave. Because of the large range of variation in detectable sound pressure levels (SPL), the magnitude is usually expressed in logarithmic form.
SPL = 20 log(p/po) (2.4)
where p is the pressure amplitude of the sound wave; p is a standard
pressure of 2xlO 5 N/m2 (the threshold of hearing at 1 kHz); and the result is in units of decibels (db). The SPL of severe foul weather audible noise at 100 ft. from the transmission line is on the order of 60 to 70 db. In comparing noise performance of conductors, a difference of greater than 5 db is considered significant. However, other system parameters such as weather conditions, conductor size, and surface gradient must be
consid-ered as well since the SPL difference may depend strongly on them. Although measurement of the entire audible spectrum is most infor-mative about the character of the noise, quite often a simpler measurement
is made of the sum of the various frequency components which are weighted in some fashion. In this way the noise is characterized by only one mag-nitude, making comparison of conductor noise performance much more
straightforward. Standard weighting networks, designated A, B, or C( 37 ), are available with the A-scale measurement being widely used in audible noise work since it closely resembles the response of the human ear.
On psychological terms, the nature of the noise is as important as its magnitude. The noise during fog or after rain is more annoying than that during rain because of the difference in ambient noise levels. Hum could be much more important than the higher frequency noise not only because of its psychological effects, but also because it attenuates less through air or other solid materials.
2.6.1 Insulation
A thin dielectric coating on the conductor has proved ineffective since the capacitive current alone is more than sufficient to sustain the corona current. Noise reduction does result if the insulating layer is thick enough to keep the drops in a region of substantially reduced gradient, but this is equivalent to enlarging the conductor.
Even for dc transmission systems, this scheme is questionable.
Reduction of field gradient at the water drop surface can be accomplished only by increasing the voltage drop across the insulation layer. This results from the accumulation of surface charge which in turn results from some initial corona discharges. For example, suppose that an insulating layer mm thick is used to reduce the surface gradient of a 765 kV
conductor by 5%. Then the layer must sustain a voltage difference of approximately 40 kV which is equivalent to 1 kV/mil. This value is
com-(38) parable to the breakdown strength of most known insulating materials In addition to the likelihood of breakdown, aging and heat dissipation problems may be severe with this approach.
2.6.2 dc Bias
Since positive streamers are known to be much noisier than Trichel pulses, the application of a negative dc bias voltage should reduce audible noise generation by the reduction of streamer activity. Some success was reported at GE's Project UHV using this approach.
Aside from the fact that implementation of this approach in the large scale is technically difficult, there are possible intrinsic limitations in its effectiveness. First, the accumulation of a negative space charge cloud, whose magnitude depends on the density of corona sites, tends to cancel the effect of the voltage bias. In heavy rain when the sites are numerous, no noise improvement was recorded.(39 )
Second, although Trichel pulses contribute relatively little high frequency noise, they contribute heavily to the space charge sheath. Hence the hum component may not be reduced by this approach. Finally, increasing the negative peak gradient may bring on negative breakdown streamers. The investigators at Project UHV did find a critical value of the negative peak voltage above which the audible noise increased.(3 9 )
2.6.3 "Ultra-Corona"
"Ultra-corona" was used initially to represent glow corona. Here it refers to the generation of relatively noise-free corona along the con-ductor so that the space charge produced would suppress the noisier corona modes. Boulet and Jakubczyk( 5 ) were the first to try this method by
wrapping around the conductor a lmm diameter wire at an average pitch of 3cm. They found that both radio noise and corona losses increased.
Implementing this method with regularly spaced points, Lecat(26) of
improve-ment of more than lOdb was achieved in the frequency range above 1 kHz. The power industry is rather skeptical of this method because of the continuous corona losses and other possible side effects such as ozone generation. If the ion drag mechanism is indeed important, then the
continuously generated space charge would likely result in an unacceptable hum level in both fair and foul weather.
2.6.4 Control of Surface Wettability
Surfaces can be made to become more, or less, wettable. In reality there are few perfectly wetting surfaces (and these are easily subject to contamination, as discussed earlier), and no known perfectly nonwetting
surface for water. Experiments have generally been made with surfaces that came as close as possible to the theoretical limits.
The number of corona sites are reduced on a wetting surface since drops spread into a film over most of the surface. This is the reason ascribed to the better noise performance of an aged conductor over a new conductor. The remaining water drops which hang from the bottom of the conductor limit the noise improvement to only a few db.
Boulet and Jakubczyk(5 ) tested the effect of a nonwetting coating; Paraffin (contact angle 105°) was the hydrophobic substance applied to the conductor surface. Negligible improvement resulted since a few small droplets remaining on the top of the conductor were in vigorous corona activity. The failure of this attempt is certainly not conclusive
evidence that a perfectly nonwetting surface will not work. The problem is that no known material is nonwetting enough; even one of the best known nonwetting materials, Teflon (polytetrafluoroethylene), has a
sufficient degree of hydrophobicity, and if it successfully withstands aging, then this method could be technically quite feasible.
2.6.5 Geometry Options
Noise reduction is possible by designing the conductor bundles such that water drops tend to form away from the high surface gradient areas. This idea was pursued with some success by Comber and Zafanella(9 ) using multiconductor bundles. Based on the tendency of water drops to form only on the bottom of a wetting conductor, the bundle was designed asymmetrically such that the surface gradient at the bottom of each conductor is minimized. The reported noise improvmeent was on the order of 6 to 10 db for a
maximum surface gradient of approximately 17 kV/cm.
A similar idea, also tested by Comber and Zafanella, is to place insulating tubing over the conductor as shown in Fig. 2.10. The diameter of the tubing is equal to the diameter of a normal conductor used for
comparison. Provided drops do not form on the top and sides of the tubing, where the field is high, a noise reduction of several db results since the bottom drops experience a reduced gradient.
Both of these schemes depend critically on the near perfect wettability of the surface; otherwise drops would form all over the conductor surface.
cnndurtnr
gravity 1
tubing
Figure 2.10 Conductor with Insulating Tubing
In the reported tests, the condition used was after-rain when the surface was already completely wetted. The requirement of wettability in fog would be much more stringent. Since some surface drops always remain, corona activity can be reduced only to a limited extent. In fact, the asymmetrical bundle test results showed no improvements at the surface gradient of 20 kV/cm.
2.6.6 Capillary Absorption
By absorbing the surface drops into the field-free interior of the conductor, corona and all the associated problems can be theoretically totally eliminated. Laboratory results have demonstrated the efficiency of this method in reducing noise. Practicality of the method has yet to be shown and the method depends critically on surface wettability which is at present insufficiently understood. The remainder of this thesis deals with the various aspects of the absorption method.
2.6.7 Other Possibilities
The methods presented above are ones that appear most practical and have all been tested experimentally. Heating and the use of surfactant coatings were two ideas considered but set aside in favor of the absorption method; their potential and practicality have not been thoroughly
investigated.
The idea of heating is motivated by the field observation that a conductor carrying large currents exhibits less corona activity. This is expected since a surface with a higher temperature than the ambient is thermodynamically less favorable for water condensation and would promote a higher evaporation rate of collected moisture. In the laboratory, surface drops take noticeably longer to appear on a conductor heated to 500C in a
heavy fog. With reasonable heating levels, however, little effect is expected in rain. The power lost in heating the conductor would be
prohibitively high unless heating currents can be controlled. Practicality and reliability of the control scheme is thus likely to determine the use-fulness of this idea.
A surfactant coating which releases controlled amounts of a surface active substance, thereby lowering the surface tension of the collected water drops, could affect corona generation. This idea differs from the control of surface wettability in that the primary objective here is to lower yLg (see Fig. 2.1). In general, when a solute is added to the water drop, it affects also sg and hence wettability as well. Appendix A
discusses the experimental observation that drops of low surface tension under electric stress tend to form jets. Besides having less acoustic noise, the jet mode also increases water emission rate. Unfortunately, with ac excitation, the forced 120 Hz motion of the drop interrupts the jet
(unlike mode III of Hoburg and Melcher where the high flow rate is sufficient to maintain the jet even with ac excitation) and corona pulses remain with little reduction in noise. This method deserves further attention for HVDC transmission lines.
CHAPTER 3
THE CAPILLARY ABSORPTION METHOD 3.1 The Basic Scheme
Just as a sponge absorbs water, a conductor can also be made to do so. Since high voltage conductor size is more constrained by corona threshold than by current carrying capability, a reasonable percentage of the con-ductor volume can be used to store moisture. By absorbing the surface drops into the field-free conductor interior, the cause for foul weather corona is removed. Saturation, of course, places a limit on the
absorbency. Fortunately, gravity can be used to effect drainage of the stored liquid, thus countering the effect of saturation to some extent. Before discussing how an absorbent conductor might be designed, the con-cept of absorption must first be understood.
3.2 Capillary Absorption
A curved liquid surface supports a pressure difference across the surface according to the Young-Laplace equation(16)
Ap = ( + 1 (3.1)
Rl R 2
1 2
where y is the liquid-air surface tension coefficient and R1 and R2 are
the radii of curvature in two perpendicular directions at a given point on the surface. This effect forms the basis of capillary absorption and can be illustrated by a simple capillary tube. In Fig. 3.1, the pressure
difference across the meniscus exactly balances the pressure head of the liquid column. If the meniscus is small, it can be approximated as part of a spherical surface of radius R/cos where is the contact angle, and the following relationship applies.
liquid
liquid / // / 'I2/ CZ R hF\L
gravity h /Fig. 3.1 A Simple Capillary Tube
Fig. 3.2 Schematic of an Unsaturated Porous Matrix
_
/
2y cos ¢ = pgh (3.2) R
Thus, the more wetting the walls are and the smaller the capillary dia-meter, the greater the liquid rise.
In a similar way, any structure that allows the formation of menisci will be able to absorb to a degree dependent on the curvature of the menisci formed. A simple example is any porous medium which is wetted by water. Although the absorption phenomenon is obscured in a porous medium by the random size and configuration of the pores and the presence of air spaces, the capillary tube analogy is in principle correct and is often used as an analytical model. In porous media literature the ability of the medium to absorb is often expressed in terms of a pore pressure(27), also variously represented as capillary pressure or suction pressure.
Depending on whether the liquid wets the porous material, the pore
pressure may be negative, with the medium tending to absorb the liquid, or positive, with the medium tending to exclude the liquid.
3.3 Design of an Absorbent Conductor
Several major questions need to be considered when capillary
absorption is applied to HV conductor design. First, is it possible for the capillary forces to absorb all the surface drops by overcoming
gravity and electric stresses? Second, can a large enough pore volume be made available such that saturation is not reached during most foul
weather conditions? And third, if saturation is likely and gravity drain-age must be facilitated to remove moisture, what kind of draindrain-age
efficiency can be expected? 3.3.1 Absorption Capability
the absorbent conductor is perforated with vertical cylindrical pores. Equation (3.2) shows that absorbency can be increased by decreasing the pore size. Here the degree of absorbency is measured by the height of water rise in the porous matrix if its bottom surface is placed in contact with a reservoir. For example, if the pore walls were perfectly wetting,
then from Eq. (3.1) with y = 73 dynes/cm, a pore radius of .5mm is
sufficient to support a water column 3cm in height and a conductor of that height will completely fill before saturation (saturation defined here as the point when the liquid pressure at the bottom becomes equal to the atmospheric pressure).
For any real solid porous matrix, its outer surface consists of pores leading into the interior as well as solid surface. Some water could con-ceivably remain on the solid portions instead of being absorbed through the pores and defeat the purpose of having absorption capability. Thus a sufficiently high density of surface pores is necessary.
For the transmission line problem capillarity is opposed by gravity and electric stresses. The relative magnitude of these forces can be estimated for a typical unsaturated condition as shown in Fig. 3.2. For generality, the vertical pores are shown to be interconnected by horizontal pores. With r = .5mm, h = 2cm, and Es = 30 kV/cm (near the breakdown
strength of air) and ignoring the possibility of instability for the moment, the important stresses can be estimated:
capillary pressure = 2y/ro = 3000 dynes/cm2 gravitational head = pgh = 2000 dynes/cm2 electric stress = s0E2/2 = 400 dynes/cm2
Thus the capillary force has to contend mainly with gravitational pull and easily overwhelms the electric surface stress.
The existence of an instability of the liquid surface at the bottom porous matrix-air interface, similar to the Raleigh-Taylor instability in hydrodynamics, is certainly a possibility. At saturation, the liquid sur-face goes unstable due to the gravitational field alone. However, at low saturation levels, instability is not likely because of the stabilizing effect of the menisci formed at the lower surface. As shown in Fig. 3.2,
the upper menisci have a fixed curvature as dictated by the contact angle so that the pressure of the liquid there is fixed, say at Pc' The lower menisci will assume whatever curvature is necessary so that the liquid pressure there is Pc + pgh. If Pc + pgh is less than p, the atmospheric pressure, then the lower menisci are concave inward. Suppose the equilibrium
state is disturbed so that some of the lower menisci reduce their curva-tures. To satisfy conservation of mass, some neighboring menisci must correspondingly increase their curvatures. The resulting perturbation in
the electric stresses will tend to increase the disturbance while the imbalance in pressure will tend to restore equilibrium. Because of the small pore size and the recessing of the liquid surface, the electric field perturbation at the liquid surface will be small compared to the pressure imbalance, and the system tends to be stable. Experiments described in the next chapter give conclusive evidence that for an unsaturated absorbent
conductor, no such instability exists below dry corona threshold gradients. 3.3.2 Likelihood of Saturation
Evaluation of the possible storage volume requires some knowledge on the condensation rates during foul weather. For the following calculations, the conductor is assumed to have a radius of 1.5cm and a pore volume equal to 20% of the total conductor volume.
The condensation rate in rain can be easily calculated using rain fall data, assuming that all impinging drops get absorbed and neglecting evaporation. With a 3cm exposed surface width and a pore volume of 1.4cc/cm, saturation can be expected for rainfalls greater than .47cm or
.18". Meterological data of the Boston area shows that this would occur for roughly 20% of the days in a year.
The condensation rate in fog is much more difficult to estimate because of the variability of many relevant factors and the sketchy fog data available. Three mechanisms of fog condensation are possible:
1) settling of fog droplets similar to the falling of rain drops; 2) impinge-ment of fog droplets carried by wind; and 3) dipolar attraction of fog
drop-lets by the action of the strong electric field. Appendix B calculates the possible condensation rates for these mechanisms and shows that in each case, the condensation rate is heavily dependent on fog droplet size. According to the calculations, saturation is not expected except in the worst cases; this conclusion is supported by field observations that visible surface droplets do not appear on conventional conductors until one to two hours
after fog begins.
3.3.3 Drainage Efficiency
When saturation occurs, an absorbent conductor would not perform many better than a nonabsorbent one with a wetting surface unless there is some means of reducing the saturation level. The natural answer is gravity drainage since most of an overhead transmission line span has a nonzero angle of incline. Steady axial flow would result from a balance between the gravitational force and the viscous drag force, and the flow capacity would depend on the angle of incline and on the size of the axially