HAL Id: hal-01707580
https://hal.archives-ouvertes.fr/hal-01707580
Submitted on 13 Nov 2020
HAL is a multi-disciplinary open access
archive for the deposit and dissemination of
sci-entific research documents, whether they are
pub-lished or not. The documents may come from
teaching and research institutions in France or
abroad, or from public or private research centers.
L’archive ouverte pluridisciplinaire HAL, est
destinée au dépôt et à la diffusion de documents
scientifiques de niveau recherche, publiés ou non,
émanant des établissements d’enseignement et de
recherche français ou étrangers, des laboratoires
publics ou privés.
A near-infrared, optical and ultraviolet polarimetric and
timing investigation of complex equatorial dusty
structures
F. Marin, P.A. Rojas Lobos, J.M. Hameury, R.W. Goosmann
To cite this version:
F. Marin, P.A. Rojas Lobos, J.M. Hameury, R.W. Goosmann. A near-infrared, optical and ultraviolet
polarimetric and timing investigation of complex equatorial dusty structures. Astron.Astrophys., 2018,
613, pp.A30. �10.1051/0004-6361/201732464�. �hal-01707580�
Astronomy
&
Astrophysics
https://doi.org/10.1051/0004-6361/201732464© ESO 2018
A near-infrared, optical, and ultraviolet polarimetric and timing
investigation of complex equatorial dusty structures
F. Marin, P. A. Rojas Lobos, J. M. Hameury, and R. W. Goosmann
Université de Strasbourg, CNRS, Observatoire Astronomique de Strasbourg, UMR 7550, 67000 Strasbourg, France e-mail: [email protected]
Received 15 December 2017 / Accepted 23 January 2018
ABSTRACT
Context. From stars to active galactic nuclei, many astrophysical systems are surrounded by an equatorial distribution of dusty material that is, in a number of cases, spatially unresolved even with cutting edge facilities.
Aims. In this paper, we investigate if and how one can determine the unresolved and heterogeneous morphology of dust distribution around a central bright source using time-resolved polarimetric observations.
Methods. We used polarized radiative transfer simulations to study a sample of circumnuclear dusty morphologies. We explored a grid of geometrically variable models that are uniform, fragmented, and density stratified in the near-infrared, optical, and ultraviolet bands, and we present their distinctive time-dependent polarimetric signatures.
Results. As expected, varying the structure of the obscuring equatorial disk has a deep impact on the inclination-dependent flux, polarization degree and angle, and time lags we observe. We find that stratified media are distinguishable by time-resolved polarimetric observations, and that the expected polarization is much higher in the infrared band than in the ultraviolet. However, because of the physical scales imposed by dust sublimation, the average time lags of months to years between the total and polarized fluxes are important; these time lags lengthens the observational campaigns necessary to break more sophisticated, and therefore also more degenerated, models. In the ultraviolet band, time lags are slightly shorter than in the infrared or optical bands, and, coupled to lower diluting starlight fluxes, time-resolved polarimetry in the UV appears more promising for future campaigns.
Conclusions. Equatorial dusty disks differ in terms of inclination-dependent photometric, polarimetric, and timing observables, but only the coupling of these different markers can lead to inclination-independent constraints on the unresolved structures. Even though it is complex and time consuming, polarized reverberation mapping in the ultraviolet-blue band is probably the best technique to rely on in this field.
Key words. galaxies: active – polarization – radiative transfer – scattering – circumstellar matter – stars: general
1. Introduction
Dusty disks are detected in a variety of astronomical sources that range from stars to the innermost regions of active galac-tic nuclei (AGN). A disk1 naturally forms when matter with
sufficient angular momentum is accreted onto a central object, regardless if it is a star, a neutron star, or a black hole. We know that dust grains can form at the outer rim of AGN and young stars accretion disks (Mundy et al. 1993;D’Alessio et al. 1998,1999; Czerny & Hryniewicz 2012) and the fact that disks are ubiqui-tous in the Universe naturally provides clues to the physics of accretion in various environments. By studying dust disks, we can put strong constraints on the formation mechanisms of dust grains, and how they survive and evolve.
Equatorial dusty mixtures can be probed locally, i.e., within the Galaxy, by observing stars. It is thought that almost all stars are born with circumstellar disks (Beckwith & Sargent 1996; Hillenbrand et al. 1998). Young stars often show protoplanetary disks, which are a collection of material left over from the stellar formation process. In Keplerian orbit, this circumstellar, flared region contains both gas and dust with a gas to dust ratio of ∼100 1 Collimated polar outflows, quasi-spherical winds, and jets can also
form during accreting periods, but these are beyond the scope of this paper.
(Beckwith et al. 1990). While the exact composition of dust in protoplanetary disks is poorly known, silicates and amorphous carbons covered by icy mantles are favored (e.g.,Pollack et al. 1994or, more recently,Jones 2016). After the accretion stage of the young stellar object, the dust mixture in the disk continues to evolve. The innermost grains start to collide and stick together, forming larger grains that sink toward the disk mid-plane due to the vertical component of gravity. Substantial dust settling can profoundly alter the geometry of the protoplanetary disk: the photosphere of the disk is dragged down with the dust (Dubrulle et al. 1995;Schräpler & Henning 2004). Turbulence, if any, tends to mix the grains back up again, resulting in non-homogeneous equatorial structures around the star that can be probed in the mid- and far-infrared, where dust thermally re-emits (Dullemond et al. 2007).
The infrared re-emission of dust was used to infer the exis-tence of dusty disks around more evolved stars, such as cool, old white dwarfs in planetary nebulae (Farihi et al. 2009; Clayton et al. 2014). A dust-related infrared excess was first discovered around the Helix planetary nebula bySu et al.(2007) and later surveys have found several other dust-encircled candidates (Chu et al. 2011). The 24 µm flux densities of hot white dwarfs and central stars of planetary nebula are more than two orders of magnitude higher than their expected photospheric emission, revealing the presence of cold dust disks (Chu et al. 2011).
A30, page 1 of14
The disk, in those cases, may derive from the AGB phase of the star evolution (Clayton et al. 2014) or collisions of Kuiper belt-like objects (Bilíková et al. 2012). It is not easy to distinguish between the two formation mechanisms as the system is not fully resolved. Disk sizes are hard to measure because the outer parts are cool and emit weakly, but it is thought that circumstellar disks extend up to a few hundreds of astronomical units (see, e.g., Vicente & Alves 2005). The inner part of the dusty disk is set up by the sublimation radius that depends on the dust composition and temperature of the central source (Kishimoto et al. 2007). Current millimeter and submillimeter/interferometers provide images of the dust and gas outer disks with an angular resolution better than 100 (i.e., 150 AU at the distance of the nearest star forming regions). As an example, the Atacama Large Millime-ter/submillimeter Array (ALMA) can reach a resolution of 0.500
at 950 GHz in its most compact 12 m array configurations. Using longer baselines (up to 14 km),Andrews et al.(2016) have suc-cessfully traced millimeter-sized particles down to spatial scales as small as 1 AU (20 mas).
High angular resolution observations can also be obtained in the K and N bands with the Keck Interferometer (Eisner et al. 2007) and the Very Large Telescope Interferometer (Jaffe et al. 2004), respectively. The former authors successfully resolved the circumstellar material 2.2 µm emission within the first astro-nomical unit around young stars. The later spatially resolved a parsec-sized torus-shaped distribution of dust grains in the Seyfert galaxy NGC 1068. This circumnuclear dust region was invisible to our instruments for a long time and is now at the edges of the resolution capabilities of current telescopes (Beckert et al. 2008). However, the true morphology and com-position of this equatorial region is still largely unknown; it would require us to resolve sizes inferior to a fraction of a parsec at mega-parsec distances. We thus need to find another observation technique to reveal the geometry of unresolvable dusty disks either around young stars or supermassive black holes.
Indirect techniques such as Doppler tomography (Marsh & Horne 1988) or eclipse mapping (see, e.g., Horne 1985) have widely been used for cataclysmic variables, but these are restricted to binary systems and cannot be applied to isolated stars or AGN. Another very successful method that can go beyond the resolution capabilities of current telescopes is the observation of polarized light. Polarization has proven to be independent of the size of the emitting/scattering region. Only the observed polarization degree and position angle are sen-sitive to the morphology, composition, and magnetic fields of the media that can emit, scatter, or absorb photons. Observing the polarized light of NGC 1068, Antonucci & Miller (1985) successfully unveiled the broad emission lines that were unde-tectable in the total flux spectrum. Those lines, obscured by the equatorial distribution of dust around AGN cores, were only revealed thanks to near-infrared, optical, and ultraviolet spec-tropolarimetry. They laid the foundations of the unified model of AGN (Antonucci 1993). Polarimetry is also extremely power-ful in detecting dusty equatorial structures around bright stars. The polarized light, emerging from scattering of stellar pho-tons on the disk surface, shaves off the unpolarized contribution from the central star. After correcting for stellar starlight dilution only the disk emission is detected thanks to its contrast. Imag-ing polarimetry then allows the disk inner regions to be revealed down to a few astronomical units (see, e.g.,Gledhill et al. 1991; Apai et al. 2004).
Now that we are able to detect the polarized signatures of dusty disks (at least around stars, not yet for AGN), it is
of prime importance to determine their true structure. Models from the literature almost systematically use plain, uniform, and constant density disks since they are easier to explore numerically. A simple geometry, reducing the model parame-ter space, is much less time consuming when radiative transfer or magneto-hydrodynamical simulations are used. Density vari-ations have been sometimes included (see, e.g., Walker et al. 2004; Pinte et al. 2009) and have already revealed a number of photometric and spectroscopic differences with respect to constant-density disks. The same conclusion applies to the disk geometry (Nenkova et al. 2002; Marin et al. 2015). Flared or cylindrical disks are the two most common morphologies used in simulations but it has been shown that the structure of circum-stellar and circumnuclear disks is more complex. Clumpy dusty structures have been detected around stars and brown dwarfs (e.g., in the σ Ori cluster, seeScholz et al. 2009) and from galac-tic structures (e.g., in NGC 4244, seeHolwerda et al. 2012). Even if the parsec-scale dust disk around the core of AGN has not yet been resolved to the point of detecting individual clumps, hydro-dynamical models predict that large homogeneous distributions of dust cannot be stable (Krolik & Begelman 1988). Various indi-rect evidences for the clumpiness of AGN tori are detected in the X-rays, where fluorescent line emission (Liu et al. 2016) and variations in the obscuring column density of edge-on Seyferts (Marinucci et al. 2016) strongly suggest a non-uniform equatorial torus morphology.
It is the aim of this paper to investigate in great detail the various morphologies and density stratifications of equatorial dusty disks. By doing so, we want to check whether near-infrared, optical, and ultraviolet polarimetry can shed light on the true geometry of those unresolvable regions. We consider disk parameters (in particular disk sizes) appropriate for AGN, but our results can be easily extrapolated to different environments. We thus study very realistic models of dusty environments that exist in accreting objects and present the radiative transfer code we used in Sect.2. We compile and discuss our results in Sect.3, where the photometric flux, polarization degree, polarization angle, and time lags for each of the 15 models are presented. We analyze the benefits, problems, and limitations of polarized time reverberation studies in Sect. 4 by comparing our con-clusions to recent observations, and we conclude our paper in Sect.5.
2. Models of equatorial dusty structures
In the following, we use a geometrical configuration that matches the observational constraints for AGN. Our goal is not to pre-cisely model a circumstellar or a circumnuclear disk. We instead test the impact of different geometries and compositions onto the resulting photometric flux, polarization, and time lags. We consider throughout this paper a flared disk with inner radius 0.1 pc and outer radius 10 pc. The first value corresponds to the inner radius set by dust sublimation theories for a typical Seyfert galaxy whose dust is mainly composed of graphite and silicate grains (Kishimoto et al. 2007). The outer radius is the typical torus extension set by modeling constraints based on spectroscopic and interferometric observations and is of order of 5–10 pc (Meisenheimer et al. 2008;Burtscher & Tristram 2013; Netzer 2015; López-Gonzaga & Jaffe 2016). The half-opening angle of the flared disk is set to 45◦. This corresponds to the esti-mated torus height derived from quasar observations (Sazonov et al. 2015), numerical modeling (Marin et al. 2012;Gnedin et al. 2015), and statistical analyses (Marin 2014,2016).
Fig. 1.Unscaled geometrical and density variations for our models of dusty disks. The first two panels show a model with a uniform geometry and the last four panel a set of fragmented disks. A uniform red filling indicates a constant optical depth, while a color gradient indicates a variation in the dust density with increasing radial distances from the central source. Details are given in the text.
2.1. Dusty disks with increasing complexity
We show in Fig. 1 the six different disk geometries we inves-tigate in this paper. We consider first a plain flared disk that is uniformly filled with dust. Its radial optical depth in the V band is larger than 100 to ensure a strong obscuration along the equa-torial plane (Antonucci 1993). This is the simplest configuration
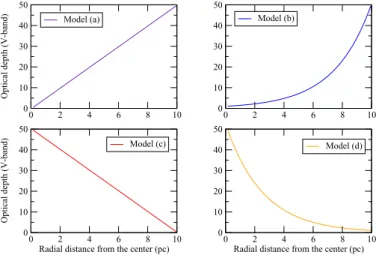
Fig. 2.Theoretical dust distributions corresponding to heterogeneously filled dust disks. Each model is color-coded and shows a different varia-tion of the radial optical depth (in the V band) with increasing distance from the central source. Details are given in the text.
and it is one of the most used in numerical simulations. Model number 2 is also a plain flared disk but its dust density varies with radial distance from the central source. The third model is a clumpy flared disk with clumps of equal sizes and density. Each clump has an optical depth of 50 (Siebenmorgen et al. 2015) and seven to ten clumps are obstructing the line of sight of the observer along equatorial views, ensuring a total optical depth equal to or larger than 100. The non-homogeneously filled counter-part of this disk is model 4, where the dust density varies with the radial distance from the center. Finally, model number 5 is a clumpy disk with clump sizes becoming bigger and bigger as we move away from the center. A clump located at the outer part of the structure is ten times larger than a clump located at the inner edge. In this model the dust density is inversely pro-portional to the clump radius so that each cloud has a constant optical depth of 50 in the V band. The last model is the same as model 5 but the dust optical depth is no longer constant.
The different distributions of dust used in models 2, 4, and 6 are presented in Fig. 2. We consider four dust distributions, defined by their optical depth in the V band plotted as a function of the radial distance from the central black hole. As the size of the disks is the same for all models, the change in optical depths is only due to variations in dust densities. Model (a) corresponds to a linear increase of the optical depth with increasing distances from the central source. Model (b) is for an exponential growth. Model (c) and (d) follow the inverse trend, model (c) is a lin-ear decrease of the dust optical depth with increasing distances from the center, and model (d) is an exponential decrease. We therefore have 15 different test cases: model 1, models 2(a–d), model 3, models 4(a–d), model 5, and models 6(a–d).
We sample 2000 clumps for each clumpy model, equating to a disk filling factor of ∼25%. The impact of the number of clumps has been studied inMarin et al.(2015) and it was found that the lower the filling factor, the lesser the observed polar-ization and the higher the total flux. Using a filling factor of ∼25% allows for a flux decrease between the polar and equatorial inclinations of, at least, one order of magnitude. For all models, we fix the dust composition to the Milky Way mixture (Wolf & Henning 1999). This is the standard dust composition observed in the solar neighborhood, but different mixtures can reside in different systems, such as postulated byGaskell et al.(2004) and Li(2007). In the Milky Way, the dust is essentially composed of
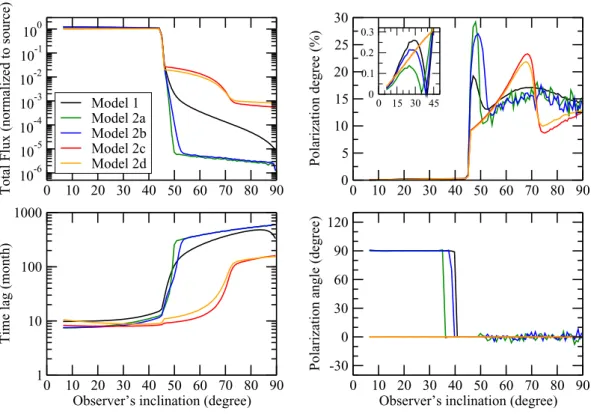
Fig. 3. Near-infrared (10 000 Å) total flux (normal-ized to the source emission), polarization degree, polar-ization angle, and time lag (normalized to the size of the disk) as a function of the inclination of the observer. Five plain flared disk models with various dust distributions are presented (see Sect.2.1for details).
62.5% carbonaceous dust grains and 37.5% astronomical silicate. Both ortho- and para-graphite are considered with twice as much para-graphite as ortho-graphite (Wolf & Henning 1999). The grain size distribution ranges from 0.005 to 0.250 µm in radii; the distribution n(a) ∝ asand s= −3.5. Varying the dust grain
radius distribution or the dust composition results in a different albedo, hence different scattered/absorbed fluxes and polariza-tion. However, in the following, we always compare models with the same dust mixture. The exact dust prescription is then of no importance since we are looking at model differences and not quantitative values. Finally, i is the disk inclination, i.e., the angle between the observer line of sight and the symmetry axis of the disk. Pole-on view corresponds to i= 0◦, edge-on view to i= 90◦.
2.2. Polarized radiative transfer
We used the radiative transfer code STOKES to achieve our simulations. Developed by Goosmann & Gaskell (2007) and upgraded by Marin et al. (2012, 2015), STOKES is a Monte Carlo code that simulates the propagation of radiation in a user-defined three-dimensional environment. The code is extensively detailed in the three papers of the series and we only give here a brief summary of its important features. A list of applications of STOKEScan be found inMarin & Goosmann(2014).
The STOKES code can model a large range of geomet-rical shapes that can be filled with electrons, dust grains, atoms, and molecules. Emitting regions can be parametrized as sources with a given spectral shape. Photons, once emitted, travel along straight lines until a reprocessing event happens, depending on the optical depth of the media; this is calculated as τ =
Z l 0
σn(z) dz, where n(z) is the number density of that material at z, and σ the attenuation cross section. Photons can be scattered, absorbed, and re-emitted in all directions according to the Mie, Rayleigh, Thomson, or Compton laws. Multiple scat-tering can occur and the four components of the Stokes vector
are modified at each scattering event. A spherical web of virtual detectors registers each escaping photon, saving its polar and azimuthal coordinates together with the intensity, polarization (linear and circular), and time lag. The polarization we measured is the scattering-induced, linear, continuum polarization degree ranging from 0% (unpolarized) to 100% (fully polarized). The code can be parallelized and it takes a few days on a basic com-puter for a computation such as presented in this paper to sample 1010photons.
In the following, we ran our models for three different wave-bands: near-infrared (mono-energetic photon emission centered at 10 000 Å), optical (5500 Å), and ultraviolet (2000 Å). Since the scattering phase function of dust is energy dependent, we aim to find which is the best suited waveband for a polarimet-ric detection of the specific features of complex dusty disks. The polarimetric results we present are entirely from scatter-ing. We do not account for external dilution by the host galaxy, stellar starlight, or thermal reprocessing by dust grains. This might have an effect on the polarization signatures, particularly in the infrared domain where dilution by the host galaxy is much more important than in the ultraviolet band (see, e.g.,Bolzonella et al. 2000), and this is discussed in Sect. 4. We registered the flux, polarization, and time lag along 40 polar directions, from the symmetry axis of the model to the equatorial plane, equally spaced in cosine. We azimuthally integrated the sig-nal to get better statistics. It was shown inMarin et al.(2015) that, even for a clumpy distribution, an azimuthally averaged value is representative of the system provided it is not highly non-axisymmetric.
3. Results
3.1. Uniform disks
We present our first results in Figs.3–5 for the near-infrared, optical, and ultraviolet bands, respectively. These results cor-responds to models 1 (plain, uniformly filled dusty flared
Fig. 4.Same as Fig. 3but in the optical band (5500 Å).
Fig. 5.Same as Fig. 3but in the ultraviolet band (2000 Å).
disk) and 2 (plain disks with radial dust stratification). We inves-tigate, in model 2, all four dust prescriptions (a), (b), (c), and (d) according to Fig.2.
3.1.1. Radiation path
Because of the large disk optical depth resulting in multiple scat-tering, the radiation path is not straightforward. Photons may scatter more than twice before reaching the observer, especially if the disk is clumpy. We illustrate in Fig.6the various trajecto-ries the photons can have.
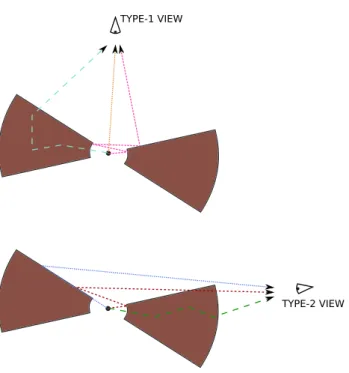
The top panel illustrates the case of an observer situated almost along the symmetry axis of the system, i.e., along the polar direction. In this case, there is a direct view of the central source and photons may travel freely toward the observer (dotted orange line). This is the direct flux, which is unpolarized. If pho-tons are emitted along the equatorial plane, they encounter the disk funnel (dashed pink line). If not absorbed, these photons may scatter backward and be reprocessed onto the opposite fun-nel side until they are absorbed or able to escape. Because of the non-isotropic scattering phase function of Mie scattering, pho-tons can also penetrate further into the disk (long-dashed cyan
Fig. 6.Illustration of different photon paths due to multiple scattering. See text for details. Top: pole-on (type-1) view is shown and bottom: edge-on (type-2) view is shown.
line). Radiation scatters at various positions before escaping at large distances from the central source. Depending on the posi-tion of the last scattering event, its polarizaposi-tion posiposi-tion angle can be either parallel or perpendicular. For the remainder of this paper, we consider that a polarization position angle of 90◦
indi-cates a polarization angle parallel to the projected symmetry axis of the disk. This is the signature of equatorial scattering. A polar-ization angle of 0◦is thus perpendicular to the model axis and traces scattering event happening preferentially close to the pole of the model. We note that when a model is perfectly axisym-metric, the polarization angle can only take two values, 0◦ or
90◦. Otherwise, as in the case of a distribution of clumps, vari-ous polarization angles can be obtained, related to the statistics of the clumps.
The bottom panel of Fig.6illustrates the case of an almost edge-on inclination. The central source is obscured by dust and no longer visible. Photons can escape via multiple scatter-ing along the equatorial plane if the dusty medium is not too optically thick or if there are gaps between the clouds (green long-dashed line). The majority of radiation preferentially scat-ters onto the disk surface opposite to the observer and then reach the detectors. This could happen with only one scatter-ing event, where photon is emitted at an angle coincident to the half-opening angle of the disk (dotted blue line) or due to multiple scattering (dashed red line). When the inclination of the system is close to 90◦, the obscuration is maximal and the amount of photons that have backscattered onto the disk surface opposite to the observer (blue and red lines) is minimal. 3.1.2. Total flux
Focusing first on the normalized photon flux (top left panel of Figs.3–5), we see an almost inclination-independent flux value until the line of sight of the observer becomes obstructed by the dusty disk. Because the central source is unobscured, there is lit-tle contribution from the flared disk that absorbs/scatters a small fraction of radiation. Nonetheless, models 2(c) and 2(d) present a
slightly smaller (by a factor 1.3) flux at those inclinations. As the optical depth is maximum at the inner disk radius (see Fig.2), radiation is more heavily absorbed. Thus, there is less photon scatter toward the polar axis than for the other cases. Once the dusty material intercepts the line of sight of the observer, the flux drops by several orders of magnitude. For a plain disk where density decreases with radial distances from the center (models (c–d)), the minimum flux is about three orders of magnitude lower than at face-on inclinations. Radiation that successfully crossed the first, dense layers of the inner disk region can freely propagate toward the disk outer radius. The number of photons is thus higher than in the case of a disk with a constant-density pro-file (model 1). Here, the flux drops by five orders of magnitude and the attenuation is almost linear with inclination. The atten-uation is even stronger for the last two models (a–b) for which when the dust density increases with radial distances from the source, the flux obscuration is very efficient. Between i= 45◦
and i= 50◦, the flux sharply drops by five orders of magnitude and then stays constant at edge-on inclinations. In this specific case, photons have traveled far inside the dusty material before encountering the densest layers of dust. Radiation then becomes trapped inside the dust disk and naturally suffers from heavy absorption caused by multiple scattering. The emerging flux at edge-on inclinations is thus extremely weak as compared to the source.
As the photon energy increases, models (c–d) with decreas-ing radial optical depth from the center of the disk show a slightly higher edge-on normalized flux, while it is the oppo-site for the other cases. This complex behavior is related to the albedo and the scattering and extinction cross sections of dust. The albedo is flat in the optical band but decreases in the ultravi-olet and infrared regimes. On the other hand, the scattering cross section decreases regularly with wavelength. An illustration is given in Fig. 3 in Goosmann & Gaskell (2007). The combi-nation of the two factors allows ultraviolet radiation to cross a thicker layer of dust close to the inner radius of the disk: more ultraviolet photons can penetrate the disk, but these photons get more scattered or absorbed than optical or infrared photons. However, in the case of a model with increasing dust density with radial distance from the source, the first layers of dust are optically thin, and the same ultraviolet photons travel farther inside the dusty material before they are absorbed or scattered. Scattered photons more easily escape along the polar direction, where the remaining optical depth is smaller, rather than toward the equatorial plane where the optical depth is higher. This results in a decrease of the observed flux even at higher photon energies.
3.1.3. Polarization properties
The polarization properties of the five models (right panels of Figs. 3–5) strongly differ both in terms of polarization degree and polarization position angle. At polar inclinations, the degree of polarization is always small, less than a percent. This is due to the strong dilution effect of the unpolarized primary source that outshines the reprocessed component. The polarization degrees are marginally dependent on the half-opening angle of the disk (Marin et al. 2012) but are very sensitive to its composition. There are however differences between models, even for low inclinations. As it can be seen in the small zoom-box inside the polarization degree panels, a uniformly filled dusty disk produces the highest polarization degrees, while a disk with a linear increase of the dust density with radial distance from the center has the lowest continuum polarization. If the dust
density decreases with radial distances (models (c) and (d)), the degree of polarization linearly increases with inclination until i = 45◦. From 0◦ to 45◦, the other three models show a
nonlinear variation of their polarization properties, which is a behavior that is strongly impacted by the amount of reprocessed flux, hence by the model itself. This can be clearly seen when considering the intrinsic polarization position angle. When the dust density is constant or increases with radial distance from the center, the polarization angle is 90◦ whereas it is 0◦ other-wise. The first three models are dominated by scattering along the equatorial plane, producing a parallel polarization angle, until the line of sight of the observer is obscured by the dusty medium. Scattering then occurs along the polar directions, where photons reprocess on the flared disk surface opposite from the position of the observer; see Fig.6. The polarization angle nat-urally rotates and the transition between the two polarization states causes the polarization degree to decrease around i= 45◦
(the half-opening angle of the flared disk). When the disk opti-cal depth decreases with radial distances from the source, the inner edge of the disk is similar to a thick wall of dust and radiation preferentially scatters along the polar direction if it is to escape from the disk, hence the perpendicular polarization angle.
As soon as the source is no longer directly visible by the observer, the polarization angle is fixed for all models (0◦) and the polarization degree rises due to Thomson laws. In the case of a uniformly filled plain flared disk, the maximum infrared polarization degree is ∼20% at i= 50◦, where polar scattering
dominates. The polarization then decreases with increasing incli-nations because it becomes more and more difficult for radiation to escape the dust funnel; this the case with the exception of mul-tiple scattering, which induces a natural depolarization effect. In the case of models 2(a) and 2(b), the maximum of polarization (27–29%) is reached for inclinations close to 45◦. The polar-ization degree then decreases for the same reasons as before, but the final edge-on value is lower than in the previous case. This is due, as explained above, to the confinement of radiation inside the flared disk and the subsequent heavy absorption. It also explains the lower statistics at edge-on inclinations. Finally, for the last two models in which the dust density decreases with radial distances from the center, the polarization degree peaks at inclinations close to 70◦. The maximum infrared polarization
is as high as 23%, and then decreases at equatorial orientations, and has a polarization level similar to the uniformly filled case. We thus see that the maximum polarization degree from a plain flared disk occurs for various inclinations and strongly depends on the radial distribution of dust. We see similar behaviors in terms of polarization angles and polarization degrees for all three wavebands considered here, and the polarization degrees decreases at bluer wavelengths. We also note that the rotation of the polarization position angle of model 2(a) occurs at slightly different inclinations for different energies. Those two phenom-ena are due to the increase of the dust scattering cross section with decreasing wavelengths.
3.1.4. Time lags
The last panel of Figs.3–5(bottom left) represents the averaged time lag between actual photons reaching the observer and pho-tons emitted by the central source that would not have suffered any scattering. Direct emission has a time lag of zero. This quan-tity, with respect to the previous values, is not directly observable as real cosmic photons are emitted at different times. The true averaged time lags must be reconstructed from observations by
comparing polarized and primary light curves through theoreti-cal transfer functions. The time lags we present therein are to be used as time indicators of the complexity of the radiation paths and the difficulty photons can have to escape from the dusty disk.
We see that the time lag is rather small for pole-on incli-nations. The continuum is directly seen by the observer (zero time lag) and polarized radiation mainly scatters on the inner disk funnel before reaching the observer, lagging the continuum by about ten months. In the infrared band, the uniformly filled model shows the longest times lags but the increase with respect to the other models between 0◦ and 45◦ orientations is merely
detectable. The five models only become truly unique in terms of temporal signatures at inclinations larger than 45◦. When
the dust density increases with radius, the time lag abruptly increases, and at that point the inclination becomes slightly larger than 45◦ and then becomes stable. Since there is a very
small number of photons that can escape from the densest outer layers of the disk (see the flux plot), most of the radiation detected at those angles is due to the backscattering of photons onto the opposite disk edge. Because the photon travel length is almost similar at all edge-on inclinations, the time lag stabi-lizes at 400–600 months. A model with a constant-density dust prescription has a similar behavior but the time lags are less important since radiation faces a constant, high optical depth and thus scatters many times before escaping but is not trapped in the outer regions, in contrast with the previous cases. The time lag slightly drops at perfect equatorial inclinations since photons that have backscattered on the opposite disk funnel are not longer able to reach the observer and thus do not delay the averaged time response. Finally, for models with decreasing radial dust densi-ties, time lags remain very constant before and after the transition angle, solely showing a small increase a inclinations larger than 70◦. This is also due to the amount of backscattered photons that outnumbers those that have traveled through the equatorial plane (i.e., with a smaller time lag).
We finally note that the time lags differ in the near-infrared and the optical/ultraviolet bands, when energetic radiation can penetrate further in the dust material. For models with denser dust layers close to the source, IR photons mainly scatter onto the dust funnel while UV photons penetrate more easily in the mate-rial, increasing their time lag. The change in waveband affects the three other models in the opposite way: their time lag at polar views is lower. This is due to the combination of albedo and scattering/absorbing cross-section variations, as explained above.
Summarizing what we have found for the plain flared disks, we have shown that different dust prescriptions result in specific inclination-dependent attenuations of the flux. If the dust lay-ers become thicker with increasing distances from the central source, fewer photons are detected toward the equatorial regions. It is not the case for the other configurations that allow more radiation to be detected at high inclinations. The variations of the polarization degrees and angles are also very characteristic; the polarization is maximum for models with radially increas-ing dust densities. Those same models also provide the highest time lags at equatorial views at all three wavebands. We note that the differences are less pronounced for type-1 (pole-on) inclina-tions, where the structure of the equatorial distribution of dust has a lesser impact on the averaged time lags. This prevents a very clear determination of the morphology of the disk from time reverberation studies that can be achieved only for low incli-nation objects, showing the importance of coupling timing and polarimetric studies to break degeneracies.
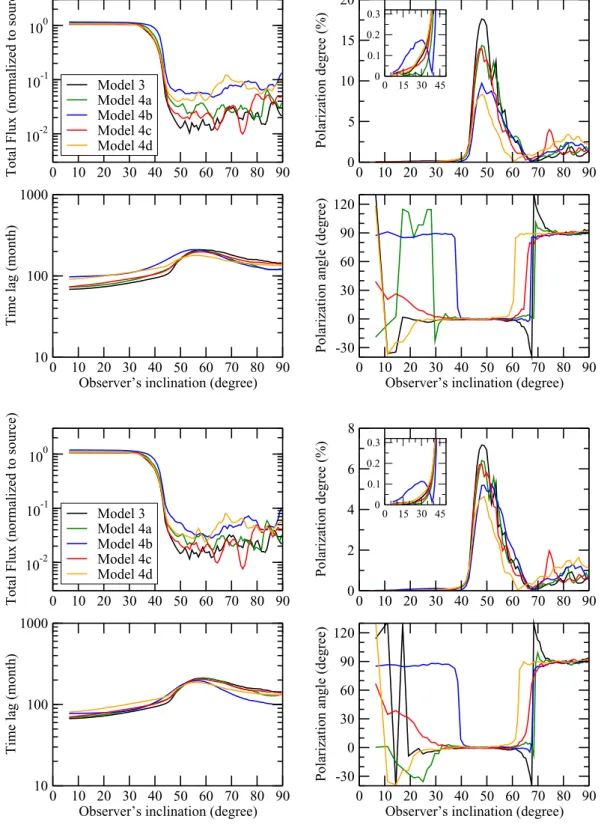
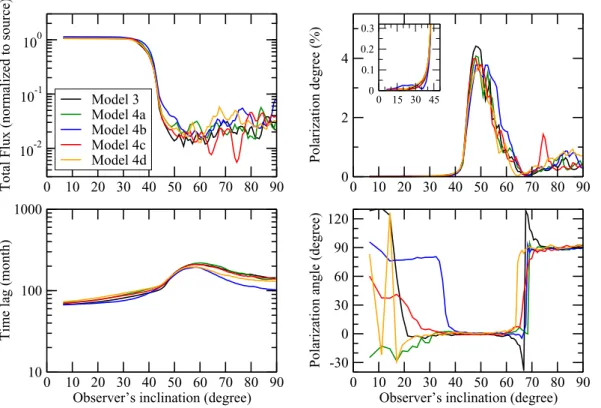
Fig. 7. Near-infrared (10 000 Å) total flux (normal-ized to the source emission), polarization degree, polar-ization angle, and time lag (normalized to the size of the disk) as a function of the incli-nation of the observer. Five clumpy flared disk models with clumps of constant radius but different dust distributions are presented (see Sect.2.1for details).
Fig. 8.Same as Fig. 7but in the optical band (5500 Å).
3.2. Fragmented disks with constant-radius clouds
Our second series of models focuses on fragmented disks with clumps of equal sizes. We examine in Figs.7–9a model in which the optical depth is the same for all clumps (fixed to 50 in the V band, model 3) and a model in which the dust opacity varies with radial distance from the central source (model 4). In the later case, we consider the same four dust prescriptions (a), (b), (c), and (d) as previously (see Fig.2).
The normalized photon fluxes are maximum at polar incli-nations as discussed in the previous section. However the flux
attenuation due to obscuration is much less important at edge-on orientations. The clumpy structure of the disk is responsible for gaps between the cloudlets, allowing radiation to escape more easily thanks to multiple scattering. The interclump medium is pure vacuum here, but similar results are found for a clumpy two-phased medium with high density clumps embedded in a low density interclump dust (Stalevski et al. 2012). The flux attenua-tion is model-dependent. In the infrared, fluxes along the equator are smaller by about one order of magnitude than the polar value for models with exponential opacity distributions, and by almost two orders of magnitude in the linear case. The constant-density
Fig. 9.Same as Fig. 7but in the ultraviolet band (2000 Å).
model (model 3) presents the lowest equatorial flux. We there-fore see that the dust distribution has a profound impact on the quantity of transmitted flux at edge-on views. The photon fluxes are almost inclination-independent once the line of sight of the observer has crossed the disk horizon with a smooth transition between i= 35◦and i= 50◦. The geometry of the system drives the shape of the curves and all five models appear similar (albeit their flux levels). Moving toward shorter wavelengths has no impact on the shape of the curve but the derived photon flux at edge-on inclinations is slightly different owing to the com-bined effect of albedo and cross section. All models appear to give equivalent fluxes along the equatorial plane, between one and two orders of magnitude less than along the pole.
The polarimetric results (right panels of Figs.7–9) are very different from the plain flared disk models and are also char-acteristic of the model used. Whereas the infrared polarization degree along polar directions for the plain disk cases can reach ∼0.25%, here it is at best 0.17% for the model with an expo-nentially increasing dust opacity with radial distances from the source (model 4(b)). For this model, radiation mainly scatters in the equatorial plane until this radiation reaches the outer part of the disk. At this location, the dust density is maximum and the resulting polarization position angle is equal to 90◦.
A clumpy disk with a linear increase of dust opacity with dis-tance (model 4(a)) also presents a 90◦ polarization angle when
observed edge-on, but its polarization degree is smaller. The seemingly chaotic variations of the polarization angle are due to the clumpiness of the medium and not to insufficient statis-tics. For the other models (model 3 and models 4(c–d)), the level of linear polarization at polar inclinations is very low because of the inefficiency of the clumpy disk to scatter photons toward the observer. The resulting polarization angle is 0◦. This efficiency
increases with inclination as the line of sight of the observer becomes obstructed by clumps. The infrared polarization degree sharply rises up to 18% in the case of constant-density clumps (model 3). For dust densities that decrease linearly (model 4(c)), the maximum polarization degree is 15% and for the last two
models that are much less capable of absorbing/scattering radia-tion, the maximum polarization is about 10%. For all models, the polarization position angle is equal to 0◦between 40◦–60◦ incli-nations since polar scattering dominates. At larger incliincli-nations, there is a rotation of the polarization angle for all models: the polarization angle becomes parallel while the polarization degree decreases. Scattering along the equatorial plane is now the easiest path to escape the clumpy dusty disk. This results in low infrared polarization degrees with 90◦polarization position
angles. This behavior was already revealed inMarin et al.(2015) and Marin & Schartmann (2017) for constant-density clumpy models, but we now show that their results also apply to more complex dust distributions. As for the plain disk discussed in Sect. 3.1, we find a wavelength-dependent polarization varia-tion, the maximum polarization degree of the models decreasing for shorter wavelength. This is due to a smaller scattering cross section when the photon energy increases, which allows radi-ation to travel more easily through the dusty structure without interacting.
The time lag results (bottom left panel of Figs.7–9) are also very different from their plain disk counterparts. Even at polar inclinations the time needed to escape from the dusty struc-ture is large for photons that have scattered only once or twice. Since the medium is clumpy, radiation has traveled far inside the disk before being scattered toward the observer. The time lag is thus about ten times larger than for a plain disk, where radiation mainly scatters inside the dust funnel. We note that this is not due to a higher albedo, but rather to the existence of vacuum between the cloudlets that allows radiation to travel without being absorbed. Model 4(b) presents the highest time lags due to the exponential increase of optical depth with distance to the source. Only the outer parts of the disk are filled with high density, high opacity clumps. Photons thus travel a large distance before these photons are scattered toward the observer. All other mod-els show approximatively equal time lags, and the lowest values are obtained for the constant-density sphere model (model 3). When obscuration becomes efficient (at inclination larger than
Fig. 10. Near-infrared (10 000 Å) total flux (normal-ized to the source emission), polarization degree, polar-ization angle, and time lag (normalized to the size of the disk) as a function of the inclination of the observer. Five clumpy flared disk mod-els with clumps of increasing radius and different dust distributions are presented (see Sect.2.1for details).
45◦), the time-lag values increase by a factor ∼2 depending on the model. This increase correlates with the flux attenuation and the rise of polarization degree observed in other panels. This is a clear indication for a maximum efficiency of obscuration and a large number of scattering events. Finally, when equatorial scat-tering dominates at edge-on inclinations, the time lags decrease but stay larger than at polar angles. The dependence of time lags with inclination is very similar at shorter wavelengths, and there is only a marginal quantitative decrease.
We conclude that, for clumpy disks with constant radius spheres, the attenuation between a polar and an equatorial incli-nation is not very effective. The transition between the two extreme inclinations is smooth and operates around the half-opening angle of the dusty structure. If the half-half-opening angle is not the same for all observable sources, then it becomes impossi-ble to distinguish between various dust stratifications. However polarimetry can reveal the distribution of dust with respect to the central source as the polarization degree reaches different maxima for different cases. The best waveband for observing the polarimetric signatures of clumpy tori is in the near-infrared, where polarization levels larger than 10% are expected for a nar-row range of inclinations. Different dust structuring also imprints the polarization position angle with specific values at polar orientations. Finally, reverberation measurements hardly differ-entiate between the different models since they all give the same inclination-dependent curves. The time lags they produce are too similar to be clearly distinguished.
3.3. Fragmented disks with variable clump sizes
Our last set of models is presented in Figs.10–12. In this case, the dusty disk is clumpy and the clump radii increase with distances from the central source. We arbitrarily set the radius of clumps situated at the outer part of the structure to be ten times larger than clumps located at the inner edge. Similarly to Sects.3.1and 3.2, we examine a model in which the dust opacity is constant for each clump (model 5) and four models (6(a)–(d)) in which
the dust opacity varies with radial distance from the source (see Fig.2).
The normalized total flux appears to be constant at polar viewing angles since, as previously, it is dominated by direct flux from the central source. At low angles, the fluxes are inclination-and model-independent. Differences only appear when the line of sight of the observer crosses the dusty disk. In the case in which the opacity exponentially decreases with distance, the disk does not efficiently block radiation at equatorial viewing angles. The flux has decreased by only one order of magnitude. The gaps between the clouds and the presence of low opacity, large dust cloudlets at the outer disk radius do not allow for a large obscuration. If the dust opacity decreases linearly, obscu-ration is slightly more efficient since the cloud opacity is still higher than 10 (V band) at 8 pc from the source (while it is about 2–3 in model 6(d)). If the disk is composed of low opac-ity inner (small) clouds and high opacopac-ity outer (large) clouds, radiation is more heavily absorbed. Fluxes are about four orders of magnitude lower at extreme equatorial inclinations for the three remaining models (models 5, 6(a), and 6(b)). The flux decrease with inclination is exponential for these three cases and the transition between unobscured and obscured sources is sharp at around the disk half-opening angle. The fluctuations we see in the flux curves are due to the distribution of clouds inside the model. Some features might appear for different realizations of clumpy disk models if a given equatorial line of sight is not obscured by several optically thick clouds. This occurs, for exam-ple, in Fig.10, models 5 and 6(c), at inclinations larger than 70◦.
The appearance of peaks and dips in the photometric curves are wavelength-dependent. As the photon energy decreases, radia-tion is less absorbed by dust grains and, if there is not enough dusty material to block radiation along a given direction, pho-tons escape more easily. This causes the low amplitude peaks of flux in the photometric curves observed in, for example, 6(d), which are visible in the ultraviolet but not in the infrared.
The polarimetric plots (right panels of Figs.10–12), show a sharp rise of polarization with increasing inclinations. At polar
Fig. 11.Same as Fig.10but in the optical band (5500 Å).
Fig. 12.Same as Fig.10but in the ultraviolet band (2000 Å).
angles, the polarization degree exponentially rises up to 0.3%. The associated polarization position angle is 0◦ for all models in the near-infrared. This means that photons have not scattered much along the equatorial plane before escaping the system, but have instead mainly scattered on the large dust clumps located high above the equatorial plane, resulting in the characteris-tic perpendicular polarization angle. When the line of sight of the observer becomes obstructed by dust, the polarization degree sharply rises since polar scattering clearly dominates over
unpolarized emission from the (now) obscured source. Mod-els with decreasing optical depth with radial distances from the center (6(c) and 6(d)) have the lowest polarization degrees, since photons easily escape from the system, and therefore do not carry large scattering-induced polarization. This effect is even more pronounced at equatorial inclinations when scatter-ing along the equatorial plane dominates over polar scatterscatter-ing, resulting in a rotation of the polarization position angle for the two aforementioned models. The polarization degree thus
shows dips that have minima associated with the rotation of the polarization angle. The case is slightly different for the other three models (5, 6(a), and 6(b)). Their polarization degree is as high as 25% and it is always associated with a perpendicular polarization position angle. For increasing inclinations the polar-ization degree regularly decreases for the same reason as above but since obscuration by large, optically thick, outer clumps is more efficient, equatorial scattering does not dominate and the polarization position angle remains equal to 0◦. At shorter wave-lengths, the results are similar but the polarization degrees are lower (down to 7% for the most polarized models in the ultra-violet band) as obscuration and depolarization through multiple scattering dominate over transmission.
The time lags (bottom left panel of Figs.10–12) are also very different for different dust opacity prescriptions. The time lags are similar for all models at polar inclinations, since they mainly result from scattering onto the large dust clouds at the outer radii of the fragmented disk. However, once the inclination is larger than 45◦, the five models show different behaviors. Model 6(d)
(density decreasing exponentially with distance) shows the low-est time lags that have an infrared maximum around i = 50◦.
The time lag decreases at equatorial inclinations as photons preferentially escape by scattering close to the equatorial plane, carrying a smaller time delay than photons that have backscat-tered onto the disk funnel and then inside the cloud distribution. The same conclusions apply to a model with a linear decrease of density. It follows that a clumpy disk with increasing cloud radii and decreasing optical depths would be, contrary to naive expectations, a poor target for reverberation measurements. Bet-ter targets are models 5, 6(a) and 6(b). The time lags increase with inclination, by factors up to up to 5. The presence of optically thick, large dust clouds in the outer borders of the sys-tem greatly facilitate time-lag observations since photons have to travel through the whole disk before these photons are effi-ciently blocked and/or scattered by dust. This statement is even strengthened at shorter wavelengths at which the time lags are larger because of the ability of optical and ultraviolet photons to penetrate deeper in the dusty medium.
In summary, our last set of models has shown that clumpy disks with clumps of variable sizes and optical thickness have very distinctive features that are very different for a variety of dust prescriptions. The importance of large and dense clumps at the outer edges of the disk is crucial for obtaining an effi-cient obscuration. They also enable large polarization degrees and time lags. If the disk becomes more transparent with radial distances from the source, obscuration is less efficient and we observe a rotation of the polarization angle with increasing inclinations.
4. Discussion and observational prospects
We have shown that varying the morphology and/or the distribu-tion of dust density in equatorial dusty structures has a profound impact on the observational properties (total flux, polarization degree and angles, and time lags) we have considered. The flux detected at equatorial inclinations is very sensitive to the structure of the disk: uniform or fragmented media result in flux levels that can be orders of magnitude different from those observed at polar viewing angles. Clumpy structures (either with constant or variable cloudlet radii) tend to be less efficient in blocking radiation along the equatorial plane unless the outer clouds are substantially bigger than the inner clouds. The result-ing polarization is also distinctively different between the three
morphologies and we found it to be much more sensitive to the radial distribution of dust than the photometric marker. The polarization degree is inclination-dependent and varies together with rotations of the polarization position angle that can trace the dust stratification. Finally, the averaged time lags resulting from multiple scattering in different models is also a very distinc-tive signature that can probe the morphology of the scattering medium. Those two observational properties, polarization and time lags, are the bases of the polarized reverberation mapping technique introduced byGaskell et al.(2012).
4.1. Polarized reverberation mapping
By comparing the amplitude of variability of the polarized flux to the amplitude of variability of the total flux in a blue pass-band with effective wavelength of 3600 Å,Gaskell et al.(2012) found that the polarized flux of the Seyfert-1 NGC 4151 fol-lows the total flux with a lag of 8 ± 3 days. This, together with the orientation of the position angle of the polarized flux, enabled us to constrain the effective size of the unresolved equa-torial scattering region of the AGN, most probably composed of electrons. This is the first and unique example so far illustrating the importance of polarized reverberation mapping in resolving the innermost structure of AGN. Achieving those observations is time consuming and required about 7 yr of monitoring the total and polarized fluxes of NGC 4151. In contrast with the work of Gaskell et al.(2012), who probed the inner broad line region, we showed here that dust scattering results in longer timescales on the order of several months for type-1 (polar) inclinations. It is therefore very important to select the optimal wavebands before starting such long observational campaigns.
Our results indicate that the near-infrared band seems to be the best to search for high degrees of polarization, since photons are not energetic enough to travel far into the dusty medium; instead, they are reflected (the albedo is large) and do not penetrate the disk much, leading to high polarization degrees. This applies to either polar, intermediate, or equatorial incli-nations. However, thermal re-emission from dust and starlight dilution (from the host galaxy in the case of AGN) may also be strong enough to wipe out the polarization signature (Miller & Antonucci 1983). Hence, a more secure waveband to search for the polarization signal from dusty equatorial structures is ultra-violet, where starlight emission decreases in spiral and elliptical galaxies (Bolzonella et al. 2000).
The reverberation mapping technique requires us to observe both the continuum and reprocessed spectra; the central source must be directly visible and the line of sight must not cross the obscuring dusty torus. This limits us to polar viewing angles, for which the time lags are the shortest. In the AGN context, this is beneficial since the averaged time delays between vari-ations of the polarized flux and total flux can be on the order of months (see Fig.3 for example). We compared our results to those obtained by Almeyda et al. (2017), who have inves-tigated the mid-infrared reverberation responses of a clumpy torus and found these responses to be in agreement with ours, even if the authors considered lower energies. Depending on the isotropic or anisotropic distribution of clumps in their torus models,Almeyda et al.(2017) have found an averaged optical-to-infrared time-lag of 80–150 days (i.e., 2.6–4.9 months) at 3.6 µm. In comparison, our clumpy model with constant cloudlet radius and optical depth gives a time lag of 3.9 months (cross-correlated between the total and polarized fluxes at 1 µm). Shorter delays can be obtained in the ultraviolet band, which is a conclusion that is also shared byAlmeyda et al.(2017).
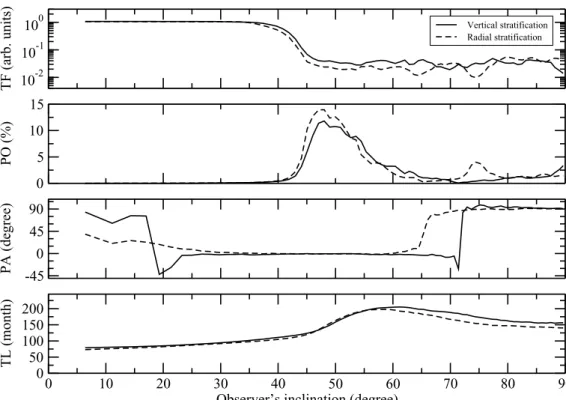
Fig. 13. Comparison between a radial (solid dashed line) and ver-tical (solid plain line) dust strat-ification in a clumpy equatorial flared disk with spheres of constant radius. The variation of the dust density is linear and decreases from the center of the model (first case) and from the equatorial plane (sec-ond case). The top panel shows the normalized photon flux at 1 µm, the second panel is the polarization degree, the third panel is the polar-ization position angle, and the last panel is the time lag as a function of the system inclination.
We therefore conclude that polarized reverberation mapping is very possibly better suited for ultraviolet/blue observations. The time lags between the unpolarized continuum and polar-ized reprocessed spectrum is shortened, while the observed polarization degree is less diluted by starlight contribution. The combination of the two techniques, leading to polarized time reverberation studies, strongly helps to break degeneracies. Our simulations suggest that much more sophisticated models are less easy to distinguish/constraint, but the combination of observables can still serve to rule out certain scenarios. The main difficulty here is that for low inclinations, the polarized fraction is small whereas for large inclinations, the unabsorbed, direct flux is severely reduced.Gaskell et al.(2012) nevertheless clearly established the feasibility of such an observational study for the case of NGC 4151, but one has to remember that it took them about 7 yr to complete the observations. Multiwavelength analysis such as radio observations to probe the kinematics and composition of the circumstellar/circumnuclear region or hard X-rays, which are much less absorbed/scattered than the optical, might be useful to narrow down the uncertainties. A detailed treatment of the problem is deferred to a forthcoming paper in which we intend to construct artificial light curves in both total and polarized light to measure realistic time lags, including both dilution by the host, interstellar polarization, and sophisticated transfer functions.
4.2. Toward more sophisticated models
We have shown that two dusty structures with the same geometry but different dust grain distributions (e.g., a linear increase and an exponential increase of opacity with radial distance from the central source) are distinctively different in terms of polarization and timing properties; see Fig.12for example. However, those differences are less likely to be detectable in terms of photome-try, since almost all models give the same inclination-dependent trend in flux attenuation. To detect a radial stratification of dust, time-resolved polarimetry appears to be the solution but it is unclear whether this conclusion would also apply for
vertical stratifications and chemical variations of the dust grains with distance from the source. It has been known for long that the dust composition and temperature of stellar nebulae varies with distance from its young star (Bally & Reipurth 2006); the same applies to galaxies, since the galactocentric dust mineral-ogy varies with distance and metallicity (Giannetti et al. 2017). We thus naturally expect circumstellar and circumnuclear dusty disks to be more complex than considered here.
It is beyond the scope of this paper to consider all possible dust distributions with distance, altitude, temperature, or metal-licity. We have already proven that uniformly filled equatorial dusty structures give different polarimetric and timing outputs than structures with radial dust opacity gradients. However, in order to illustrate the complexity of the parameter space for fill-ing the disk with dust, we show in Fig.13one realization of our numerical code for a clumpy disk with constant cloud radii in the case of a linear decrease of dust density with vertical dis-tance from the equatorial plane. The simulation was achieved at 1 µm and results are shown in Fig. 13 using a plain solid black line. For comparison, we also show a model with the same parameters except that the gradient is now radial instead of vertical; the dust opacity linearly decreases with radial dis-tance from the central source (black dashed line). As can be seen, the two configurations (vertical and radial variations of opacity) are almost indistinguishable in terms of photometry. The signal is the same at polar viewing angles and the obscured flux at equatorial orientations is equivalent. Differences can only be attributed to the random positions of the clouds. The unique true difference between the two models is the inclination angle at which the transition between the unobscured and obscured state occurs. The vertical opacity stratification configuration is similar to a configuration in which an optically thin atmosphere lays on top of denser equatorial layers. Photons grazing the disk surface are less likely to be absorbed. It is only at a larger incli-nation, where the medium finally becomes optically thick, that the disk can efficiently block radiation. In terms of polarization we see that the inclination-dependent degree of polarization fol-lows the same trend, but the maximum amount of polarization is
only 11% instead of 14% at intermediate inclinations. The small bump of polarization observed at an inclination of ∼75◦is due to the random distribution of the clumps position in the disk. The polarization position angle is the only marker showing a distinctive difference between the two configurations. The polar-ization angle is 90◦ for i= 0◦, indicating that scattering mainly
happens along the equatorial plane. In comparison, for a radial opacity stratification, the polarization angle is close to 45◦since
both equatorial and polar scattering are contributing. Here, the vertical stratification of dust density favors scattering along the equatorial plane where the disk is denser. For larger inclinations, the polarization angle rotates to 0◦, as in the radial case, since
backscattering on the disk funnel becomes important at those intermediate inclinations. It is only at large inclinations, when the continuum is obscured and when backscattering is no longer dominant with respect to equatorial scattering, that the polariza-tion angle switches to 90◦. Similarly to the photometric results,
the angle at which this transition happens is different from the radial stratification scenario. Finally, the inclination-dependent averaged time lag is almost indistinguishable between the two cases since the geometry of the medium plays a more important role than its composition in time domain studies.
5. Conclusions
In this paper, we have shown that the morphology or the dis-tribution of dust density of an equatorial dusty structure has a profound impact on the polarized signal and on the expected (averaged) time lags. A plain uniform structure may have a sim-ilar behavior to that of a complex clumpy structure in terms of flux attenuation but the polarization degree and angle would be significantly different. If the polarization signal from the equa-torial dusty disk can be isolated from the central source or from additional components (which is more problematic in the case of AGN), it is possible, in principle, to distinguish between dif-ferent models. In particular, the dust distribution inside a disk has a very clear inclination-dependent polarization signature. Since the inclination is not easy to determine from observations, coupling timing and polarimetric information are crucial for determining the physical size of the unresolved region together with its composition.
We also found that the ultraviolet/blue band is very probably better suited for polarized time-reverberation studies. The polar-ization level due to dust scattering is not expected to be as high as in the near-infrared, but the ultraviolet waveband should be less contaminated by external starlight and thermal re-emission. In addition, the time delays are expected to be slightly shorter in this waveband, allowing for less time-consuming observa-tional campaigns. We intend to continue this study by applying cross-correlation methods to light curves obtained by our Monte Carlo method. We aim to reproduce the observed time delays of NGC 4151 first, estimate the inclination of the AGN by testing all the possible orientations thanks to our numerical code, and then try to evaluate the existence of additional structures in the AGN by checking their influence on the resulting polarization signal and time delays.
Acknowledgements.The authors would like to thank the anonymous referee for useful suggestions that helped to improve this paper. This research has been sup-ported by the French Programme National des Hautes Energies (PNHE). F.M. is grateful for CNES funding under the post-doctoral grant “Probing the geometry and physics of active galactic nuclei with ultraviolet and X-ray polarized radia-tive transfer”. A.P.R.L. acknowledge support from the CONICYT BECAS Chile grant no. 72150573.
References
Almeyda, T., Robinson, A., Richmond, M., Vazquez, B., & Nikutta, R. 2017, ApJ, 843, 3
Andrews, S. M., Wilner, D. J., Zhu, Z., et al. 2016,ApJ, 820, L40 Antonucci, R. 1993,ARA&A, 31, 473
Antonucci, R. R. J., & Miller, J. S. 1985,ApJ, 297, 621 Apai, D., Pascucci, I., Brandner, W., et al. 2004,A&A, 415, 671
Bally, J., & Reipurth, B. 2006,The Birth of Stars and Planets(Cambridge: Cambridge University Press)
Beckert, T., Driebe, T., Hönig, S. F., & Weigelt, G. 2008,A&A, 486, L17 Beckwith, S. V. W., & Sargent, A. I. 1996,Nature, 383, 139
Beckwith, S. V. W., Sargent, A. I., Chini, R. S., & Guesten, R. 1990,AJ, 99, 924
Bilíková, J., Chu, Y.-H., Gruendl, R. A., Su, K. Y. L., & De Marco O. 2012, ApJS, 200, 3
Bolzonella, M., Miralles, J.-M., & Pelló, R. 2000,A&A, 363, 476 Burtscher, L., & Tristram, K. R. W. 2013,The Messenger, 154, 62 Chu, Y.-H., Su, K. Y. L., Bilikova, J., et al. 2011,AJ, 142, 75 Clayton, G. C., De Marco, O., Nordhaus, J., et al. 2014,AJ, 147, 142 Czerny, B., & Hryniewicz, K. 2012,J. Phys. Conf. Ser., 372, 012013 D’Alessio, P., Cantö, J., Calvet, N., & Lizano, S. 1998,ApJ, 500, 411
D’Alessio, P., Calvet, N., Hartmann, L., Lizano, S., & Cantó, J. 1999,ApJ, 527, 893
Dubrulle, B., Morfill, G., & Sterzik, M. 1995,Icarus, 114, 237 Dullemond, C. P., Henning, T., Visser, R., et al. 2007,A&A, 473, 457 Eisner, J. A., Hillenbrand, L. A., White, R. J., et al. 2007,ApJ, 669, 1072 Farihi, J., Jura, M., & Zuckerman, B. 2009,ApJ, 694, 805
Gaskell, C. M., Goosmann, R., Antonucci, R., & Whysong, D. 2004, in AGN Physics with the Sloan Digital Sky Survey, eds. G. T. Richards, & P. B. Hall, ASP Conf. Ser., 311, 61
Gaskell, C. M., Goosmann, R. W., Merkulova, N. I., Shakhovskoy, N. M., & Shoji, M. 2012,ApJ, 749, 148
Giannetti, A., Leurini, S., König, C., et al. 2017,A&A, 606, L12
Gledhill, T. M., Scarrott, S. M., & Wolstencroft, R. D. 1991,MNRAS, 252, 50P Gnedin, Y. N., Piotrovich, M. Y., Silant’ev, N. A., Natsvlishvili, T. M., & Buliga,
S. D. 2015,Astrophysics, 58, 443
Goosmann, R. W., & Gaskell, C. M. 2007,A&A, 465, 129 Hillenbrand, L. A., Strom, S. E., Calvet, N., et al. 1998,AJ, 116, 1816 Holwerda, B. W., Bianchi, S., Böker, T., et al. 2012,A&A, 541, L5 Horne, K. 1985,MNRAS, 213, 129
Jaffe, W., Meisenheimer, K., Röttgering, H. J. A., et al. 2004,Nature, 429, 47 Jones, A. P. 2016,Roy. Soc. Open Sci., 3, 160224
Kishimoto, M., Hönig, S. F., Beckert, T., & Weigelt, G. 2007,A&A, 476, 713 Krolik, J. H., & Begelman, M. C. 1988,ApJ, 329, 702
Li, A. 2007, in The Central Engine of Active Galactic Nuclei, eds. L. C. Ho, & J.-W. Wang,ASP Conf. Ser., 373, 561
Liu, J., Liu, Y., Li, X., et al. 2016,MNRAS, 459, L100 López-Gonzaga, N., & Jaffe, W. 2016,A&A, 591, A128 Marin, F. 2014,MNRAS, 441, 551
Marin, F. 2016,MNRAS, 460, 3679
Marin, F., & Goosmann, R. W. 2014, inSF2A-2014: Proceedings of the Annual Meeting of the French Society of Astronomy and Astrophysics, eds. J. Ballet, F. Martins, F. Bournaud, R. Monier, & C. Reylé, 103
Marin, F., & Schartmann, M. 2017,A&A, 607, A37
Marin, F., Goosmann, R. W., Gaskell, C. M., Porquet, D., & Dovˇciak M. 2012, A&A, 548, A121
Marin, F., Goosmann, R. W., & Gaskell, C. M. 2015,A&A, 577, A66 Marinucci, A., Bianchi, S., Matt, G., et al. 2016,MNRAS, 456, L94 Marsh, T. R., & Horne, K. 1988,MNRAS, 235, 269
Meisenheimer, K., Raban, D., Tristram, K., et al. 2008,The Messenger, 133, 36 Miller, J. S., & Antonucci, R. R. J. 1983,ApJ, 271, L7
Mundy, L. G., McMullin, J. P., Grossman, A. W., & Sandell, G. 1993,Icarus, 106, 11
Nenkova, M., Ivezi´c, Ž., & Elitzur, M. 2002,ApJ, 570, L9 Netzer, H. 2015,ARA&A, 53, 365
Pinte, C., Harries, T. J., Min, M., et al. 2009,A&A, 498, 967 Pollack, J. B., Hollenbach, D., Beckwith, S., et al. 1994,ApJ, 421, 615 Sazonov, S., Churazov, E., & Krivonos, R. 2015,MNRAS, 454, 1202 Scholz, A., Xu, X., Jayawardhana, R., et al. 2009,MNRAS, 398, 873 Schräpler, R., & Henning, T. 2004,ApJ, 614, 960
Siebenmorgen, R., Heymann, F., & Efstathiou, A. 2015,A&A, 583, A120 Stalevski, M., Fritz, J., Baes, M., Nakos, T., & Popovi´c, L. ˇC. 2012,MNRAS,
420, 2756
Su, K. Y. L., Chu, Y.-H., Rieke, G. H., et al. 2007,ApJ, 657, L41 Vicente, S. M., & Alves, J. 2005,A&A, 441, 195
Walker, C., Wood, K., Lada, C. J., et al. 2004,MNRAS, 351, 607 Wolf, S., & Henning, T. 1999,A&A, 341, 675