Certification Challenges for Emerging
Technologies in Aviation
by
Atinuke Adebisi Oyeniya
Bachelor of Science Civil Engineering, University of Connecticut, 2010 Master of Business Administration, University of Connecticut, 2013
Submitted to the System Design and Management Program in Partial Fulfillment of the Requirements for the Degree
of
Master of Science in Engineering and Management
at theMassachusetts Institute of Technology
June 2018 co C/
2018 Atinuke Oyeniya. All rights reserved. g =
The author hereby grants to MIT permission to reproduce and to distribute (n
publicly paper and electronic copies of this thesis document in whole or in part in any medium now known or hereafter created.
ARCHIVES
Si gnature redacted
CVE
Signature of Author ...
...
Atinuke Oyeniya MIT Graduate School of Engineering & Sloan School of Management
Systems Design and Management Program May 8, 2018
Signature redacted
C e rtified by ...
Olivier L. deWeck Professor of Aeronautics and Astronautics and Engineering Systems Thesis Supervisor
Certification Challenges for Emerging Technologies in
Aviation
by
Atinuke Adebisi Oyeniya
Submitted to the System Design and Management Program on May 11, 2018 in Partial Fulfillment of the Requirements for the Degree of
Master of Science in Engineering and Management
Abstract
Over the last decade the aerospace industry has seen a shift in traditional architectures of an aircraft. The desire for aircraft to be lighter, more efficient, quieter, faster, and cheaper has driven trends across the industry. These trends look for ways to accomplish what many other industries such as automotive have done which is a complete transformation of the "normal." The shift has created an advanced architecture for aircraft and therefore requires a new view on certification. The traditional approach for certification is pretty straightforward since majority of aircraft have been the same over several years with minor changes in sub level aircraft systems. Aircraft manufacturers in combination with suppliers develop concepts for new or improved aircraft, requirements are outlined and implemented based on aviation authority regulations, and eventually the aircraft receives a certificate declaring the safety of the aircraft design and production.
In fairness, the traditional standard approach to aircraft certification has worked. Aircraft are safer than ever and data shows a sharp decline in aviation accidents over the years. However, with changes in technology what use to be the "normal" architecture is changing significantly
and the desire for the industry to be more agile both play a role in the need to view certification slightly different. The main objective of certification has been, is, and will always be safety. This thesis proposes a framework on how to approach certification of new technologies.
Perhaps the two most important elements in the framework are the proposal of a threshold utilizing the technology infusion effort equation to gage the significance of a change in
architecture and the proactive safety analysis utilizing a new kind of technique called STPA. The framework is developed based on an in-depth outline of the traditional certification process and a review of the historical development of safety regulations. Two parts of the proposed framework are then applied and analyzed based on the more electric aircraft concept. Thesis Supervisor: Olivier L. deWeck
For my sweet mother, who sacrificed so much to make me who I am today. I love you unconditionally forever and a day.
Rest peacefully mother dearest!
Acknowledgments
These last two years have been a true test of my dedication to my studies and my strength to overcome obstacles.
I start with a thanks to Dr. Olivier L. deWeck for pushing me to deepen my thoughts throughout this process. From the very first day that I proposed this thesis he has helped me take my initial thoughts a step further.
I would like to again acknowledge my mother. Her memory continued to keep me going
throughout this program even when I wanted to give up and take a break. She not only was my biggest supporter but she always encouraged me to push the envelope and reach for the stars. I love her and I miss her dearly.
Lastly, there are no words that can express my sincere gratitude to my family and friends for their support and for taking the time to talk to me at all hours on my commute from Cambridge to Connecticut three days a week. From the bottom of my heart, I say thank you. And especially to my dad, my sister, my brother, and my significant other thank you for always believing in me
Table of Contents
C h ap ter 1 ... 13
1 In tro d u ctio n ... 13
1 .1 M o tiv a tio n ... 1 3 1.2 Objective and Analysis Approach...15
1.3 Methods and Literature Reviews ... 16
1.3 .1 S yste m A rchitecture M ethods...16
1.3.2 Technology Insertion Frameworks...17
1.3.2.1 Insertion Framework by Rudy Smaling and Olivier de Weck [3] [4]... 18
1.3.2.2 Technology Infusion Analysis Framework [5]... 21
1.3.2.3 Technology Infusion Assessments and Aircraft Certification ... 22
1.3.3 Architectural Performance Index described by Carlos Gorbea [6]... 24
1.3.4 Systems Safety Methods, Nancy Leveson and John P. Thomas [7]... 25
2 Current Aerospace Certification Process ... 29
2 .1 C e rtific a tio n A uth o rity ... 2 9 2 .2 C e rtifica tio n O ve rv ie w ... 2 9 2 .3 T y p e C e rtific a tio n ... 3 0 2.4 Certification Process- System Architecture... 34
3 Emerging Aerospace Technologies... 36
3 .1 M o re E le ctric A irc ra ft... 3 6 3.1.1 History of the Aircraft Electrical Architecture ... 36
3 .1.2 S tru ctu ra l C o m p le x ity [2 9]... 4 1 3 .2 A ircraft a nd A dvance M ate rials... 4 2 3 .2 .1 T im e lin e of A ircraft M ate ria ls ... 4 2 3.3 Autonomy for Single Pilot Operations... 45
3 .3 .1 R e v ie w of P ilo t O pe ratio ns ... 4 5 4 Framework Methodology ... 47
4.1 Development of Aircraft Safety Regulations... 47
4 .2 K e y A v ia tio n A cc id e n ts... 4 9 4.2.1 Grand Canyon Collision and the formation of the FAA [13] [14]... 49
4.2.3 TWA Flight 800 and the introduction of Nitrogen-Inerting Systems [18] [19] [20]...50
4.2.4 Boeing 787 Lithium Ion Batteries [21] [22] [23] ... 52
4 .3 L e s s o n s L e a rn e d ... 5 4 4 .4 S ystem P roblem S tatem ent...55
4.5 Proactive Certification Adoption...56
5 Analysis on More Electric Aircraft... 60
5.1 Certification Adaption for Even More Electric Aircraft... 60
5 .2 T ech no lo g y E valuatio n ... 6 0 5.3 Technology Infusion Assessment... 62
5 .4 P e rfo rm a n ce In d e x ... 6 4 5 .5 C a se S tud y S u m m a ry ... 6 6 6 C o n clu sio n ... 6 8 6 .1 F u tu re W o rk ... 6 9 B ib lio g ra p h y ... 7 0 Appendix A: Certification OPM...73
Appendix B: Design Structure Matrix... 76
List of Figures
FIGURE 1: AUTOMOTIVE TECHNOLOGY INSERTIONS ... 14
FIGURE 2: TECHNOLOGY RISK- OPPORTUNITY FRAMEWORK [4]... 18
FIGURE 3: TECHNOLOGY CONCEPTS AND BASELINE SYSTEM IN OBJECTIVE SPACE [4] ... 19
FIGURE 4: NOMINAL PROPOSED TECHNOLOGY INFUSION ANALYSIS FRAMEWORK (TIA) [5]... 21
FIGURE 5: OVERVIEW OF THE BASIC STPA METHOD [7]...26
FIGURE 6: GENERIC CONTROL LooP [7]...27
FIGURE 7: EVALUATION OF UNSAFE CONTROL ACTIONS [7]... 27
FIGURE 8: TRACEABILITY BETWEEN STPA OUTPUTS[7] ... 28
FIGURE 9: AIRCRAFT CERTIFICATION ELEMENTS... 30
FIGURE 10: MODEL OF THE TYPE CERTIFICATION PROCESS, FAA 8110.4c [9]... 31
FIGURE 11: TYPE CERTIFICATION ELEMENTS ... 32
FIGURE 12: TYPE CERTIFICATION AUTHORITY INVOLVEMENT...34
FIGURE 13: CERTIFICATION SYSTEM ARCHITECTURE ... 35
FIGURE 14: PORTION OF 737 ELECTRICAL SINGLE LINE DIAGRAM [24]... 37
FIGURE 15: PORTION OF 777 ELECTRIC SYSTEM SINGLE LINE DIAGRAM [24]... 38
FIGURE 16: TRADITIONAL BLEED SYSTEMS TRANSITION TO ELECTRIC [25]... 40
FIGURE 17: INCREASE OF ELECTRICAL POWER ON AIRCRAFT [28] ... 40
FIGURE 18: 777 VS 787 ARCHITECTURE [26] ... 41
FIGURE 19: INTRODUCTION OF MATERIALS IN AEROSPACE ... 43
FIGURE 20: NTSB PHOTO OF UNDAMAGED 787 LITHIUM ION BATTERY [21] ... 53
FIGURE 21: NTSB PHOTO OF BURNED APU BATTERY FROM JAL 787[2 1]... 53
FIGURE 22: AIRCRAFT GLOBAL ACCIDENTRATE [SOURC E: IA TA] ... 54
FIGURE 23: PROPOSED CERTIFICATION ADAPTION...57
FIGURE 24: ALL- ELECTRIC AIRCRAFT [26] ... 62
FIGURE 25: MEA CONCEPT DSM6...64
List of Tables
TABLE 1: PERFORMANCE INDEX CALCULATION ... 65Nomenclature
FAA Federal Aviation Authority
FAR Federal Aviation Regulations
EASA European Aviation Safety Agency
SDM System Design and Management
DSM Design Structure Matrix
OPM Object Process Methodology
NTSB National Transportation Safety Board
TIA Technology Infusion Analysis Index
TI Technology Invasiveness Index
MSRP Manufacturer's suggested retail price
MPG Miles per gallon
MBSE Model Based System Engineering
Equations
(1) Technology Invasiveness Index
(2) Technology Infusion Effort
(3) Architectural Performance Index
Chapter 1
1
Introduction
1.1 Motivation
The world of technology is forever growing and changing. The aerospace industry is fast advancing from the traditional industry it has been. No longer are new aircraft being developed with standard updates to old systems such as software or hardware
configuration changes. Most aircraft are introducing new breakthrough technologies and new system concepts. With the emergence of new technologies questions arise around system safety and how these new aircraft will be certified.
What is the purpose in developing new technologies or concepts that ultimately cannot be approved for use by the authorities? How technology has advanced in other
industries is telling of what is to come in aerospace. Take automotive for example. The growth and technology changes of the automotive industry over the years have been drastic. Starting with the advanced abilities of the car to detect traffic, the cruise control feature, and the ability for hands-off parallel parking. The transformation of the industry from horse and carriage to self-driving vehicles has taken place over more than a 100 year period.
Electric injection Cruise control Central locking Self-propelled cars Engines 1770 Climate control
ABS: Anti-lock Brake
Systems Automatic Windows
and Mirrors
Lane departure warning Blind spot warning
Signal recognition Automatic headlights
Smart phone apps Parking assistance
Artificial Intelligence
2000
Figure 1: Automotive technology insertions
These are not only changes in the vehicle's system architecture but drive changes to
the entire system infrastructure. Similarly, in an aerospace application, aircraft
advancements cannot be done in system isolation of both product or process. There
needs to be a path laid out in advance of the final development of the technology to
understand how the application will be utilized and what it will take to bring it to market.
There are several examples in aviation where the introduction of new technologies has
not gone smoothly and has caused significant rework or even cancellation of technology
insertion efforts. A specific example that will be discussed in this thesis is the
introduction of Lithium-Ion batteries on the Boeing 787 Dreamliner.
Technology has also changed how people drive and think of cars. But what if all of
these developments were done in isolation of both the consumer and the transportation
authorities? A quick glance into the regulation of self-driving cars is telling of how
Self-driving technology is physically available but many cities do not want to allow these cars on the road due to safety concerns. This is true despite the fact that some studies have quantitatively shown that the introduction of self-driving cars would likely lead to a net drop, not a net increase in traffic related fatalities [1]. What would have happened if authorities were more involved in the development process?
There is also another aspect that must be considered, which is the consumer
perspective. Take the development of phones. As phones get more advance and start to encompass more features, the typical basic phone that just dials and makes phone
calls is no longer acceptable. Consumer expectations and perception of technology is important and should be considered during technology development. How many people would actually want to fly on an aircraft with no human pilot but run by an automated
pilot instead? This is an important question which can lead to the inclusion of other technologies or features to satisfy consumer perception.
With a change to a system concept, there has to be an update or at the least an evaluation of what the process will be to make the technology useable. For advancements in technologies there is not only a change to the technology but a
change to the process and the way in which it is verified. A technology advancement in an industry cannot be made in isolation of the external system.
1.2 Objective and Analysis Approach
The hypothesis of this thesis is many of the traditional approaches of verification and validation will stand in the future of aviation, but advancements will be required to the overall certification process. This thesis investigates the verification and validation of a commercial aircraft designed and built today and challenges for emerging technologies such as more electric aircraft, additive manufacturing, and unmanned aircraft (drones). The analysis will focus on certification from the FAA and EASA primarily focusing on the
The primary analysis involves a comprehensive review of current aircraft certification rules and analyzes the traditional certification approach. The traditional approach is then analyzed against the evolution of technology in history and understanding how
requirements and aircraft have changed over time. The traditional approach is then combined with analysis methods to crystallize an adaptive framework to aid in the analysis of new technology.
1.3 Methods and Literature Reviews
Literature review for this thesis is broken into three parts and covered over three separate chapters. This section included in Chapter 1 focuses on different ways and
methods to construct and analyze a complex system. Many of the methods are taught and used as part of the MIT Systems Design and Management program. These
methods and approaches are used to structure the framework and analysis of this thesis. Chapter 2 includes a review of aviation regulations to help outline the current state of commercial aviation certification. Lastly in Chapter 3 there is a review of several literatures on certification failures.
1.3.1 System Architecture Methods
System architecture outlined in Crawley 2016 [1] uses a problem statement framework to establish the goal and set the boundaries of a system. This framework uses a to-by-using method which helps establish a solvable problem.
To: the statement of intent By: statement of function
Using: statement of form
Aviation certification is a large concept and using the to-by-using framework helps to bound the system to a certain area of certification for a specific type of aircraft. The
framework helps drive a focus to the intent of the system and the value. The book established this framework as a principle of the system problem statement.
Excerpt from Crawley [2016] Box 11.5 p247:
Principle of the System Problem Statement
The statement of the problem defines the high-level goal and established the boundaries of the system. It divides content from context. Challenge and refine the statement until you are satisfied that it is correct.
The statement of the problem has enormous impact on the eventual design.
With an understanding of the boundary of the system a process operand method can be applied to the framework to construct the system architecture using the three elements of intent, function, and form.
Two types of tools often used to represent architectures are OPM and SysML. OPM is used in this thesis as an object process relationship to help define and construct the architecture of the system. With the system being the commercial certification process. The construction of the OPM allows for the proposed framework to be visualized in the context of the traditional structure.
1.3.2 Technology Insertion Frameworks
There are several technology insertion frameworks that have been built upon each other. Two frameworks are presented below.
1.3.2.1 Insertion Framework by Rudy Smaling and Olivier de Weck [3] [4]
The framework suggested by Dr. Rudy Smaling (2005) describes how to analyze the uncertainties of adding new technology into existing complex systems. In Dr. Smaling's dissertation, the framework is broken down into six steps and shown in the figure below.
Technology
[j...
Technology fs ADSMInvasivenes Architecture CI C2 . C Baseline System DSM Fuzzy Pareto .Objective Filterin Simulation SpaceModel Results f DeinDmi
T Linked Filtering
FiguRisk Opportunity R Utility based Reduced Set [4]
PltPlotting sessment of Alternatives
External internal
Uncertainties Uncertainties
Figure 2: Technology Risk- opportunity Framework [4]
After framing and presenting different concepts, the first step in the process is a Monte Carlo Simulation and is utilize to estimate the response of the new technology concepts when introduced into the system. The simulation is multi-dimensional and encompasses an in-depth analysis which couples different technical disciplines such as controls and structures and aerodynamics. The result of the simulation is an objective space. The objective space compares the baseline technology with several proposed concepts based on system objectives.
The objective space is then plotted in order to define the s-Pareto Frontier in order to complete the second and third step in the process, Fuzzy Pareto Filtering and Design Domain Linked Filtering respectively. The purpose of the frontier is to not eliminate all dominated concepts but to utilize a combination of concepts to better understand the objectives. The design domain step further reduces duplication of similar design vectors. CI C2 E ---0 utopia c point
System objective J2 (e.g. emissions)
Figure 3: Technology Concepts and Baseline System in Objective Space [4]
A technology invasiveness analysis also referred to as technology infusion is the next step in the process and most relevant to technology introduction in commercial aircraft certification. As described in the literature, technology insertion in various forms such as material or new controls move beyond a pure technical impact but also include an
organizational domain. The analysis consists of three steps: 1. Establishment of a baseline Design Structure Matrix (DSM)
2. Building a change DSM relative to the new concept
A DSM can be used to represent different structural elements and interactions in a system. In this framework it is used to represent interactions between components. The
DSM is constructed with representation of different types of interactions: physical,
energy, information, and mass. The baseline DSM is then re-built to incorporate only the design changes based on each of the concepts presented. The diagonal of the DSM is used to represent a major event such as the addition of the new component, elimination of a component, or redesign of a component. The DSM also shows changes in the interactions. The eight types of changes are described below:
1. Change in the physical relationship between components a. Residing in the same module or subsystem
b. Residing in a different module or subsystem 2. Change in energy flow between components
3. Change in material (mass) flow between components
4. Change in information flow between components (typical for control) 5. Change in design of a component (marked on the diagonal)
6. Addition of a component (marked on the diagonal) 7. Elimination of a component (marked on the diagonal)
The changes are then used to calculate a TI index. The technology Invasiveness (TI) index captures the disruptive factor of a new technology against the baseline. The smaller the TI index, the less disruptive the technology is as it pertains to
accommodation and uncertainty in the system. The metric is calculated based on the eight types of changes and shown in the below equation:
8 N N
TI= w w i ADSM.
j=1 1=1 1=1
(1)
The first sum represents the weighted contribution of the change with the other sums representing the changes in the calculated changes in the DSM. Actual calculations of TI are shown as part of the technology case studies.
The utility-based assessment and risk opportunity are the fifth and six steps in the framework and are based on the outcomes of the first three steps. The utility
assessment seeks to understand the possibility of achieving performance in the system by analyzing different scenarios. This is then used to compute a level of risk and
opportunity which is plotted to assess the uncertainty of the concepts.
1.3.2.2 Technology Infusion Analysis Framework [5]
The risk opportunity framework outlined in Figure 2 is presented in this literature and further improved to include a re-constructed DSM and elements to evaluate value
impacts as shown in Figure 3. The revised framework eliminates the risk and
opportunity evaluation and replaces it with a value analysis which is more relevant to the evaluation of new concepts. The new framework had 10 steps as shown in the figure below and is referred to as the Technology Infusion Analysis framework (TIA).
E[A
A ADSM
T T1
W
Technology Baseline Baseline EffortIdentification System DSM Product
Idenifiatio tValue V(g)
Performance and Modified
Cost Models Prouct
V(Ag) 7
NPV]
Rcvcnue
* Impact
* Risk-Return Probabilistic
e Curve for NPV Analysis Cost
Technology - Impact
a[ANPV] Technology
Flo]
[91
Infusion
Evaluation
Figure 4: Nominal proposed Technology Infusion Analysis framework (TIA) [5]
This framework presented helps set an approach for how to analyze technology insertion in a project but also an additional view of the technology in terms of net present value of the concept.
In step 3 of the framework, the ADSM analysis outlines the same eight types of changes as proposed in Dr. Samlings' framework. However, the calculation of the technology invasiveness index uses unweighted metrics and is in terms of effort. The Technology Infusion Effort (TIE) equation is presented below.
N2 N2
1 ADSMj
TE - NECADSM _ i=1 j=I
NECDSM ~ NI NI
DSM i=1 j=i
(2)
NECAIsm = number of nonempty cells in the ADSM,
NECDsm = number of nonempty cells in the DSM repre-senting the original baseline product or system,
NI = number of elements in the D SM,
N2 = number of elements in the ADSM.
The next steps in the framework focus on the added value of the technology. The literature characters value in three ways: nominal value/ price, enhanced value in cost reduction and margins, and enhanced value in function. The TIA framework focuses on function as a measure of value as it relates to operating cost, performance, and
reliability.
1.3.2.3 Technology Infusion Assessments and Aircraft Certification
While the overall technology insertion assessment (TIA) method as presented by Dr. Smaling can be utilized to evaluate new technology into a system, its focus is assessing different possible scenarios and not an overall concept introduction. The examples in the literature are in depth in looking at distinct changes and impacts of introducing a
subsystem into an architecture. The introduction of a plasma fuel reformer into an automobile is more aligned with introducing an additional system or adding redundancy into a system.
The technology infusion analysis is a more relevant approach for technology insertion in aircraft certification due to the elimination of different scenarios and more of a focus on an overall technology insertion. The NPV analysis is helpful to evaluate technology
insertion in terms of revenue and cost but these are not drivers in aircraft certification.
The introduction of a technology into the industry can be evaluated using some of the same methods, however, the importance of the architecture structure is not the focus of aircraft certification. Technology as a whole can be introduced in a variety of ways and architectures based on the technology will vary and will be the base of comparative advantage for many corporations. For aircraft in addition to understanding the specific architecture changes there needs to be an impact assessment of the technology effects on the certification in comparison to present technology.
Although the entire framework may not be relevant for aerospace certification, the technology infusion effort (TIE) is essential to evaluate the impact of the technology as related to disruption and is a metric that can evaluated in comparison to legacy aircraft. The TIE can then be used as a criterion to better understand how much of a disruptive impact the new technology has. Certification requirement deltas can then be evaluated based on how disruptive the technology is based on the TIE threshold set by the
authorities. In the industry today, changes are often made to different systems whether as modifications and upgrades or as new components, however, re-certification of the aircraft is often required which is costly. The TIE threshold can be utilized to determine whether or not re- certification is required and how risky a new technology is.
1.3.3 Architectural Performance Index described by Carlos Gorbea [6]
The architectural lifecycle framework proposed in the literature by Carlos Gorbea uses a variation of the S-curve to better understand technology innovations in a systemcontext. The main analysis index of the framework scores the performance of various architectures based on five system variables: power, weight, maximum velocity, fuel efficiency and MSRP.
The use of the framework is driven by architectural innovation which is defined as a reconfiguration of a baseline architecture. The framework seeks to take the "mental model" of the S-curve and adds a quantitative analysis for performance in the context of vehicle engines. The analysis calculates a performance index based on the following equation below. Architectural Ii Performance Index
[
(, -)) P/..)) + mVi -V MPGi - MPG (V. -V )+MPG.x -MPG. )(
MSRPu - MSRP1 +4 MSRPm. - MSRP I/ - (3)The equation takes each parameter unweighted to calculate the architectural
performance index. All parameters in the equation are relevant to the performance of an automobile. The first part of the equation is the power to weight ratio which is a measure of acceleration performance. The velocity category helps differentiate older cars from newer cars in terms of speed range. The third category is fuel efficiency measures as miles per gallon. Last is MSRP which is used to assess performance verses dollar spent.
In the context of aircraft technology, the parameters to measure performance would be slightly different than the automotive application. In order to rework the equation as it may pertain to an aerospace application, a brief analysis is done on the different parameters in the equation to help transform the equation for other applications.
Essentially, the architectural equation can be broken down into four elements. The first is a relevant power ratio as described in the power to weight parameter and utilized to understand acceleration performance. The second part of the equation is velocity. The velocity category is used more as a historical indicator. In the past velocity was an important characteristic of the automotive architecture, this is not the same case today but the parameter serves as a level set factor because what is important today may not have been important in the past and vice versa. Fuel efficiency is used as an economic factor. Lastly is MSRP which is a value parameter and as described in the literature is
an indicator of performance per dollar.
The overall architecture performance index equation is a useful tool to categorize benefit of a certain architecture verses another. In order to utilize the equation for applications other than automotive, the performance parameters would need to be re-characterized for the relevant application.
1.3.4 Systems Safety Methods, Nancy Leveson and John P. Thomas
[7]
There are several approaches to system safety but most are reactive approaches. Nancy G. Leveson and John P. Thomas created the System- Theoretic Process Analysis (STPA) method to better analyze safety in complex systems in a proactive manner. STPA is a hazard analysis technique evaluation of component failures but also the hazards caused by interactions of system components. According to Leveson [7] some benefits of this as applicable to new technologies:
- Used during early concept analysis to assist to identify safety requirements and constraints
- Includes software and human operator analysis
- Documentation of system functionality
The method is based on system theory where the statement "a whole is more than the sum of its parts" is the foundation of the analysis. STPA can be broken down into four steps shown below.
STPA
1) Define 2) Model 3) Identify 4) Identify
Purpose of -0 the Control -*Unsafe Control -0 Loss the Analysis Structure Actions Scenarios
Identify Losses, Hazards
Define-Environment
boundary L
System
I I L
Figure 5: Overview of the basic STPA method [7]
The first step is to identify the purpose of the analysis. What is to be accomplished by the analysis? This part is broken down in four parts.
1. Identify the losses
2. Identify the system-level hazards
3. Identify system level safety constraints
4. Refine hazards
The second step is the build of the system. This is known as the control structure. The control structure captures the functional relations and interactions within the proposed system. This helps identify the hierarchical structure and what controls what.
Control Actions
tFeedback
Figure 6: Generic Control Loop [7]
The third step in the process is to identify unsafe control actions. An unsafe control
action is an action that will lead to a hazard. Using the control structure configured in
step two, control actions are identified and evaluated as shown below.
Control Not providing Providing causes hazard Too early, too Stopped too
Action causes hazard late, out of soon, applied too
order long
Figure 7: Evaluation of Unsafe Control Actions [7]
The final step in the process is to identify loss conditions. These are the conditions that
will lead to the unsafe control action and eventually to a hazard.
Controller
Control
Process
Algorithm
Model
Losses
System-level Hazards System-level
Responsibilities Unsafe
E
Control Actions Controller constraints Scenarios Scenarios (without UCAs) (with UCAs)Figure 8: Traceability between STPA Outputs[7]
As stated above traditional safety analysis are usually retroactive and based on chain of events. Nancy Leveson states traditional accident analysis focus on blame and
understanding how to prevent the accident in the future. With new and emerging technology, the traditional retroactive approach to safety will not be impactful. As discussed further in section 3.3 a decrease in aerospace accidents has reshaped the
industry. Therefore, a more proactive approach such as STPA is useful when evaluating new technology in complex systems.
Chapter 2
2 Current Aerospace Certification Process
Chapter 2 serves as the second part of the literature review. This chapter include details from several documents provided by both the Federal Aviation Authority and EASA.
2.1 Certification Authority
In the United States, civil aviation is regulated under the authority of the U.S. federal government through the Federal Aviation Authority (FAA). The FAA has responsibility for several areas of aviation including air traffic control and management, airport
operations and construction, commercial space vehicles, and the certification of aircraft. Aircraft certification under the FAA falls under the Aviation Safety (AVS) organization. Unlike the United States, in Europe, aviation authority is not assigned to an individual country but monitored through the European Union. The agenda for European Aviation Safety Agency (EASA) is similar to the FAA in monitoring safety rules, constructing legislation, and granting approval to aerospace product manufactures.
2.2
Certification Overview
Aircraft certification confirms the airworthiness of an aircraft. It signifies an aircraft has been designed, tested, and built per regulatory requirements.
Aircraft certification can be split into three categories: design certification, production certification, and airworthiness as shown in Figure 9. Type certification is relevant to the design phase of the aircraft and the focus of this thesis.
Type Certification Prdcto Certificat.on Post* C'r -i.iao
Figure 9: Aircraft Certification Elements
Production certification is the approval of the assembly of the aircraft. This phase of the
program focuses on consistency and quality of the assembly. Outlined in the FAA FAR
14 part 21 [8] Production certification consists of the quality control systems, critical
manufacturing requirements, and the defect detection system.
Post certification is the upkeep of the aircraft during flight operations also known as
continued airworthiness. These are the directions aircraft need to follow in order
maintain a safe status to continue to fly. Post certification is also a phase where slight
modifications to products can be made. Standards as to what is defined as a
modification are ambiguous and could be further researched as to how to close the gap.
Aircraft directives are utilized to communicate important and possibly unsafe conditions
that need to be corrected in products. Manuals and handbooks are also an important
part of post certification.
2.3 Type Certification
Type design certification approves the design and engineering analysis of an aircraft
including the airframe and all the subsystems that make up the aircraft. This approval
verifies the aircraft is designed per standards and meets the requirements needed to
declare a functional and safe aircraft. In order to complete design certification there are
several phases as outlined in the figure below.
IModel of the Type Certification ProcessI Conceptual Design Requir.ments CompItance lmplementation
OslnItion Plenr*ng Familiarizatlon Interim TCBM for
Pre-flight 2
Briefing Certifcation Basis TCBM
Process Preliminary 6 Interim TCBM Dr R
Oriebon! TCBM j Certification Plan
Pre-project Guidance I
SReguky & TC Applicinf
Policy Discussions Cerilillcn Pion to FAA 2-4
FAA Project Work --ACO. MIDO, AEG, Directorate
EstBg~s TC Projec 2-4 Type Cer~kwilla (C)
Cartifcation Project Nolica (CPN)2-4 JITCD
Form Certilliction Town 2-4
Cr licau on Project Plan (CPP)2 4o
(Project Specific] Cert. Plan -4 (p,*ctkoeII 2a(eeefl
Papers, Issues Book2 -4"- 24h
J Cerltillcallon Basis 2-4J 0
FAA Involveent 2
Oversight and
Delegation24-I Erineerig Confoanity Pgmn2 g
egen:g I
Prolonged Activity 1
Fenneal Coielhswitlon Ewet
TM viMhAppflcam hulkitomSee Figure 2-9 Implementation Phase F93e2-Post CerIfcation Activities -6q 2 - y 2-ci Continued Airnortiiness -1 Product in Service 2-7dl hanges to ICA Evaluations 2-7&72 Date Ratentionm
Figure 10: Model of the Type Certification Process, FAA 8110.4c [9]
High level elements of Figure 10 are summarized below for the type certification phase
in Figure 11 showing phases and the system boundary.
-=rmraAicraf
Ce..r..
if.i.a.t..o.
- Conce t Desi nI
- Requirements DefinitionI
-- Cornpliance PlanningI
- ImplementationI
-I Manufactu ringIL
_
__.
System BoundaryFigure I]: Type Certification Elements
Design certification starts with conceptual design and goes through post certification activities. The certification process and means of compliance can be seen by many
OEMs and suppliers as a competitive advantage. The aviation authorities' layout
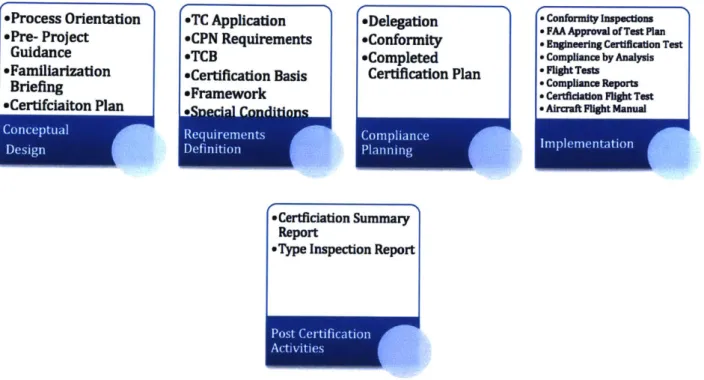
guidelines but the actual speed of the process and how it is conducted is often kept as a secret within the companies. Below each process description is high level and will often vary by companies as to how they approach each phase. However, for the basis of this thesis what is important is the involvement of the authorities, described below and outlined in Figure 12, and challenges (discussed in Chapter 3) often faced during the process.
Starting with the conceptual design phase, this is often regarded as the idea. This is the initial phase of certification and the initial plan is laid out and established. The applicant notifies the Aircraft Certification Office (ACO) of an intent to certify a project. Pre-project guidance directions are given to the applicant as well as procedural and technical
requirement guidelines established. The involvement of the authorities during this phase is informational. The applicant and the authorities layout the basic guidelines of
The requirements definition phase is one of the most critical phases during aircraft certification and considered the first half of the actual product development. This phase is where the OEMs and airframe companies show how the concept will become a
reality. This phase of the project outlines the design of the products and the deliverables required. Authorities in this portion of the process have a major role. The Certification Project Notification is given to the authorities where initial designs are viewed and the initial certification basis is defined. This phase is also where special conditions are requested. Special conditions are commonly used to cover new technology where rules have not yet been written.
Compliance planning follows requirements definition and is also a part of the first half of product development. The authorities require an understanding of how and the
timeframe of the certification activities. This involves if requirements will be satisfied by tests, analysis, or inspection. Delegation of approval is also conducted during this
phase. Conformity is the preparation for testing and is also conducted during this phase. The authorities if they have not delegated are usually on site to conduct these
inspections.
Implementation can be broken down even further to data generation, substantiation activities, and findings. Implementation is the second half of the product development and is usually the longest phase in a project. Compliance activities at the system level and aircraft level are performed. Starting with the subsystem level this phase introduces the actual testing of the projects. The actual testing of an aircraft is quite complex and is performed at many different levels. The component level and system level testing need to complete a certain milestone before aircraft level testing can start, especially actual flight tests.
Tests and analysis are the source of the data generation. The question the authorities look to answer during this phase are is the design meeting the intended requirements?
The last phase after approval of implementation and compliance to the requirements is the manufacturing and post certification activities. This is a continuous process between the authorities and the QEMs. This is also where the involvement of the customers (owner/ operators) is included.
eProcess Orientation ePre- Project Guidance eFamiliarization Briefing *Certifciaiton Plan eTC Application eCPN Requirements eTCB eCertification Basis eFramework .cy..,.i.,i Cn.,tnww.. eDelegation *Conformity eCompleted Certification Plan -Conframnity Inspecons *FMA Approval of Test Plan -EngInee Certication Test
-compliance by Analysis *-FightTests " Compliance Reports " Cerifiation Flight Tst e Aircraft Flight Manual
wmlmnainA
*Certficiation Summary Report
eType Inspection Report
Figure 12: Type Certification Authority Involvement
2.4
Certification Process- System Architecture
There are many ways to describe the system architecture of a complex system. In this
thesis the "system" is the actual certification process outlined by the authorities. The
system architecture method as briefly defined in section 1.3.1 is used to create Figure
Aircraft Certiflcation Passenger FRying Concept generating -- -- Suppiersoncept---- requirements defining Aircraft compliance planning
certification authortity rqre nts
test plan
product testing
subsystems
Chapter 3
3 Emerging Aerospace Technologies
The aerospace industry has come a long way from peddling aircraft to one of the most used modes of transportation. Aircraft have allowed people to explore parts of the world that were at one time unreachable and the continued advancement of technology will allow aircrafts to become even more affordable and accessible. The following sections are an exploration of emerging technologies and the application to aircraft.
3.1 More Electric Aircraft
A technology that continues to evolve is the electrification of aircraft. In this context aircraft are "More" electric as opposed to "All" electric. Currently aircraft have four major sources of power: electric, pneumatic, hydraulic, and fuel. The trend in the industry is to utilize more electric power to supplement and sometimes replace other power systems. The following section looks at the history of the trend, the present state, and the
analysis of the emerging direction of creating an even more electric aircraft than what exist today.
3.1.1 History of the Aircraft Electrical Architecture
The history of electrical architecture shown through different aircraft helps illustrate how and why the electric system has evolved. It is important to first look at the evolution of the electric system and then how and why the electric system as a power source is used to replace other traditional systems. The evolution of the electric system architecture can first be described with a comparison of the 737 and the 777.
The Boeing 737 which is the most popular aircraft of all time was first developed in the late 60s. The electrical system for the aircraft was very component based meaning each
component served really one purpose. Focusing on the generator, in this application constant speed drive is separate from the air-cooled generator. The 737 also included large and very segregated controllers. The diagram below is a single line of the 737 from legacy Hamilton Sundstrand.
- APU am I Goo GB U AG EP C GENENUf 1 c Ge 4I I APII 1xs L FR BUS I j GE GEN BUS 2
L
2
2=. XFRMU92] 737 Single Une DagramFigure 14: Portion of 737 Electrical Single Line Diagram [24]
The Boeing 777, which is considered one of the safest aircraft of all time, has an electrical system more complex than the original 737s. The change in the system was driven by extended twin operations which allows an aircraft to fly over long periods of time and over bodies of water. Without certain levels of ETOPs an aircraft flight route had to be within certain distance of airports and mostly over land. Before the 777, ETOPS was usually achieved after formal type certification.
In order to achieve ETOPs at certification, a change to the architecture of the aircraft was needed. The electrical system was enhanced to provide a backup system and
redundancy. The goal was to prove reliability at the beginning of the aircraft testing
42
instead of waiting to prove reliability of an aircraft over time. An exert of the 777 Electrical system single line is below.
L GEN CT A GEN CT SECONDARY PRIMARY
R GEN CT EXTERNAL EXTERNAL POWER POWER L DO APU\% O ILGE RIDG L APUU Rc GCU OCU --- r--- r--- --- ---SIPC P IC L IE us 9 BAW odG?::P*II u 02 LCS GC AP RGC
L MAIN US R MAIN BUS
IE M
IS----777 Single L.ne DingrarnAin ChSnnelS
Figure 15: Portion of 777 Electric System Single Line Diagram [24]
The 737 and the 777 both use the four main power sources: hydraulic, pneumatic, fuel, and electric. The 737 unlike the 777 has a more component based structure in the electric system as shown in Figure 14. The 777 embodies a more integrated approach with less components but more redundancies built into the electric system as shown in
Figure 15. The 777 is also a more complex system. Both aircraft use one generator per engine driven by the engine gearbox. However, the 737 uses a constant speed drive separate from the generator and the 777 uses an integrated drive unit (IDG) which is the drive and generator in one component. Two separate main buses (left and right) are supplied power independently by the generators on both the 737 and the 777. However, the 777 also has what is referred to as a Backup System. This system unlike the main electrical generators includes a variable speed direct drive generator which can be utilized in a loss of all main power and is also linked directly to the flight controls. The
777 also incorporates no-break-power transfer (NBPT) which is a feature that allows a momentary overlap of power on the buses. The 737-electrical system logic prevents two sources from powering the same bus and therefore during power source switches there is a momentary power loss. The 777 with the NBPT allows for paralleling of power so power is never lost.
Even with the success of the 777, there was still a need for aircraft architectures to transform. With a rise in fuel cost, airlines showed reduced profit margins and many started to struggle to stay in business. The answer was a market need for aircraft to be more efficient. To accomplish a more efficient aircraft many stakeholders took different approaches. Pratt & Whitney created the Geared Turbo Fan Engine, which essentially places gearbox between the fan and low spool to allow each phase of the aircraft to spin independently at optimal conditions. However, Boeings answer was to make a more electrified aircraft architecture and a new aircraft called the 787.
The Boeing 787 accomplished efficiency in a number of ways. Starting with the material of the aircraft and using composite instead of aluminum. However, the most significant change was to reduce and, in some cases, eliminate pneumatic air systems. Many traditional aircraft systems use pneumatic air to function including but not limited to the engine start system and most importantly the air management system. The
transformation is outlined in the figure below. With the removal of bleed air to these systems, power needed to be generated from the electric system. In order for this to be accomplished, one of the most complex electrical systems needed to be designed. The 787-electrical system not only needed to produce more electrical power for the aircraft but also needed to distribute the power and have several layers of redundancy since most of the aircraft relied on electrical power. For example, the 787-electrical system includes eight common motor start controls which are electric engine starters to replace the traditional air starters. The traditional window shades which are mechanically driven are also replaced with electro-chromatic dimmable windows. The demand for electricity on this aircraft is greater than any other aircraft as shown in the figure below.
BLEED-AIR POWERED - --- + ELECTRIC UNAFFECTED SYSTEMS: Engine anti-ice system AFFECTED SYSTEMS: APU start Brakes Cabin pressurization Engine start Hydraulic pumps
Wing ice protection
The transition from bleed-air power to an electric
architecture reduces the mechanical complexity of the 787.
Figure 16: Traditional Bleed Systems transition to Electric [25]
1000 P (KVA)
f
1962 1966 1969 1987 1993 2004 2010 Year
Cararde 8737 Comawde A320 A330 A3I 8737
Figure 17: Increase of Electrical Power on Aircraft [28]
500 400 300 200 100 0 00 00 -""Pwi / -JmL
3.1.2 Structural Complexity [29]
One way to look at the evolution of electrical architectures of an aircraft is through
system complexity. An approach proposed by Dr. Kaushik Sinha uses the structural
architecture to understand the complexity of the system.
The structural complexity metric by Dr. Kaushik Sinha yields the below equation:
Structural Complexity,
C = C
1+ C
2C
3 (4)The equation puts an emphasis on three elements; the complexity of the component (Cl), the complexity due to component interactions (02), and the complexity of the topological formation.
More powerful but more complex
The 787's electrical system powers many functions that on previous planes were driven by hydraulic and pneumatk power. and operates at higher voltages -up to 235 volts AC -versus 115 volts AC on earlier models. The lIthium-Ion batteries at the center of the 787's recent grounding are also a new element.
On~e ek~tricaI -4101611111M bay Ceriiked-&,rIurvmw L "I genegaw sewrce Se Vn 787 Two eItltIaf Dilbned" wirbri sygem MIs miw L GENERATORS
KELLY SHEA / TE SATTLE TIMES
Figure 18: 777 vs 787 Architecture [26]
An alternate view of complexity may compare mechanical complexity arguing the
787-reduced complexity by moving away from mechanical systems. However, it was merely
a tradeoff of component mechanical complexity for a different type of system complexity.
With the tradeoffs in complexity and the continued desire for aircraft to become even more electrified authorities continue to see changes to the overall aircraft architecture. However, there have been no significant changes to standardize how to evaluate the change in complexity or the new architectures besides the use of special conditions.
3.2 Aircraft and Advance Materials
Manufacturing in aerospace is unlike many other production industries. Materials throughout an aircraft are carefully selected based on certain material properties. The material used on one section or system on the aircraft is not always the same material needed elsewhere on an aircraft. Different systems require different materials based on temperature or structural needs. This section reviews and analyzes changes in material technology in aerospace and specifically commercial aviation.
3.2.1 Timeline of Aircraft Materials
Materials are critical to the architecture of the aircraft and play a fundamental role in the design of products. The overall mission of aircraft is to safety move people and goods in a way that adds value to customers and consumers. Material technology aid in both safety and cost. The advancement in material technology over the last few decades has helped the industry to reduce weight in the aircraft, increase operational efficiency, and has impacted fuel burn on engines.
The Wright Brothers in 1903 designed the first aircraft with wood and fabric. Wood was selected because of the high strength to weight ratio and the fabric on the wings helped to smooth the wing surface to create better aerodynamics. The aircraft also included steel for wire construction and aluminum for the engine [30]. The transition of materials in aircraft as described in Mraz, 2003 is shown in the figure below.
Composites
Metals
1980s
1925
Beech
Plywood Starship1920s
Ford 4- AT
Fabrice190 1900s Northrop S1 Wright FlyerFigure 19: Introduction of Materials in Aerospace
The transition from fabric to plywood in the early 1920s also introduced the importance
of the manufacturing process in order to achieve the desired properties (strength) of materials. The S1, one of the first aircraft to utilize plywood for the skin and fuselage, was created by Northrop. A part of the manufacturing technique was to use an inflated rubber bag to uniformly pressure the plywood to create quarter-inch-thick half shells to form two halves of the aircraft. The technique cut aircraft drag with a reduced number of struts and wires.
In 1925 Henry Ford introduced the 4-AT, an all metal aircraft. The design used
corrugated-aluminum for the fuselage which could increase the strength of the aircraft, however, the manufacturing was difficult [30]. Without the right manufacturing
technique, the material benefits of the corrugated aluminum could not be achieved and the aircraft was just too expensive. Although not successful in production, the 4-AT introduced the concept of all metal aircraft which eventually lead to the creation of the DC-3 a few years later which was able to achieve a profit as a metal aircraft.
The utilization of metal continued to evolve into the 1960s with the introduction of new alloys, specifically titanium alloys. Aircraft see significant changes in temperature throughout a flight cycle and one of the benefits of titanium is it becomes stronger with heat. Titanium also allows for weight reduction as it possess a high strength to weight ratio. However, titanium is expensive in comparison to other metals such as aluminum and steel. Titanium has the desired material properties; however, the cost of the material limits its value. Like most metal alloys, titanium also requires a substantial number of rivets which effects loads on an aircraft.
Loads and the desire to eliminate rivets introduced aerospace to composite materials and new ways of manufacturing. Composites are matrix materials or resin fibers with reinforcements and allow design flexibility. However, there are limits to repair and inspection of the materials. The Beech Starship was the first all composite aircraft but was unsuccessful in figuring out how to drive cost down in the manufacturing process. The Beech Starship was one of the first aircraft to utilize the "sandwich" construction process to create more rigidity in materials. The technique, utilized in conjunction with composite materials, uses a honeycomb lattice placed between two thin outer panels to carry loads.
In addition, different material properties are critical to different aircraft systems and manufacturing of the material significantly affects the materials properties. A driver for advanced materials for aircraft engine and aircraft brakes are both thermal efficiency. However, for an aircraft engine the objective is to run at higher temperatures to therefore produce more energy. The desire for an aircraft engine to run hotter has
moved materials from the traditional nickel-based alloys to CMC materials. For aircraft
brakes the critical material characteristic is also thermal management but not how hot a material can get but how quickly it can cool down. A reduction in brake cooling time means a quicker gate turn around for an aircraft.
Overall different materials have been utilized in aircraft each with its own benefits and areas of concern. Advancements not only in materials but in manufacturing continue to
drive research in this area. The drive for advancements has often been slowed by the development of the technology but also by the amount of effort needed to certify a new material. Currently, unlike other technologies, materials are certified wholly by test and the average time to design and test a new material is 8-10 years.
3.3 Autonomy for Single Pilot Operations
The automotive industry as mentioned earlier has continued to make technology
advancements reducing some of the tasks a driver has to perform while driving such as not having to step on the gas pedal to maintain speed during cruise control. The
aerospace industry has done the same. At one point there were four or five pilots in an aircraft flight deck. This section looks at how over time pilot operations have been reduced which has allowed for two pilot operations and where technology will get the industry to single pilot operations and how the certification of the aircraft has and can been impacted.
3.3.1 Review of Pilot Operations
Pilot operations is a big expense for airliners and several studies show automation of certain aircraft features has led to significance reductions in aircraft operational cost. Automated systems help save fuel and in general increase system efficiency and aircraft safety. Research shows majority of airline accidents are a result of pilot error. These systems eliminate human factors such as fatigue and are also more available than pilots which there is a shortage of in the industry [35].
Over time the number of pilots has been reduced as technology has developed. In the 1950s pilot flight crews consisted of between four and five people: the pilot, co-pilot, navigator, flight engineer, and radio operator. The radio operator was one of the first replaced by technology. The operators job was to handle telecommunications between the ground and the flight crew. This individual was the primary contact for air traffic control. As radio communications became more sophisticated there was no longer a
additional task for the other flight crew members. The next operation to be over taken by technology was navigation. The flight navigator's primary function was to ensure the route for the aircraft using dead reckoning and a sextant to understand the aircrafts position. With the introduction of GPS, the navigator was largely no longer needed. Some aircrafts today still utilize a navigator and the Royal Air Force in the UK still trains individuals for the position. Remaining today are the pilot and the co- pilot. However, the actual task list for both pilots is minimal. With so many advancements in technology such as autopilot, aircraft essentially fly and land themselves.
The combination of technologies ability to reduce pilot operations and the regulatory requirement for systems to be so sophisticated in order to only require one pilot operation under certain conditions has led to the continued research into single pilot operations. However, there are no guidelines currently by the authorities on how to certify a single pilot aircraft.
Chapter 4
4 Framework Methodology
This section reviews the history of certification in aviation and examines some of the major accidents and problems that have occurred. The combination of the current state framework as presented in the above chapter and the lessons learned from previous certification accidents are used to develop a proposed framework on how to approach the insertion of some of the upcoming aircraft technologies.
4.1 Development of Aircraft Safety Regulations
The structure of aviation certification came about due to accidents and problems often
experienced in the growing industry in the 1920s and 1930s. The first type certification
was issued on March 29, 1927 to the Buhl Airster C-A3 three-place open biplane and signed by a 1925 MIT engineering graduate by the name of John L. Hosch. By the end of the 1920s there where over 170 type certifications issued and by January 15, 1930 there were about 287 issued. Accidents during these times were very common and in fact Hosch died in an aircraft accident himself [12].
Type certification regulations were the responsibility of the Department of Commerce Aeronautics Branch which was establish in 1926. First regulations were specified in
December of 1926 and included the following in order to obtain a type certification [12]:
(a) Three view drawings of the airplane with dimensions, aerodynamical, and balance diagrams for varying load conditions.

![Figure 2: Technology Risk- opportunity Framework [4]](https://thumb-eu.123doks.com/thumbv2/123doknet/14219513.483401/18.917.170.743.298.714/figure-technology-risk-opportunity-framework.webp)
![Figure 3: Technology Concepts and Baseline System in Objective Space [4]](https://thumb-eu.123doks.com/thumbv2/123doknet/14219513.483401/19.917.295.607.330.657/figure-technology-concepts-baseline-objective-space.webp)
![Figure 4: Nominal proposed Technology Infusion Analysis framework (TIA) [5]](https://thumb-eu.123doks.com/thumbv2/123doknet/14219513.483401/21.917.126.772.598.996/figure-nominal-proposed-technology-infusion-analysis-framework-tia.webp)
![Figure 5: Overview of the basic STPA method [7]](https://thumb-eu.123doks.com/thumbv2/123doknet/14219513.483401/26.917.121.765.398.707/figure-overview-basic-stpa-method.webp)
![Figure 6: Generic Control Loop [7]](https://thumb-eu.123doks.com/thumbv2/123doknet/14219513.483401/27.917.319.588.109.423/figure-generic-control-loop.webp)
![Figure 8: Traceability between STPA Outputs[7]](https://thumb-eu.123doks.com/thumbv2/123doknet/14219513.483401/28.917.242.653.112.443/figure-traceability-between-stpa-outputs.webp)

![Figure 10: Model of the Type Certification Process, FAA 8110.4c [9]](https://thumb-eu.123doks.com/thumbv2/123doknet/14219513.483401/31.917.88.811.112.612/figure-model-type-certification-process-faa-c.webp)