COMMERCIAL REMODELING:
USING COMPUTER GRAPHIC IMAGERY
TO EVALUATE BUILDING ENERGY PERFORMANCE
DURING CONCEPTUAL REDESIGN
by
KYLE D. WILLIAMS
Bachelor of Arts in Architecture
Iowa State University
Ames, Iowa1977
SUBMITTED TO THE DEPARTMENT OF ARCHITECTURE IN PARTIAL FULFILLMENT OF THE REQUIREMENTS OF THE DEGREE OF MASTER OF SCIENCE IN ARCHITECTURE STUDIES
at the
MASSACHUSETTS INSTITUTE OF TECHNOLOGY
June, 1985
c Kyle D. Williams 1985
The author hereby grants to M.I.T. permission to reproduce and to distribute publicly copies of this thesis document in whole or in part
Signature of author Kyle D. Williams Department of Architecture 10 May, 1985 Certified by , -Timothy E. Johnson Principal Research Associate Thesis Supervisor
Accepted by
rbofessor Julian Beinart, Chairman Departmental Committee for Graduate Students
MASSACHUSETTS5 INS *OU TE OF TECHNOLOGY
COMMERCIAL REMODELING: USING COMPUTER GRAPHIC IMAGERY
TO
EVALUATE
BUILDING
ENERGY
PERFORMANCE
DURING
CONCEPTUAL REDESIGN
Kyle D. Williams
10 May 1985
ABSTRACT
This research is an investigation of the relationship between commercial
remodeling and building thermal performance. A computer graphic semiotic is developed to display building thermal performance based on this relationship.
Commercial remodeling includes everything from minor tenant improvements to whole building redesign. One type of remodeling, rehabilitation, has flourished in recent years and is the concentration of this research. A distinction is made between rehabilitation and other types of remodeling, such as refurbishment, renovation and rebuilding. Rehabilitation is defined as major changes to a building. either to save the building from decay of structure and services or to extensively modify the building for another use. A trend in the building
industry towards increased activity in remodeling has been developing over the last ten to fifteen years. Based on the 1982 Census of Construction, commercial remodeling accounted for about 10% of all nonresidential construction receipts, representing over a four billion dollar market. This trend, as well as the reasons for the trend and its implications to designers is discussed in this research. The combination of continual maintenance, changes in the federal tax laws and an acceptance by commercial tenants to be located in rehabilitated buildings are the major reasons for the trend.
The energy crisis of 1973 increased public and governmental awareness of the need for thermally responsible buildings. Therefore, building energy use became a design requirement for architects and engineers. Energy use has special significance for remodeling. Because energy systems (lighting, heating and cooling systems) do not last as long as structural systems, a large percentage of the remodeling cost is associated with the renovation or replacement of these systems. Further. operating costs are .of primary concern to owners and tenants. The cost of energy and maintenance of energy systems are large contributors to total operating costs. As with any design element. energy use must be considered at the earliest stages of building design or redesign. This is especially true with a remodeling project. The building's existing lighting, heating and cooling systems must be evaluated as well as the building's structure and space allocation. Only after the relationships between these building characteristics are understood can an appropriate design concept be proposed. The computer graphic semiotic proposed as part of this research is used to develop graphic images as aides in determining the relationship between the building configuration and the building's energy use. The basis for this evaluation is energy cost per square foot for each season, and peak heating and cooling loads in 1000 BTU/hr by building zone (north, east, south, west and core). The images are specifically intended for use during predesign evaluation and early conceptual design.
Currently, so called computer design tools produce a multitude of confusing numerical tables and equally confusing graphics such as bar and pie charts. The difference between the proposed semiotic and standard graphic theory is that it is intended specifically for use with a computer and takes
advantage of a computer's unique capabilities. Typical computer displays are merely standard print graphics produced by a computer. The proposed system
displays quantities and the components that make up the quantities. The quantities in the prototype developed are energy cost and peak loads. Each
image, representing each quantity, can be independently evaluated. In other
words, no ordinate or abscissa is necessary to compare the values of each
quantity.
The discussion of the new imaging system is concluded with a proposal for future development where each image is used as an "icon" by the user to be manipulated, stored, or combined with other images. With the use of the computer, and a new imaging system, complex data can be visually ordered in a way as to be quickly interpreted and understood, a necessity during conceptual design. Information is thus transformed into knowledge.
Thesis supervisor: Timothy Johnson Title: Principal Research Associate
TABLE OF CONTENTS
ABSTRACT 2
ACKNOWLEDGEMENTS 5
INTRODUCTION 6
REMODELING TREND 11
MAINTENANCE AND REPAIR
HISTORIC PRESERVATION
REMODELING AS AN INVESTMENT OPPORTUNITY
DECISIONS TO REMODEL 17
REASONS FOR REMODELING
ALTERNATIVES OF THE OWNER/DEVELOPER
DESIGN AND REMODELING 24
QUESTIONS TO BE ANSWERED
COMBINING THE OLD WITH THE NEW
COMPLIANCE WITH BUILDING CODES
ENERGY AND REMODELING 33
REASONS FOR REMODELING REEXAMINED COST OF ENERGY SYSTEMS
TURNING INFORMATION INTO KNOWLEDGE 42
THE SEMIOTIC SAGE FUTURE DEVELOPMENTS CONCLUSION SUMMARY 68 APPENDIX 72
SAGE SOURCE CODE LOTUS WORKSHEET
ACKNOWLEDGEMENTS
Tim Johnson's enthusiastic support and rigorous standards for research
contributed greatly to this thesis. I will always be indebted to him for his role
in making my stay at MIT a valuable learning experience.
I would like to thank Bill Wright for initially pointing out the need for
a better graphic approach to computer energy analysis. His help and support for
this research is very much appreciated.
The Cabot Fund for Solar Research, administered by MIT, provided
financial support for this research. I am grateful to them.Finally, I would like to thank all the architects, engineers and developers
who gave their time in answering the many questions I had concerning this
research. I hope this research is as useful to them as their responses were to
me.
A good deal of research has been conducted regarding new building design and construction. This research concentrates on an area of the building
industry that has been largely ignored: commercial remodeling. Specifically, this research is an investigation of the relationship between commercial remodeling and building thermal performance. The final result of this investigation is the development of computer graphic displays from which architects and engineers can, for the first time, identify the relative importance of energy related issues
to the remodeling of a commercial building. Here, "energy related issues" includes the effects of internal heat gains, solar heat gain through glazing, exterior wall design, building configuration and occupancy patterns on the building's heating load, cooling load and cost of fuel to meet the building's loads. Further, the effects on initial building costs and operating costs are included as important energy related issues.
There is a growing trend in the construction industry towards increased activity in remodeling commercial buildings. This trend is exemplified by the fact that in the 1982 Census of Construction, commercially remodeled buildings accounted for over four billion dollars worth of work. There is, however. confusion as to exactly what "remodeling" is. "Remodeling", "refurbish",
"adaptive reuse", and "rehab" have been used interchangably to mean the same thing. All are related to the general process of remodeling, but differ in degree. For the purposes of this research, the following definitions will be used.
Refurbish, update, M&R (maintenance and repair):
Normal cycle of building maintenance and repair or cosmetic changes to accommodate a new tenant.
Rehabilitation, adaptive reuse:
Major changes to a building, either to save the building from decay of structure and services or to extensively modify the building for another
use.
Rebuild:
To keep the existing shell and then build a new structure and services behind. Most typically. this is done where the building is of historical significance or is in an historical zone of a city.
Preservation, renovation:
To restore an historic building to its original state.
Remodel, modernize:
All inclusive terms used to describe any of the above.
Much of the information and direction for this research came from interviews with architects, engineers and developers. The interviews with developers were particularly enlightening because of their general concern to reduce initial construction costs and operating costs, but not to an extent that the final project would be unacceptable to potential tenants. In other words. developers want to end up with "Class A" space at the lowest cost. Class A space is defined by Robert Walsh, of Walsh and Associates, as rentable office space with the same qualities and amenities as are present in new construction. These characteristics would include such things as good location, modern communications capacity, an esthetically pleasing environment and comfortable working conditions. Comfortable working conditions include the thermal, visual, and acoustic comfort of
The most obvious difference between new and remodeled buildings is that in a remodeling job a building exists. All of the people interviewed agreed on the importance of predesign analysis to discover potential problems and identify possible opportunities in the building redesign. Predesign analysis is especially important for determining the energy strategy of the remodeled building. This is because many architects and engineers do not have a good intuitive sense about building energy performance. In 1981, the Solar Energy Research Institute (SERI)
tested 250 architects and engineers on their understanding of the energy needs of a conventional commercial building. From that study, they concluded that "neither a clear perception nor a common misperception of the energy needs of this building was revealed from the questionnares... Architects and engineers do not yet have the intuitive sense or experience about energy issues in commercial buildings that they have for other elements of design...Until experience and knowledge is gained in this area, a clear process or method must be used to identify energy related problem solving issues."' Part of the process referred to
by SERI is obviously the interpretation of information. Many computer programs
are available to give various types of energy information for the purpose of predesign or conceptual design analysis. The problem with currently available computer programs is with the way in which the information is given to the designer. Popular programs. such as DOE.2, ASEAM and BLAST, produce a multitude of confusing numerical tables and equally confusing graphics such as bar and pie charts. These programs are useful for detailed energy performance prediction, but not for conceptual design.
Stephen Ternoey et al., The Design of Energy Responsive Buildings, Preliminary report, Golden, Colorado: Solar Energy Research Institute, 1983, p.
Graphic displays proposed here are based on a computer graphic semiotic developed as part of this research. A computer program, named SAGE, was
designed as a prototype to demonstrate the appropriateness of using the semiotic for displaying building thermal performance information during conceptual design.
SAGE is an acronym for Semiotic Adducting Graphics and Energy. Webster's
Dictionary defines "sage" as "wisdom through reflection and experience". Proper interpretation of the displays depends on the designer's "reflection and experience".
In this sense. SAGE does not give any specific answers. Rather, it visually displays information so that the designer can make decisions without having to spend a great deal of time sorting out detailed numerical tables or confusing bar and pie charts. Realistically, there are so many issues involved in the design of a building other than those associated with energy use that few, if any, designers spend the time needed to interpret an overly detailed or confusing analysis. This is especially true during conceptual design. The emphasis is on identifying important issues and their relationships rather than on finding specific answers to ill-defined problems. It is the intention of SAGE to fulfill the need for easily interpretted computer graphic displays to enable designers to identify these key relationships.
REMODELING
TREND
Three interelated but distinct trends in remodeling have emerged over the
last fifteen to twenty years.
MAINTENANCE AND REPAIR
Trend for the entire construction industry
In an analysis of economic trends of the construction industry from 1965
to 1980,1 Patrick MacAuley documented the growth of maintenance and repair
compared to that of new construction. There was a growth of 230% in M&R compared with a growth of 130% for new construction. It should be noted that the government did not keep figures on alterations and additions until 1982. These figures were included in new construction. This fact strengthens the argument that the overall remodeling industry has become a significant part of the construction industry.
Trend for nonresidential construction
In the most current Census of Construction taken by the U.S. Department of Commerce in 1982, alterations, additions and maintenance and repair comprised
27% of the total non-residential construction sector.2 Office buildings comprised 47% of this total. This represents a market of over four billion dollars in office remodeling. Banks and other financial institutions are included in these figures as being "offices".
Patrick MacAuley, "Economic Trends in the Construction Industry", Construction Review, May/June 1981.
2 United States, Dept. of Commerce, 1982 Census of the Construction
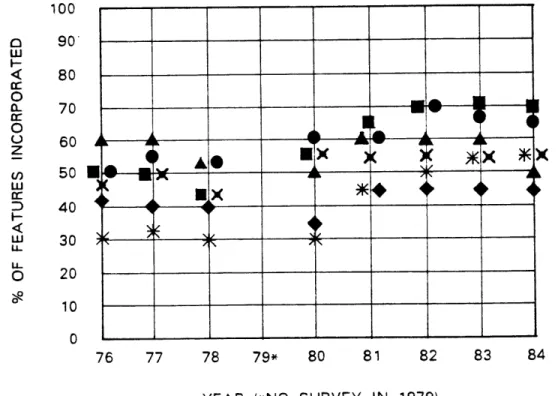
An analysis of surveys conducted annually since 1971 by Buildings magazine reveals a consistent market for all types of remodeling." Buildings is
a magazine directed towards owners, developers and managers of income producing real estate. Figure 1 shows the percent of owners/developers involved in remodeling from 1976 to 1984 based on the yearly surveys by Buildings magazine. (D Z -l O 0 LU M -~ 0
Z
cr U-0 > 0 100 90 80 70 60 50 40 30 20 10 0 76 77 78 79* 80 81 82 83 84YEAR OF SURVEY (*NO SURVEY IN 1979)
Figure 1: Owners and developers involved in remodeling.
The significance of the consistent market for remodeling lies in the fact that the market was well established before the tax incentive acts of 1976 and
1981. Due to economic and market conditions, such as the recession following
the 1973 energy crisis and the high cost of financing new construction, owners and developers often opted for remodeling existing buildings rather than build
new ones.
HISTORIC PRESERVATION
There was a rise in public concern for conservation of our nation's
natural resources and preservation of our heritage in the 1960's. One outgrowth
of this phenomenon was the passage of the Preservation Act of 1966 to establish a National Register of Historic Places.
Congress passed the Tax Reform Act of 1976 to encourage the preservation of historic commercial and income producing buildings by allowing more favorable tax treatment for these projects than in the past. The 1978 Revenue Act modified the 1976 Act to include buildings and their structures. A
10% tax credit was allowed for certified rehabilitation of a certified historical
building. A certified building is one listed in the National Register, located in a National Register Historical District or located in a state or local historic district. Further, the building must be a commercial or income producing property subject to depreciation.A rehabilitation qualifies if it meets the standards established by the Secretary of the Interior. Essentially, it must be consistent with the original architectural character of the building or district.
The tax acts of 1976 and 1978 provided a viable economic means to save many historic buildings from destruction. More importantly, the success of these projects indicated the acceptance, and even desire, of commercial tenants to be located in a remodeled building as long as the services and amenities were up to market standards.
REMODELING AS AN INVESTMENT OPPORTUNITY
The Economic Recovery Tax Act of 1981 simplified and enhanced the previous tax laws concerning rehabilitation. The tax law now provides tax credit for non historic older buildings and increases the tax credit for certified historic buildings. A 15% credit for structures at least 30 years old is now allowed. Similarly, a 20% credit is allowed for structures at least 40 years old and 25% for certified historic structures.
The current tax law eliminates the previous bias for new construction over rehabilitation. Previously, while the depreciation schedule for both new and existing buildings was based on the useful life of the building, new construction could use an accelerated depreciation schedule whereas rehabilitation had to use a straight line method. The significance of this is that when the time value of money is considered. the accelerated depreciation is almost always of greater benefit to the investor.
Currently, the methods of cost recovery and recovery periods are the same for new and existing property. Salvage value is not considered and the investor may recover the full amount of the investment cost. Further, the recovery period has been changed from the useful life of the building to a determined period. The period is 15 years for real property.
Existing buildings qualify for the current tax credit if they are "substantially" rehabilitated, are more than 30 years old and retain at least 75% of their existing walls. Historical buildings qualify as before.
The change in the tax laws make investment in real estate more attractive for new construction as well as rehabilitation. By equalizing the methods of
recovery, the tax credit clearly favors qualified rehabilitation. Even if the current proposals for tax simplification remove the tax credits, rehabilitation would not suffer from the same bias as before. The feasibility of tearing down a building to construct a new one as opposed to rehabilitating the existing building would be based on the economic merits of both proposals. The economic merits would be based on genuine yield on the investment rather than
tax writeoffs. This assumes, of course, that the revised tax code would treat new and remodeled construction in the equal manner it does now. If the goal is
truly tax "simplification", it would not make sense to revert to the old, more "complex", method. In the past, it was almost a given that demolition and new construction was the most viable alternative. Today, the story has changed.
DECISIONS
TO
It seems there are as many reasons to remodel a building as there are buildings. In the course of this research, many designers and developers were interviewed. From those discussions, and a review of published articles on the subject of remodeling, several predominant reasons were consistently cited.
REASONS FOR REMODELING
Change of function or need for additional space
The most common area for rehabilitation is in the heart of American cities such as Baltimore and Boston. Buildings from the city's industrial past are being transformed to house modern businesses and their employees. As our society is adapting to an Information Age, so are our buildings.
The location and structural integrity of these buildings is the reason they are considered for remodeling. If they are in an historical zone or are themselves of historical significance, remodeling them for a change in use may be the only way developers can take advantage of their prime location. Local design review boards and citizens groups are very keen on maintaining the character of their cities.
Market demand for quality space
Standards of comfort have improved throughout the years. Buildings 30 years and older were built before the advent of air conditioning. To be competitive, remodeled buildings must provide the same level of comfort as new buildings. Today's building technology must be compatible with today's office technology. The advancement of office communications and data processing make it necessary to upgrade building electrical and communication services.
Reduce building energy costs
A typical arrangement between the building owner and tenant is to have
the tenant pay for electrical usage and the owner pay for heating, cooling and
common services such as elevators. It is in the best interests of both tenant and
owner to reduce energy costs. In the case where the owner pays for all energy
costs there is even greater incentive. The owner can not pass the costs directly
to the tenant without effectively raising the rent. According to Hank Spaulding
of Spaulding and Slye, real estate developers and owners in Boston, tenants are
well aware of the total costs to them for renting office space. In the case
where the tenants pay for all the energy costs of their space, the situation
remains the same. Again, the tenant considers all costs incurred to rent the
space.
Comply with current building codes
Building codes are always a consideration when the decision to remodel
has been made. Code compliance can also be the primary reason for remodeling.
Insurance premiums are based on the quality of health and safety
measures incorporated in the building.
Revised
fire codes necessitate
the
upgrading of fire protection systems and means of egress in many older
buildings.
Historic preservation
Governmental support through grants and tax incentives made possible the
preservation of historical buildings throughout the country. The resistance to
preserve buildings because of economic constraints was lessened. Thus, the
economic issue was made secondary to the desire to preserve part of our
nation's architectural and cultural heritage.
ALTERNATIVES OF THE OWNER/DEVELOPER
Three possible scenarios occur when the need for new space or remodeled
space arises. Figure 2 outlines these decision paths. Even though each path is
shown as a linear relationship, the actual decision process could loop back to
any previous step and repeat a portion of the process.
Case 1: A building exists and the need is to upgrade it.
Demolition and new construction are not considered. A predesign analysis
is made to determine the extent of the upgrade. The appropriateness of the
building shape for the proposed use, the condition of the structure and services.
and potential code violations are determined at this point. If the upgrade is
considered feasible after the predesign analysis, a design concept is proposed and
construction costs are estimated. The design is then implimented or reevaluated.
Case 2: No building exists on a site and the need is to build a new
structure.
The typical design process ensues and the building is either built or the
project is dropped based on the financial analysis.
Case 3: A building exists. The need is for new or altered
space.The decision is whether to rehabilitate the existing building or to tear it
down and build new. The most significant difference between this scenario and
the other two is the absolute necessity of a predesign analysis. A determination
must be made as to the appropriateness of the existing building to the required
use. (see "Design and Remodeling") A preliminary estimate can then be made to
compare the costs of demolition and new construction with that of rehabilitation.
A financial analysis then determines the economic feasibility of either project.
REMODEL DESIGN CONCEPT DECISION REJECT PROJECT REMODEL
K
PREDESIGN ANALYSIS FCASE 2 EXISTING BUILD ING DEMO AND BUILD NEW DESIGN CONCEPT I-Uw CJ) 0-DESIGN CONCEPT DESIGN AND BUILD NEW DESIGN CONCEPT DECISION REJECT PROJECT CASE 1 PREDESIGN EXISTINGANALYSIS BUILDINGFigure 3: United Shoe Machinery Co. building. Elevation and detail.
Beyond economics
The decision to proceed with any project may be based on factors other
than strictly financial. An example of this is the remodeling of the United Shoe
Machinery Co. building in Boston (Figure 3).
In terms of the financial feasibility of the project, the most economic
decision would have been to tear the building down and build new."
The
building, however, was considered a unique landmark by the city and preservationist
groups. It was determined by the developers, Meridith & Grew, that merely
rehabilitating the building would not be financially viable. Rather than abandon
Anthony J. Yudis, "United Shoe Building restoration goes before board
Thursday",
The Boston Globe,
11, November 1984.
the project, the developers purchased options on adjoining properties and proposed an new office tower on these lots in addition to the rehabilitation of the United Shoe building. This approach is acceptable to the city and makes the project economically worthwhile for the developers.
DESIGN
AND
REMODELING
The design process for a remodeled building is different than that for new construction. In the design of a new building, the design process is to take a building program and determine the needed space. In a remodeled building, the process is to take a building program and fit it within a space. The existing building must be evaluated before any design work begins. On site inspections are necessary because of the typical lack of complete building plans. Even with original drawings, inspection is required to assure their accuracy. Several questions must be asked and addressed before any design proposals may be
made.
QUESTIONS TO BE ANSWERED
Is the floor space and building shape compatible with the design program ?
Two building shapes are most common in office remodels.' Buildings built between 1860 and 1930 as office space are typically E,L,H shape or a combination of these shapes. They were designed before air conditioning and therefore have a wall to area ratio consistent with natural daylighting and ventilation. The wings are approximately 30 to 40 feet wide with 15 to 20 foot offices on either side of a 5 foot corridor. The service core is usually in the corner of the building. By comparison, modern buildings typically have a central service core and a width of 35 to 40 feet from the core to the wall. This difference of circulation patterns and areas makes these types of buildings difficult to remodel for large scale office use. Rather than determining the
Herbert McLaughlin, "Tips on evaluating renovation projects for office use", Architectural Record, March 1979.
optimal plan for the required use and designing the space to accommodate that plan, the designer must accommodate the use to fit the space.
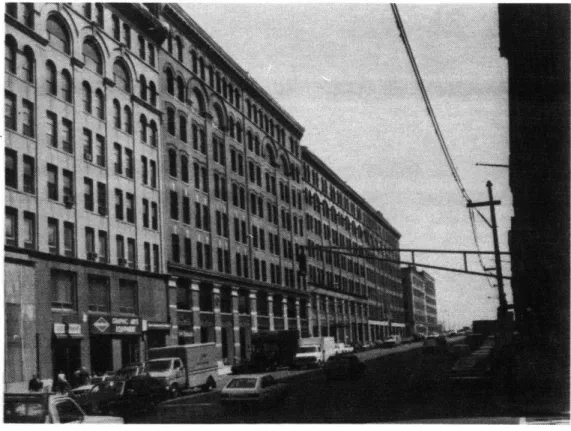
The second type of building common in remodeling is a warehouse or manufacturing plant. No matter when these buildings were constructed, they are usually rectangular in shape. Forming blocks in the heart of older cities, these buildings are typically 30 to 40 feet wide and 3 to 4 stories high (Figure 4). As with the office buildings before 1930, they pose the same problems for larger tenants.
Figure 4: Summer Street, Boston,. Massachusetts.
Warehouses or factories built on the perimeter of the city are usually bigger and more suitable to larger tenants. Widely spaced structural supports and heavy construction make these buildings popular for their adaptabilty. The small
amount of window walls have made atriums popular design features during remodeling.
What is the condition of the structure ?
The general integrity of the structure should be evaluated as well as specific loading conditions required to meet the proposed use. Because many of the buildings being remodeled today were originally warehouses and factories, floor loading is usually not a problem. If the structure is found deficient, a
desire to save the building for historical purposes is the only justification for not tearing the building down.
Just as an irregular floor plan can cause problems for planning space for people, the existing structure can cause planning problems for the building services. The ability to run services through and around the structure must be evaluated. The available space above ceilings, below floors and in structural voids is critical in the determination of the type and extent of modification that is practical to the service equipment.
What is the condition of the building services ?
Building services are defined here as the electrical, telecommunications. plumbing and HVAC systems of the building. In a building upgrade, a detailed analysis of the building services should be made. The necessary component or whole system changes can then be made.
In a rehabilitation, the first decision is whether or not the systems should
be replaced entirely. The life of the building services is less than the life of
the building structure. The older the building is, the more likely it is that the systems should be replaced.
COMBINING THE OLD WITH THE NEW
The esthetic decision in remodeling is unique for the architect. The
existing architecture may dictate the styling and detailing of the remodel. This is
the case in a restoration. The existing architecture may be combined with a
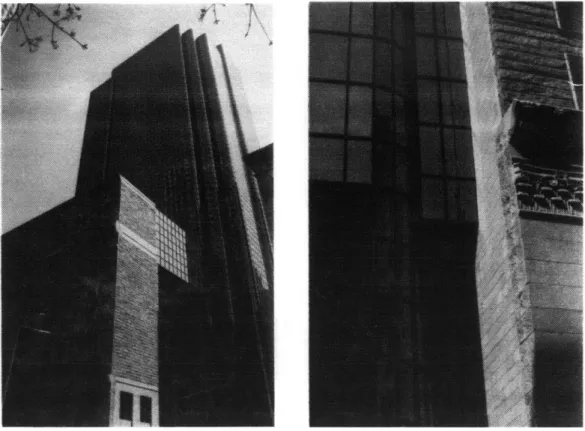
modern esthetic. An example of this is Exchange Place in Boston (Figure 5).
The existing building was remodeled and connected to a new 40 story office
tower with an atrium. Finally, the existing architecture may be totally eliminated
by the new style. This approach was popular in the 1950's before the historic
preservation movement. Many buildings were "modernized" by wrapping their
exterior with glass and aluminum. The transition from new to old is one of the
most difficult, and exciting, challenges the architect will face in a remodeling
project.
The construction process is different from new construction because of
the need to interface the old with the new and because of the uncertainty of
hidden construction details in the building. Every attempt should be made to
organize the work so that the construction process is as normal as possible. Ezra
Ehrenkrantz, New York architect, said "The goal is to determine what is needed
to "normalize" the construction process, using conventional methods and materials
as much as possible, within the nature of the existing fabric of the building."'
COMPLIANCE WITH BUILDING CODES
In 1979, Massachusetts added Article 22 to its state building code. Article
22 specifically deals with the repair. alteration, addition and change of use of
existing buildings. Until this time, no distinction was made between remodeled
Figure 5: Exchange Place, view from State street and detail.
buildings and new construction. The state recognized the need for flexibility in
the code when strict compliance is impractical. Essentially, compliance alternatives
are acceptable as long as the alternative does not undermine the intent of the code. The intent of the code is to insure public safety, health and general welfare. The Massachusetts code is being studied by other states for use as a
model for their own code revisions. Several states have already adopted similar codes.
Because of the flexibility of the code, the state has placed a great deal of responsibilty with the building officials. Any proposed alternatives must be approved by the building officials but they have the authority to accept building
construction in remodeled buildings that would not be accepted in new construction.
In the conversion of a shoe factory to apartments, New York architect
Stephen B. Jacobs provides an example where where the revised code was used.
The building was built with exposed cast iron structural columns. A strict
interpretation of the code would require that the columns be enclosed for fire
protection. A variance was obtained to leave the columns exposed. The reason
for granting the variance was that the cast iron would be more severely damaged
by heat build up within an enclosure than it would be exposed. The alternative
solution achieved the desired architectural effect of exposing the unusual columns. It also complied with the intent of the code to maintain the highest degree of public safety given the circumstances. Jacobs said "without this and some other variances, the recycling would have been impossible, both financially and structurally."
Highlights of the Massachusetts code
A building must be legally occupied for at least five years to be
considered under these provisions as an existing building.
The building must be evaluated for compliance with the code and any proposed code alternatives must be submitted to the building official. This requirement again emphasizes the need for predesign analysis. In this case it is not only a good idea. it is the law.
If the proposed remodel changes the use of the building to a higher
"hazard index", the remodel must conform to the code for new construction. In the Massachusetts code, the higher the number is for the hazard index, the greater the perceived hazard is for the building type. Businesses have a hazard index of 2, while factories and industrial buildings have an index of 3 and above. Therefore, remodeling for office use is usually not a problem in this regard. In fact, converting old factory buildings is often advantageous because of
the higher structural loads demanded for equipment and machinery when these
buildings were originally designed.
New additions must comply with the code for new construction. Alterations and repairs to existing structures are the only circumstances for which Article 22 may be used. Alterations in this case would correspond to the definition of rehabilitation used in this research.
New building systems must conform to the fullest extent practical. Building systems are defined in the code as "any mechanical, structural, egress, electrical, plumbing, building enclosure and/or fire protection system or fire resistive construction system or any portion thereof."'
Conformance to the state code is not limited to construction practices. The energy code, Article 20, must also be complied with. Again, the state makes allowances for remodeled buildings.
Massachusetts, State Building Code Commission, Building Code, Article 22, Section 2201.1.
Similar to safety and health requirements, if the building is to be remodeled for a use with a higher hazard index, the building must conform to codes for new construction.
New additions must comply with the energy code for new construction.
If any component -of the building is altered, that component must meet the
energy code for new construction. Components are defined as walls, windows, doors, roofs or mechanical systems. If only a part of a particular component or
system is altered, only the portion that is changed must meet the current code.
Design opportunities from the problems of remodeling
Because of the complexity of remodeling, it is easy to think only of the
problems involved. Many designers and developers will invariably ask "Why bother?". The problems of remodeling also present tremendous opportunities to inventive designers. The unusual shapes and odd details that make the design problem difficult to solve are the very elements that can lead to unique and exciting architectural solutions. Research suggests that "good" architecture is an important attribute in the determination of market demand for office space.' Therefore, a well designed remodeled building can embody architectural merit and market appeal.
Douglas E. Hough, "Can 'Good' Architecture Meet the Market Test ?", Journal of Urban Economics, Vol. 12, No. 1, 1983.
ENERGY
AND
REMODELING
The reasons for remodeling given previously were not necessarily based on energy concerns. However, any decision to remodel will necessarily prompt an examination of the building's energy use and its energy systems. The reasons to remodel are examined again here specifically with respect to energy issues.
REASONS FOR REMODELING REEXAMINED Change in function or need for additional space
A change from a factory or any other type of space to office use changes the demands on the building energy systems. Even if the systems are in excellent condition, the appropriateness of the system to the new use would have to be examined.
If an addition is proposed for an existing office building, the loads on the current systems must be examined to determine if they can be extended with the structure.
Market demand for quality space
Quality space implies comfortable working conditions. Physical comfort can only be achieved when consideration is given to the thermal, acoustical and visual environment. Comfort should not be confused with luxury. As many decisions in remodeling are based on economics. luxury may be considered an unnecessary excess. Comfortable working conditions should be considered as a means of improving employee morale and productivity.
Comply with current codes
As discussed before, current energy codes must be complied with just as safety and health codes.
Reduce building energy costs
The desire to reduce building energy costs is evident in an analysis of the Buildings magazine surveys referenced above. As shown in Figure 6, "energy conserving features" are incorporated in a significant percent of the
buildings being remodeled. The most common features currently included are updating the HVAC system and adding insulation. These are followed by installing an energy management control system, replacing windows and improving the lighting system. Of lowest priority, but still included in an impressive 40%
of the projects, is reroofing.
- - -- -
-
-78 79* 80 81 82 83 84
YEAR (*NO SURVEY IN 1979)
SURVEY QUESTION: WHICH OF THESE ENERGY CONSERVING FEATURES WILL BE INCORPORATED IN YOUR MODERNIZATION PLANS ?
* UPDATE HVAC
0
INSULATION A RELIGHT * REROOFK ENERGY MANAGEMENT CONTROL SYSTEM X NEW WINDOWS
Figure 6: Response to Buildings' survey with regard to what energy conserving features their readers include in a remodel.
0 o < 0 0c 0
(n
C> O"
I-0
100 90' 80 70 60 50 40 30 20 10 0 76 77 tK
4
4
01%COST OF ENERGY SYSTEMS
Significance of building energy systems
The building energy systems represent a substantial and significant portion
of the total cost of remodeling. The useful life of the structure typically
exceeds the life of the building services. A general assumption is that the
building services will have to be replaced at least once during the life of the
building. Because of this, the replacement of the services is often the most
significant aspect of a remodeling project.
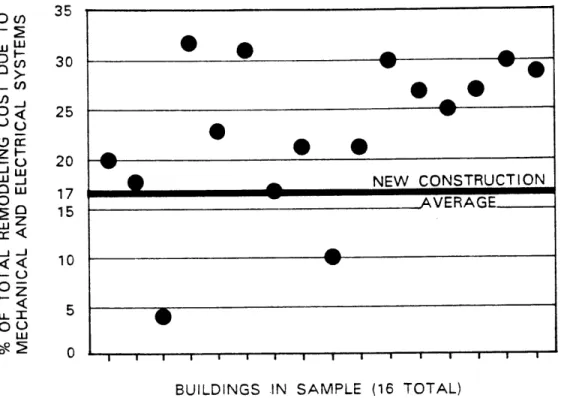
To exemplify this point, sixteen buildings remodeled for office space were studied. The relationship between the building's total cost versus cost of mechanical and electrical systems is shown in Figure 7. The inclusion of a building in this study is random in the sense that the only requirements are that the building be remodeled for office use' and adequate construction cost information was provided. All of the buildings were built between 1979 and 1984. The location of the buildings range from California to Massachusetts.
Sixteen buildings is too small a sample to make any specific conclusions. However, the overall significance of the mechanical and electrical systems to remodeling is apparent when comparing the same relationship of new construction. New construction figures were averaged from the "1985 Dodge Construction Systems Costs" by McGraw Hill and the "1984 Means Systems Costs" by Robert Means Co. Inc.. All but two of the buildings have a higher percentage of the total cost associated with the mechanical and electrical systems in remodeling compared with new construction. The average cost of the systems is 25% of total construction in the remodeled buildings compared with 17% for new construction.
O
Wn
35 0(1) WHW 30 O N 25 01) 20W Aft NEW CONSTRUCTION
17
0
_ _ __15AVERAGF 5Q 15 wz<
10
O 00z 0 L ) ..BUILDINGS IN SAMPLE (16 TOTAL)
Figure 7: Total remodeling cost versus cost of mechanical and electrical systems.
It can be concluded that the cost of these systems will have a significant impact on the initial cost of a remodeling project. Further, the significance is even greater in a remodeled building than it is in new construction.
Consumption and Demand
It is necessary to understand the difference between energy "consumption" and "demand" and their relationship to energy cost and total remodeling cost.
Consumption is the amount of energy used over a given time period. In the United States it is usually expressed in terms of kilowatt hours (KWH) or British Thermal Units per hour' (BTU/hr). Demand is the peak rate of
consumption. It is usually determined by integrating the rate of consumption over a 15 or 30 minute time period. It is expressed in terms of KW or BTU's.
It is typical for utility companies to measure both the consumption and demand. Then base the bill on the demand. This is a very significant fact. For example, suppose a business consumes and demands consistently little energy for most of the month. Then one day their demand is especially high during an hour in the afternoon but their total consumption stays the same. The entire
month's bill may be based on the peak demand of that one hour even though their consumption was no different that day than any other.
A significant reduction in peak demand will reduce initial construction
costs. Building energy systems are designed to handle peak loading conditions. If there is a significant reduction in peak demand, smaller and less expensive equipment could be installed. The determination of what is "significant" is important.
Every piece of mechanical equipment has a range in which it operates most efficiently. A significant reduction in peak loads would be one in which the mechanical equipment could be reduced from an efficient larger size to an efficient smaller size.
Reducing consumption does not necessarily mean a reduction in cost. A true reduction in energy cost will come from a reduction in peak demand. As explained before, the utility companies base their charges on demand. Many utility companies. especially in big cities, use a method of rate calculation called "ratcheting".
The ASHRAE 1984 Systems Handbook gives a simplified example of the ratchet billing procedure. The amount billed is determined by comparing the actual demand for the month with 85% of the highest demand over the past eleven months. Whichever amount is highest is the amount billed. Figure 8 illustrates this concept. The highest demand is 1000 KW in the August. The winter months have a demand of approximately 700 KW each. The minimum amount billed is 850 KW under the 85% ratchet described above. Therefore, even though the demand in the winter months is below 850 KW, the utility will bill for 850 KW. In the summer months where the demand is above 850 KW, the bill will be for the actual amount demanded.
1200 1000 0
z
800 600 400 0200
JAN FEB MAR APR MAY JUN JUL AUG SEP OCT NOV DEC
ACTUAL DEMAND BILLED DEMAND WITH 85% RATCHET
Emphasis on cost versus conservation
The cost of remodeling in general, and energy use in particular, has been a consistent theme of this paper thus far. Some would argue that there is a more important issue concerning energy and remodeling, that of conserving our
nation's natural resources. The two issues are in fact intertwined.
The cost of building energy use is a direct result of the cost to produce that energy. The reason utility companies charge higher rates for energy use
during certain times of the day and base their bills on peak demands is not necessarily greed, as is commonly assumed. The utility companies want to reduce
their peak loads. Just as a building can use smaller equipment by reducing peak
demand, the utility company does not have to build new power plants to meet additional peak demand.
The elimination of new power plants can be a very beneficial factor in the pursuit to conserve the nation's nonrenewable natural resources. Land is needed to build the plant and energy is used in the construction. maintenance and operation of the plant. It takes energy to make energy.
The Solar Energy Research Institute (SERI) has made a preliminary study concerning this issue. They studied 3000 commercial buildings and investigated various changes that would make the buildings more energy efficient. SERI's preliminary conclusions are that between two to three times more energy is saved, on a national level, by reducing each building's peak demand and negating the need for new power plants than by the conservation efforts incorporated into the buildings. This is indeed a remarkable conclusion, and warrants further investigation.
SERI's conclusion makes logical sense, given the previous dicsussion on peak demand. If their conclusion can be verified, a very strong case can be made for designers to concentrate on reducing a building's peak demand as opposed to reducing the building's total energy use. This strategy would conserve nonrenewable natural resources on a national scale while reducing the operating costs of individual buildings. The two concepts are one in the same, yielding benefits to all concerned.
TURNING
INFORMATION
INTO
KNOWL EDGE
It has been established that there is a desire by developers and owners to reduce energy costs and initial costs during a commercial remodel. Based on previous discussion, an understanding of the building's energy costs and peak loading conditions are important considerations in achieving these goals. The problem then is how to communicate the significance of these issues during conceptual design. It is important to provide a means by which the owner, or
final decision maker, can understand these issues as well as the designer. The successful communication of information is a means by which information is transformed into knowledge. A computer graphic semiotic, or computer imaging system, is proposed as a basis for one possible solution to this communication problem. A prototype graphic program, SAGE, was developed to demonstrate the appropriateness of the semiotic for energy analysis.
THE SEMIOTIC
The need for the semiotic
Stephen Hale, a Massachusetts architect, expressed the common belief among most designers that "architecture is a visual art". The process of architectural design is also visual. It is a natural extension of this process to use computer graphics in the exploration of building energy use during conceptual design.
Computers are fast becoming standard items in most architectural and engineering offices. A seminar was held in Boston dealing with "Building Redesign and Energy Challenges" in November of 1984. During that seminar. many architects were asked about their use of computers and their future plans for computer use. Almost without exception, the architects were using computers
for drafting. Those that did not use computers in some kind of graphic capacity
expected to in the near future.
When computers are used for any kind of energy analysis, the typical program produces a multitude of confusing numerical tables, bar and pie charts. While this output may be appropriate for a detailed anal.ysis or simulation, it is not appropriate during conceptual design. The emphasis is on identifying important issues and understanding their relationships. Typical computer graphic images fall short of satisfying this need.
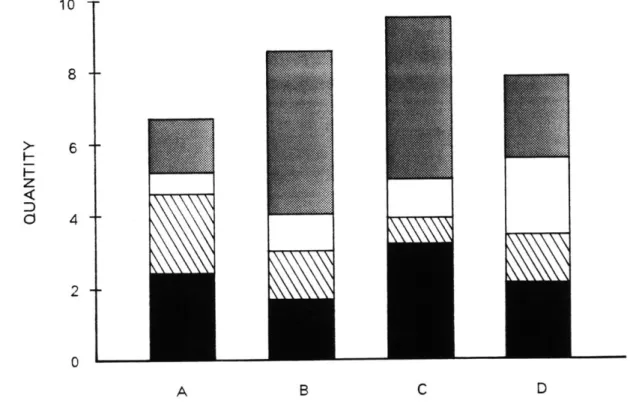
The most common computer graphic images used in energy analysis today are bar charts, pie charts and line diagrams. Bar charts are easily interpretted as long as they are not broken into components to form "stacked" bar charts
10 T 8 >-z D) 6 4 2 0 A B C D
Figure 9: Stacked bar charts
I
I
MMA
4% 5% '-30% 15% 10% 8% 20 UNITS 20 UNITS 60 UNITS
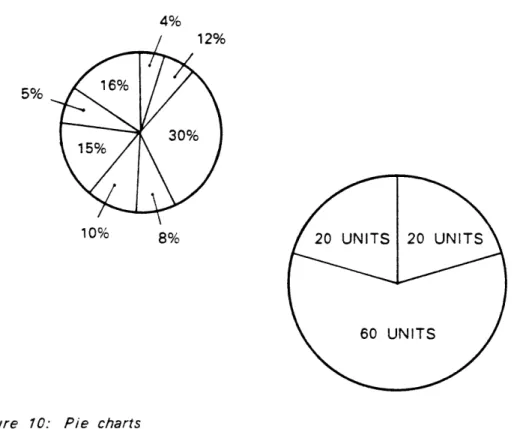
Figure 10: Pie charts
(Figure 9). Once the bar chart consists of several components, only the total quantity of the bar is easily perceptible. The components of the bar are removed from the absolute reference of the base line. Pie charts rely on the observer being able to differentiate areas of irregular shapes, the wedges of the pie. If there are only a few wedges that make up the pie, a general perception of which is largest can be made. However, there is no absolute reference in a pie chart. The actual quantity or percentage of each wedge can not be determined from the graphic. Similar to bar charts, if there are too many components that make up the pie, interpretation of the image becomes very difficult (Figure 10). Line diagrams are most useful to show a trend of some component over time. Again, too many components make the diagram confusing.
through the use of animation. This issue will be discussed in a succeeding section.
The shortcomings of typical graphic displays and their application to computers were the motivations for the proposed semiotic.
Terminology
The semiotic is a set of rules used to format quantitative information on a computer screen. The term "display" will be used to distinguish different sets
of quantitative data. In order to describe the displays of this prototype, terminology from Bertin in his book, Semiology of Graphics, is used.'
Invariant-The complete and invariable notion common to all the data. Component:
Variational concepts. In other words, the components are the quantities that vary and are based on the notion of the invariant.
Element:
Divisions of the component. These are the quantities that combine to make the component.
Subelements:
Divisions of the elements. Bertin would probably classify these as "elements", but the distinction is made for clarity.
Image:
A meaningful visual form perceptible in the minimum instant of vision.
Jacques Bertin, Semiology of Graphics, trans. William J. Berg (Madison:
Each display is based on one invariant. SAGE has three displays. Each
of the components, elements and subelements is a quantity. Each quantity
comprises a separate image.
Rules of the semiotic
1. Each image is a regular polygon. The determination of the the number of vertices, and thus the polygon, is based on the greater of two
conditions: the number of elements comprising a component or the number of subelements comprising an element plus one. SAGE uses squares (see Figures 16
through 24), but a display is not limited to squares (Figures 11 and 12).
A
5
Figure 11: Example of the triangle as the base polygon in the semiotic.
2. Once the polygon has been determined, it will be used consistently throughout the display. Consistency is important so that comparisons between
Figure 72: Example of the hexagon as the base polygon in the semiotic.
images may be easily made. The relative sizes of the different images represent the relative quantities. The larger the size, the larger the quantity. The actual area of one image, however, has no meaningful relationship to another image.
3. Each image must have a similar central metric (Figure 13). The central metric is a common reference between images. It serves the same purpose as the "0" point in a Cartesian coordinate system. The central metric also insures the independence of each image. Each image is complete within
itself and needs no other reference to be interpreted.
4. Each successive ring of an image represents an absolute quantity. The quantity of each ring is arbitrary, but must be consistent throughout the display. Each ring is separated with a grid line (Figure 13). The total quantity of an
GRAPHIC INDICATION OF QUANTITY GRIDS, BETWEEN EACH RING
-CENTRAL METRIC WITH NUMERIC INDICATION OF QUANTITY
RING
--- R-N
EACH RING 10 IN THIS EXAMPLE
Figure 13: Definitions of the various parts of an image.
image is determined by the number of rings filled solidly. If the total quantity is not evenly divisible by the quantity of a ring, the last ring will be partially filled. A grid line will complete the image to indicate where the ring would have ended had it been totally filled. The quantity of the image -may also be
determined from the numerical value located in the middle of the central metric.
5. If the quantity of an image is zero, only the central metric will be represented (Figure 12).
6. Color will only be used to distinguish between different components
or elements. The use of color is not necessary, but does help to visually
7. If two or more images extend from the vertices of another image, the
sum of those images equals the total of the image from which they extend. If one image represents a positive quantity and the other represents a negative quantity, the total will be the net sum. The color of the net sum will be that of the larger of the positive or negative quantity. The graphical tonal value of the net sum will be of a lesser degree than the tonal value of the larger of the positive or negative quantity (Figure 14).
POSITIVE QUANTITY NET (POSITIVE) NEGATIVE QUANTITY
Figure 14: Example of a net quantity between two images. The middle square is the net of the sum of the two images extending from its vertices.
8. If two images do not touch, they are independent quantities (Figure
Figure 15: Four independent quantities. No image is a component of another.
SAGE
SAGE is the prototype computer program developed as part of this
research to demonstrate the appropriateness of the semiotic. As discussed in the introduction to this research, SAGE is an acronym for "Semiotic Adducting Graphics and Energy".
The graphic program
Quantities for each image are calculated using Lotus 123, a spreadsheet program by Lotus Development Company. The information from Lotus is linked to SAGE and translated into the displays based on the semiotic. The code for the SAGE was written in "C". a programming language developed at Bell Labs.
The Lotus spreadsheet used and the source code for SAGE are listed in
the Appendix.
Lotus was used for two reasons. First, it is a very popular spreadsheet program that many designers already have. The displays presented here may therefore be immediately used. Secondly, the emphasis of this research is on the semiotic and the displays - themselves rather than on a particular calculation
method. Lotus was used to calculate the loads and costs using a simple degree
day method.
Emphasis was given to the displays because as computers continue to become faster, increase storage, and become able to easily share information, more sophisticated computation will become readily available. What will not change is the need for users to interpret the results of the computer's computations.
Discription of the displays
The first display is comprised of the following: Invariant: cost of energy per square foot.
Components: spring, summer, fall and winter seasons and yearly total. Elements: heating, cooling, lighting and equipment.
Subelements: peak demand -and energy consumption.
An example of the first display is shown in Figures 16. through 19. Figure 16 shows the cost of energy for all the seasons. In. this example, the designer has chosen to look at the cost of energy for the spring season more closely. All the seasons are erased from the screen and the total cost for spring is displayed (Figure 17). Expanding the image reveals the different components
that make up the total spring energy cost (Figure 18). A final expansion reveals the cost of consumption and demand that comprise the cost of each of the components. In this manner, the designer can look at any level of detail he desires.
The second display is comprised of the following:
Invariant- Summer peak loads expressed in terms of BTU/hr.
Components: North, east, south, west and core building zones, and total building load.
Elements: Natural loads and mechanical loads.
Subelements of natural loads: People, solar gain and envelope conduction.
Subelements of mechanical loads: lighting and equipment.
The second display is exemplified in Figures 20 through 23. Similar to the first display, all the zones are shown together. A selection to examine the south zone brings up Figure 21. Figure 21 represents the peak summer load in
1000 BTU/hr for the south zone. Expanding this image yields the components
that comprise the total loads (Figure 22). In this case, the components are the loads associated with natural causes and those with mechanical causes. Compare Figure 22 with Figure 14. Note that the displays are similar. The difference lies in the fact that the graphic tonal values of Figure 22 are all the same. Figure 14 has two distinct tonal values. The central image in Figure 22 represents the sum of its two component images. While the central image in Figure 14 also represents the sum of its components, one component is positive and the other is negative. Therefore, it is necessary to make the graphic distinction between positive and negative quantities in order for the display to be interpretted correctly.