HAL Id: hal-00297893
https://hal.archives-ouvertes.fr/hal-00297893
Submitted on 10 May 2007HAL is a multi-disciplinary open access
archive for the deposit and dissemination of sci-entific research documents, whether they are pub-lished or not. The documents may come from teaching and research institutions in France or abroad, or from public or private research centers.
L’archive ouverte pluridisciplinaire HAL, est destinée au dépôt et à la diffusion de documents scientifiques de niveau recherche, publiés ou non, émanant des établissements d’enseignement et de recherche français ou étrangers, des laboratoires publics ou privés.
Variability of annual CO2 exchange from Dutch
Grasslands
C. M. J. Jacobs, A. F. G. Jacobs, F. C. Bosveld, D. M. D. Hendriks, A.
Hensen, P. S. Kroon, E. J. Moors, L. Nol, A. Schrier-Uijl, E. M. Veenendaal
To cite this version:
C. M. J. Jacobs, A. F. G. Jacobs, F. C. Bosveld, D. M. D. Hendriks, A. Hensen, et al.. Variability of annual CO2 exchange from Dutch Grasslands. Biogeosciences Discussions, European Geosciences Union, 2007, 4 (3), pp.1499-1534. �hal-00297893�
BGD
4, 1499–1534, 2007 Variability of annual CO2 exchange from Dutch Grasslands C. M. J. Jacobs et al. Title Page Abstract Introduction Conclusions References Tables Figures ◭ ◮ ◭ ◮ Back CloseFull Screen / Esc
Printer-friendly Version Interactive Discussion
EGU
Biogeosciences Discuss., 4, 1499–1534, 2007 www.biogeosciences-discuss.net/4/1499/2007/ © Author(s) 2007. This work is licensed
under a Creative Commons License.
Biogeosciences Discussions
Biogeosciences Discussions is the access reviewed discussion forum of Biogeosciences
Variability of annual CO
2
exchange from
Dutch Grasslands
C. M. J. Jacobs1, A. F. G. Jacobs2, F. C. Bosveld3, D. M. D. Hendriks4, A. Hensen5, P. S. Kroon5, E. J. Moors1, L. Nol1, A. Schrier-Uijl6, and E. M. Veenendaal6
1
Alterra, P.O. Box 47, 6700 AA Wageningen, The Netherlands
2
Wageningen University, Meteorology and Air Quality Group, P.O. Box 47, 6700 AA Wageningen, The Netherlands
3
KNMI, P.O. Box 201, 3730 AE De Bilt, The Netherlands
4
Free University, De Boelelaan 1085, 1081 HV Amsterdam, The Netherlands
5
ECN, Westerduinweg 3, 1755 LE Petten, The Netherlands
6
Wageningen University, Nature Conservation and Plant Ecology Group, P.O. Box 47, 6700 AA Wageningen, The Netherlands
Received: 5 April 2007 – Accepted: 16 April 2007 – Published: 10 May 2007 Correspondence to: C. M. J. Jacobs ([email protected])
BGD
4, 1499–1534, 2007 Variability of annual CO2 exchange from Dutch Grasslands C. M. J. Jacobs et al. Title Page Abstract Introduction Conclusions References Tables Figures ◭ ◮ ◭ ◮ Back CloseFull Screen / Esc
Printer-friendly Version Interactive Discussion
EGU
Abstract
An intercomparison is made of the Net Ecosystem Exchange of CO2, NEE, for eight
Dutch grassland sites; four natural grasslands, two production grasslands and two me-teorological stations within a rotational grassland region. At all sites the NEE was determined during at least 10 months per site, using the eddy-covariance (EC)
tech-5
nique, but in different years. The photosynthesis-light response analysis technique is used along with the respiration-temperature response technique to partition NEE among Gross Primary Production (GPP) and Ecosystem Respiration (Re) and to ob-tain the eco-physiological characteristics of the sites at the field scale. Annual sums of
NEE, GPP and Re are then estimated using the fitted response curves with observed
10
radiation and air temperature from a meteorological site in the centre of The Nether-lands as drivers. These calculations are carried out for four years (2002–2005). The estimated annual Refor all individual sites is more or less constant per site and the av-erage for all sites amounts to 1390±30 gC m2a−1. The narrow uncertainty band (±2%) reflects the small differences in the mean annual air temperature. The mean annual
15
GPP was estimated to be 1325 g C m−2a−1, and displays a much higher standard de-viation, of ±100 gC m−2a−1(8%), which reflects the relatively large variation in annual solar radiation. The mean annual NEE amounts to –65±85 gC m−2a−1, which implies that on average the grasslands act as a source, with a relatively large standard devia-tion. From two sites, four-year records of CO2flux were available and analyzed (2002–
20
2005). Using the weather record of 2005 with optimizations from the other years, stan-dard deviation of annual GPP was estimated to be 171–206 gC m−2a−1 (8–14%), of annual Re 227–247 gC m−2a−1 (14–16%) and of annual NEE 176–276 gC m−2a−1. The inter-site standard deviation was higher for GPP and Re, 534 gC m
−2
a−1(37.3%) and 486 gC m−2a−1 (34.8%), respectively. However, the inter-site standard deviation
25
of NEE was similar to the interannual one, amounting to 207 gC m−2a−1. Large differ-ences occur due to soil type. The grasslands on organic (peat) soils show a mean net release of CO2of 220±90 g C m
−2
BGD
4, 1499–1534, 2007 Variability of annual CO2 exchange from Dutch Grasslands C. M. J. Jacobs et al. Title Page Abstract Introduction Conclusions References Tables Figures ◭ ◮ ◭ ◮ Back CloseFull Screen / Esc
Printer-friendly Version Interactive Discussion
EGU
soils show a mean net uptake of CO2 of 90±90 g C m −2
a−1. If a weighing with the fraction of grassland on organic (20%) and mineral soils (80%) is applied, an average
NEE of 28±90 g C m−2a−1 is found, which means that on average the Dutch grass-lands behave like a small sink for CO2. The results from the analysis illustrate the need
for regionally specific and spatially explicit CO2emission estimates from grassland.
5
1 Introduction
Grasslands cover about 20% of the world’s land area (Hadley, 1993) and about 22% of the EU-25 land area (EEA, 2005). They not only constitute an important socio-economic and environmental resource, but they also affect the atmospheric energy, water and carbon budgets. As such, grassland areas contribute significantly to the
10
terrestrial greenhouse gas (GHG) balance (Soussana et al., 2007b). Thus, realis-tic estimates of greenhouse gas budgets require reliable estimates of emissions from grasslands. Currently, it is suggested that grasslands demonstrate the same CO2
ac-cumulation rates as forests (Hu et al., 2001). If this is correct on a long-term basis, this is of great interest in light of the discussions on global warming. For these reasons
15
and because of the relatively unexplored potential for grassland soils to store carbon the interest in the carbon cycles of these ecosystems has increased (Van Ginkel et al., 1999; Soussana et al., 2007b).
In national inventory reports such as required under the Kyoto Protocol by the United Nations Framework Convention on Climate Change (UNFCCC) all grasslands are
usu-20
ally shared under one so-called source/removal category with one emission factor (IPCC, 2003). Similarly, in global or regional carbon budget models land cover is often prescribed in terms of biomes such as “temperate grassland” with only one set of vege-tation parameters (see, e.g., Friedlingstein et al., 2006). However, even within relatively small regions with uniform climatic conditions large variability in emissions from
grass-25
lands may be expected due to differences in soil type and water- and land-management practice (Ammann et al., 2007; Gilmanov et al., 2007; Soussana et al., 2007a). In order
BGD
4, 1499–1534, 2007 Variability of annual CO2 exchange from Dutch Grasslands C. M. J. Jacobs et al. Title Page Abstract Introduction Conclusions References Tables Figures ◭ ◮ ◭ ◮ Back CloseFull Screen / Esc
Printer-friendly Version Interactive Discussion
EGU
to obtain more realistic GHG balance estimates and proper uncertainty assessments differences in grassland emission factors depending upon such influences should be accounted for.
Emission variability analysis requires continuous observations of GHG exchange during prolonged periods of time and for various sites to address both spatial as well
5
as temporal variability of emission factors. Thanks to the gradually increasing number of sites with long-term flux observations based on the eddy covariance (EC) technique (Baldocchi et al, 2001) such analyses are now within reach for carbon dioxide (CO2).
The large variability of CO2 exchange of grasslands has recently been investigated
on a European scale by Gilmanov et al. (2007). These authors compared data from
10
20 European grasslands, covering a large range of ecophysiological and climatic con-ditions. Their datasets each represent 1–2 years of flux observations. Annual net ecosystem CO2exchange (NEE) was found to vary between net uptake of 655 gC m
−2
and a release of 164 gC m−2. Net release was observed in 4 cases, associated with organic soils, grazing and heat stress.
15
In this paper we focus on the CO2emission variability of grasslands in The
Nether-lands. About 50% of the agricultural land in the Netherlands consists of grassland, where rotational grazing is the most common land use (CBS, 2007). Wetlands and grassland on organic soils play a special role in the GHG budget from land sources in The Netherlands. A relatively large fraction of about 20% of the production
grass-20
lands in The Netherlands is located on peat soils (CBS, 2007). These areas have been drained to maximize agricultural production, which resulted in subsidence of the peat surface due to changes in physical conditions and oxidation of organic material. During oxidation CO2 is released from the soil resulting in yearly net CO2 emissions,
as has been confirmed in estimates from long-term EC observations (e.g., Nieveen et
25
al., 2005; Lloyd, 2006). Some of these areas have now been taken out of agricultural production in order to restore a (semi-) natural grassland. In addition, a number of peat bog areas with natural grassland are located in The Netherlands. In (semi-) natural wetland areas CO2emission due to oxidation is minimized or may even be reversed.
BGD
4, 1499–1534, 2007 Variability of annual CO2 exchange from Dutch Grasslands C. M. J. Jacobs et al. Title Page Abstract Introduction Conclusions References Tables Figures ◭ ◮ ◭ ◮ Back CloseFull Screen / Esc
Printer-friendly Version Interactive Discussion
EGU
In the national inventory report of The Netherlands grassland is defined as all man-aged grasslands, natural grasslands and grasslands for recreation. The contribution of grassland to the national greenhouse gas budget is expressed by means of a simple emission factor, amounting to 518 g C m−2a−1. The emission factor has been derived from belowground carbon stock changes in organic soils as influenced by water
man-5
agement (Brandes et al., 2006). Clearly, this emission factor is much larger than the maximum yearly emission reported by Gilmanov et al. (2007) for organic soils. More-over, it neglects the possible uptake of CO2 by grasslands on mineral soils and in waterlogged areas.
In the present study eight datasets of quasi-continuous CO2flux measurements
cov-10
ering at least 10 months are analysed. The datasets are all obtained in the past decade, using the EC technique. They represent contrasting grassland sites in The Netherlands, ranging from managed grassland to natural grassland. In contrast with Gilmanov et al. (2007), there is much less variation in the climatic conditions among the sites.
15
We first investigate ecophysiological differences between the grasslands. The analysis is based on the construction of ecosystem response curves, notably the photosynthesis-light and the respiration-temperature response characteristics. The contributions from ecosystem respiration Re and photosynthesis (gross primary pro-duction, GPP) can then be distinguished. To date, this approach is commonly used
20
to analyse the net ecosystem exchange of CO2 and has proven to offer a valuable
analysis tool for the detection of ecophysiological differences among different loca-tions (Gilmanov et al., 2007). We then estimated annual emissions using data from a meteorological station in the centre of The Netherlands to drive the fitted ecosystem responses of the sites. This methodology may be viewed as a normalisation of the
25
annual CO2 budget with respect to climatic conditions. It allowed us to better assess the influence of ecophysiological differences between the grasslands, in particular the difference between organic and mineral soils.
Datasets from two extensively managed grassland sites covered a period of four 1503
BGD
4, 1499–1534, 2007 Variability of annual CO2 exchange from Dutch Grasslands C. M. J. Jacobs et al. Title Page Abstract Introduction Conclusions References Tables Figures ◭ ◮ ◭ ◮ Back CloseFull Screen / Esc
Printer-friendly Version Interactive Discussion
EGU
consecutive years. Based on these data, we also estimated the interannual variability relative to ecophysiological differences.
Like Gilmanov et al. (2007), the present analysis is restricted to CO2 exchange
of grassland sites. We recognize the potentially significant role of nitrous oxide and methane in the total greenhouse gas budget of grasslands as well as of farm practice
5
and management. However, long-term micrometeorological observations of N2O and
CH4exchange similar to those of CO2are not yet available in The Netherlands.
More-over, NEE is usually the largest term in the surface-atmosphere exchange of GHG at the field scale, and is the starting point for the construction of more complete GHG balances at the farm level (Soussana et al., 2007a; also see Brandes et al., 2006).
10
2 Materials and methods
2.1 Study sites
The Netherlands, a midlatitude coastal country, has a high frequency of rain events that are more or less evenly distributed during the year. The long-term mean precipitation ranges between 730 mm a−1 (South West) and 750 mm a−1 (East) and occurs during
15
190±26 days a year (Jacobs et al., 2006). The long-term mean annual temperature ranges between 8.9◦C (North) and 9.5◦C (South) and the long-term mean incoming solar radiation ranges between 3400 MJ m−2a−1(Centre) and 3850 MJ m−2a−1(West). CO2 exchange of 8 grassland sites distributed over the Netherlands is analyzed. The geographical locations of these sites are shown in Fig. 1. All sites have a so-called
20
long potential growing season (above 260 days), in which the mean air temperature is above 5◦C. For example, the most eastern and coldest grassland site had a potential growing season of 305±12 days in the years 2002–2005, which is the period analyzed here.
In order the measure the CO2fluxes, all stations are equipped with EC systems,
con-25
BGD
4, 1499–1534, 2007 Variability of annual CO2 exchange from Dutch Grasslands C. M. J. Jacobs et al. Title Page Abstract Introduction Conclusions References Tables Figures ◭ ◮ ◭ ◮ Back CloseFull Screen / Esc
Printer-friendly Version Interactive Discussion
EGU
General principles of the EC flux measurement methodology as well as processing of the data required to obtain high-quality flux estimates are described by Aubinet et al. (2000, 2003). For all sites included in this study, data treatment and quality control closely followed the guidelines in these papers.
In addition to the EC devices at each site a weather station is installed, which
5
provides 30-min averages of global radiation (Ri n), net radiation, air temperature (Ta), vapour pressure, wind speed, wind direction and precipitation. The agro-meteorological station “Haarweg” in the centre of the Netherlands is equipped with an independent double meteorological measurement system in order to avoid gaps in the data. This makes the meteorological data from this station suitable to estimate
10
annual CO2budgets from the ecosystem responses (see Sects. 2.2 and 2.3).
Below a brief description is given of the various grassland sites included here. More-over, the main characteristics of the sites are listed in Table 1. For more detailed information on the EC measurements, the reader is referred to the cited literature. 2.1.1 Haarweg station
15
The meteorological observatory of the Wageningen University, Haarweg Station, is located in the centre of the Netherlands (lat. 51◦58′N, long. 5◦38′E, altitude +7 m a.s.l.; www.met.wau.nl). The dominating plant species in this perennial grassland area are rye grass (Lolium perenne) and rough blue grass (Poa trivialis). The soil at the site is predominantly heavy clay resulting from the back-swamps of the river Rhine. The
20
one-sided Leaf Area Index, LAI, of the terrain is kept constant as good as possible and has a numerical value of 2.9±0.3. About monthly the LAI is measured by a plant analyzer (CID-Inc. model CI-110). During the growing season (1 May–1 November), the grass cover is mowed weekly. With a special grass height meter (Eijkelkamp, model NMI), the mean grass height (about 10 cm) is checked daily. There is a unique relation
25
between the grass height and LAI (Keuning, 1988). If the LAI as derived from the observed grass height exceeds the maximum value of 3.2 within a week, the grass is mowed more frequently. At the measurement site the mowed grass is not removed but
BGD
4, 1499–1534, 2007 Variability of annual CO2 exchange from Dutch Grasslands C. M. J. Jacobs et al. Title Page Abstract Introduction Conclusions References Tables Figures ◭ ◮ ◭ ◮ Back CloseFull Screen / Esc
Printer-friendly Version Interactive Discussion
EGU
evenly spread over the area. CO2flux measurements from the period 2002–2005 are analyzed here. More details about the site can be found in Jacobs et al. (2003b). 2.1.2 Fochteloo ¨erveen
The Fochteloo ¨erveen area is a disturbed raised bog in the north of the Netherlands (lat. 53◦00′N, long. 6◦24′E, altitude +11 m a.s.l.). The vegetation is a natural tussock
5
grassland, with an average height of approximately 0.4 m. A layer of 0.1 m of dead organic material from the previous growing seasons covered the tussocks and the hol-lows in between. The dominating plant species is Molina caerulea (>75%) but also species like Eriophorum vaginatum, Calluna vulgaris and Erica tetralix could be found. The green LAI has a maximum of about 1.7 in August. Throughout the seasons, the
10
water table depth varied, depending on the weather, from 0 to 0.2 m below the tussock soil interface but the soil remained saturated. CO2 fluxes were measured between
June 1994 and October 1995. More details about this site can be found in Nieveen et al. (1998) and Jacobs et al. (2003a).
2.1.3 Cabauw
15
The Cabauw site is located on grassland in the centre of the Netherlands (lat. 51◦57′N, long. 4◦54′E, altitude –0.7 m a.s.l.). The dominating plant species in this perennial grassland area are Lolium perenne (40%), Poa trivialis (20%) and Alopecurus
gencu-latus (10%). The grass is maintained by grazing of sheep and the mean LAI is about
3. The soil is a 0.7 m thick clay layer on peat. Ditches occupy 10% of the aerial
sur-20
face. The water level in the ditches is kept constant during the winter half year and the summer half year respectively. Horizontal transport of water from the grassland to the ditches is limited. This results in considerable changes in ground water level at the central parts of the grassland throughout the year.
CO2 fluxes from four consecutive years (2002–2005) are analysed here. With
west-25
BGD
4, 1499–1534, 2007 Variability of annual CO2 exchange from Dutch Grasslands C. M. J. Jacobs et al. Title Page Abstract Introduction Conclusions References Tables Figures ◭ ◮ ◭ ◮ Back CloseFull Screen / Esc
Printer-friendly Version Interactive Discussion
EGU
is bare soil in winter and maize during summer. Results from the wind direction from this area, between 177 and 317 degrees, are therefore ignored in the present study. More details about this site can be found in Beljaars and Bosveld (1997).
2.1.4 Horstermeer
The Horstermeer site is a grassland/wetland polder of a former agricultural land in a
5
drained natural lake in the centre of the Netherlands (lat. 52◦02′N, long. 5◦04′E, alti-tude –2.2 m a.s.l.). The site has been taken out of agricultural production more than 10 years ago, and has developed into semi-natural grassland. The two meter thick soil consists of peat, overlain with organic-rich lake deposits and is overlying eolian sands of Pleistocene age. After the site has been taken out of agricultural production,
10
the ditch water table has been raised to approximately 10 cm below the land surface. Large parts of the Horstermeer polder are subject to strong groundwater seepage from surrounding lake areas and Pleistocene ice pushed ridges. At the measurement loca-tion seepage is largely reduced and even infiltraloca-tion occurs as a result of the high water table. The surface of the research area consists for 10% of ditches, for 20% of land
15
that is saturated year-round (mostly alongside the ditches) and for 70% of relatively dry land with a fluctuating water table (between 0 to 40 cm below the soil surface) and an aerated top-layer. Management consists only of regulation of the ditch water table; no cattle grazing or harvesting takes place, the only removal of vegetation consists of spo-radic grazing by roe deer. Vegetation consists of different types of grasses (dominant
20
species Holcus lanatus, Phalaris arundinacea, Glyceria fluitans), horsetail (Equisetum
palustre, fluviatile) reeds (Phragmites australis, Typha latifolia) and high forbs (Urtica diocia, Cirsium arvense, palustre). Measurements of CO2 fluxes from the year 2005
are included in the present study. More details about this site can be found in Hendriks et al. (2007).
25
BGD
4, 1499–1534, 2007 Variability of annual CO2 exchange from Dutch Grasslands C. M. J. Jacobs et al. Title Page Abstract Introduction Conclusions References Tables Figures ◭ ◮ ◭ ◮ Back CloseFull Screen / Esc
Printer-friendly Version Interactive Discussion
EGU
2.1.5 Haastrecht
The Haastrecht site is a grassland polder in the centre of the Netherlands (lat. 52◦00′N, long. 4◦48′E, altitude –1.4 m a.s.l.). The dominating plant species in this perennial grassland area are Lolium perenne and Poa trivialis, with an averaged LAI of about 3. The soil at the site is predominantly a peat soil. The water table is kept constant
5
with a level of –1.6 m during the summer season and –1.8 m during the winter season. The grass at the measurement site is maintained by grazing of sheep. The direct sur-roundings of the measurement site are agricultural grasslands with rotational grazing by cows and sheep. CO2flux measurements were performed from July 2003 until May
2004.
10
2.1.6 Stein
The Stein site is a polder in the west of the Netherlands (lat. 52◦01′N, long. 4◦46′E, altitude –1.6 m a.s.l.). The polder was used as grass production land and during the past 20 years the area has gradually become a meadow bird reserve. The dominating plant species in this perennial grassland area are Lolium perenne and Poa trivialis.
15
Vernal grass (Anthoxantum odoratum) and sour dock (Rumex acetosa), however, are becoming more abundant. The soil at the site is a clayey peat or peaty clay of about 25 cm thickness on a 12 m thick peat layer. About 15% of the area is open water (ditches or low parts in the landscape). CO2flux measurements were conducted from
2004 onwards. More details about this site can be found in Veenendaal et al. (2007)1.
20 1
Veenendaal, E. M., Kolle, O., Leffelaar, P., Schrier, A., Van Huissteden, K., Van Walsum, J., Moller, F., and Berendse, F.: Land use dependent CO2 exchange and carbon balance in two grassland sites on eutropic drained peat soils, Biogeosci. Discuss., submitted, 2007.
BGD
4, 1499–1534, 2007 Variability of annual CO2 exchange from Dutch Grasslands C. M. J. Jacobs et al. Title Page Abstract Introduction Conclusions References Tables Figures ◭ ◮ ◭ ◮ Back CloseFull Screen / Esc
Printer-friendly Version Interactive Discussion
EGU
2.1.7 Oukoop
The Oukoop site is a grassland polder in the west of the Netherlands (lat. 52◦02′N, long. 4◦47′E, altitude –1.8 m a.s.l.). The grassland site is part of an intensive dairy farm with rotational grazing during the summer period (mid-May–mid-September). The dominating plant species in this perennial grassland area are Lolium perenne and Poa
5
trivialis. Manure and fertilizers are applied two or three times a year, but not during
winter time. The area is about 4 km South-West of the Stein location and has the same soil characteristics. CO2flux measurements started in 2004. More details about this
site can be found in Veenendaal et al. (2007)1. 2.1.8 Lelystad
10
The Lelystad site is a grassland site in the centre of the Netherlands (lat. 52◦31′N, long. 5◦35′E, altitude 0 m a.s.l.). The site is located in the Flevopolder, an area re-claimed from Lake IJssel in 1965. The soil consists of young sea clay. The groundwater table is maintained at about 1 m below the ground surface, but it can be higher during periods of rain. The grassland site is part of an experimental farm “De Waiboerhoeve”
15
with intensive management with 5–6 harvests a year. Grass was removed from the field either by cutting or by grazing. The farm has a total number of 400 cows and 500 sheep. Manure and fertilizers are applied about six times a year, but not during winter time. CO2 flux observations from the period July 2003 until June 2004 are analyzed
here. More details about this site can be found in Gilmanov et al. (2007).
20
2.2 Net Ecosystem Exchange of CO2(NEE) and respiration
The net ecosystem exchange of CO2, NEE, is the result of photosynthetic uptake,
GPP, and the ecosystem respiration, Re. Using the ecological sign convention with photosynthetic uptake defined positive, we have:
NE E = GP P − Re (1)
25
BGD
4, 1499–1534, 2007 Variability of annual CO2 exchange from Dutch Grasslands C. M. J. Jacobs et al. Title Page Abstract Introduction Conclusions References Tables Figures ◭ ◮ ◭ ◮ Back CloseFull Screen / Esc
Printer-friendly Version Interactive Discussion
EGU
During nighttime, only respiration occurs which enables analyses based on a distinction between daytime (downward solar radiation Ri n>0) and nighttime (Ri n= 0) fluxes. For nighttime Eq. (1) reduces to:
NE E = −Re = −Rnight (2)
Temperature is an important driving variable of respiration. This relation is usually
5
expressed by means of, for example, an Arrhenius-type relation. Here, we apply the following equation to analyse the response of respiration to temperature (Lloyd and Taylor, 1994): NE E = Re= Roexp(Ea( 1 To−Tref − 1 T − Tref)) (3) where Ro(µmol m −2
s−1) is the reference respiration at T =T0= 10 ◦
C (or T0= 283.15 K),
10
T (◦C) is temperature and Ea (K−1) is a the so-called ecosystem activation energy or sensitivity coefficient, Tref = 227.13 K is a second reference temperature denoting the
temperature below which there is no respiration anymore. Temperature T in (3) may be soil temperature Ts or air temperature Ta. Because Re originates from the soil and the vegetation, Ts would be a logical choice to use in (3). However, this temperature
15
is not always available at all sites. Using half-hourly or hourly fluxes from eddy corre-lation measurements the fraction of variance explained by (3) does usually not differ much and for forest in particular, a slightly better correlation may even be obtained us-ing Ta(Reichstein et al., 2005; Ruppert et al, 2006). Moreover, Van Dijk and Dolman (2004) suggested that using Ta gives much more consistent results in inter-site
com-20
parisons, which is probably due to problems and inconsistencies in the measurement of Ts. Therefore, and because we aim at a similar analysis for all sites, we use Ta, instead of Ts.
From the nighttime flux data we excluded those obtained during precipitation events. Furthermore, it was required that friction velocity u∗>0.1 m s
−1
. During relatively calm
25
BGD
4, 1499–1534, 2007 Variability of annual CO2 exchange from Dutch Grasslands C. M. J. Jacobs et al. Title Page Abstract Introduction Conclusions References Tables Figures ◭ ◮ ◭ ◮ Back CloseFull Screen / Esc
Printer-friendly Version Interactive Discussion
EGU
since these conditions are non-stationary and non-homogeneous. It appears that the criterion u∗≤0.1 m s
−1
is an appropriate threshold for not applying the eddy-covariance technique (Van de Wiel et al., 2003). Indeed, analysis of the Haarweg data showed that the uncertainty in Redue to uncertainty in the fitted parameters was less than 3% for 3 out of 4 years as long as if u∗>0.1 m s
−1
but only increased to about 7% in one
5
case (2003).
To determine the responses of Reto temperature, the data from one entire year were averaged in Ta bins with an equal number of data. Equation (3) was then fitted to the bin averages, by optimizing the reference respiration, Roas well as Ea(Ruppert et al., 2006). Annual sums of the respiration are then estimated by applying Eq. (3), with
10
observed Tafrom Haarweg as the driving variable.
The base respiration Ro and sensitivity coefficient Eaare probably influenced by soil moisture as well (Reichstein et al., 2005). Similarly, changes in ecosystem character-istics may affect Re. To deal with these effects, the optimization may be carried out for separate, shorter periods of time. Tests with separate optimizations per period of half
15
a month for the year 2005 showed that the effect on the annual sums on Revaries from minor (48 gC m−2a−1 or 3% in the case of Cabauw) to considerable (205 gC m−2a−1 or 22% in the case of Lelystad). However, the numbers are then based on sometimes meaningless fits, with negative or very low correlations between model and data, with sometimes spurious behavior of R0. Furthermore, for some sites gaps of a few months
20
per year occurred, which implies additional uncertainty in inter-site comparisons, with results that cannot be compared anymore. Considering our goal, that is, to provide an estimate of the differences at an annual basis, it may therefore be argued that such a refined analysis does not necessarily imply a more reliable result. Therefore, it was decided to stick to the analysis in periods of one entire year.
25
BGD
4, 1499–1534, 2007 Variability of annual CO2 exchange from Dutch Grasslands C. M. J. Jacobs et al. Title Page Abstract Introduction Conclusions References Tables Figures ◭ ◮ ◭ ◮ Back CloseFull Screen / Esc
Printer-friendly Version Interactive Discussion
EGU
2.3 Parameterization photosynthetic uptake
There are two major light-use efficiency characteristics used in literature; the physio-logical one and the ecophysio-logical one. Here we use the ecophysio-logical light-use efficiency be-cause these characteristics matches the scale of our analysis (Gilmanov et al., 2007). The daytime data (Ri n>0) are used to make an assessment of the light-response
5
curves at the ecosystem scale. Again, data during episodes of precipitation are dis-carded. The data were stratified in Ta classes of 5◦C and per temperature class the data were binned into 10 light intensity classes of equal numbers of data. Light re-sponse curves were then fitted to the light-bin averages, using the rectangular hyper-bola (Goudriaan and Van Laar, 1994):
10 NE E + Reco = GP P= αRi nGP Pmax αRi n+ GP Pmax (4) where Ri n(W m −2
) is the incoming short wave radiation, α (µmol J−1) is the actual light conversion factor and GPPmax(µmol m
−2
s−1) is the maximum gross assimilation rate. The stratification in temperature classes accounts for the effect of temperature on the photosynthesis. In addition photosynthesis may be affected by the humidity of the air,
15
due to stomatal closure under dry atmospheric conditions. However, humidity deficit and temperature are strongly correlated in particular at the upper temperature ranges above the photosynthetic temperature optimum. Consequently, at the ecosystem scale, accounting for humidity differences as well has only a small effect on the annual sums in practice, in particular if the temperature bins are reduced. Similarly, as suggested
20
by Ruppert et al. (2006) ecosystem characteristics affecting the light response, such as LAI (Veenendaal et al., 20071), may be correlated with temperature at seasonal timescales. Tests were performed with temperature bins reduced to 2 K. The scatter in the fitted parameters increased, but differences of <1% (∼15 gC m−2a−1) were found with respect to the annual sums of GPP. Therefore, it was decided to only stratify the
25
BGD
4, 1499–1534, 2007 Variability of annual CO2 exchange from Dutch Grasslands C. M. J. Jacobs et al. Title Page Abstract Introduction Conclusions References Tables Figures ◭ ◮ ◭ ◮ Back CloseFull Screen / Esc
Printer-friendly Version Interactive Discussion
EGU
3 Results and discussion
3.1 Respiration characteristics
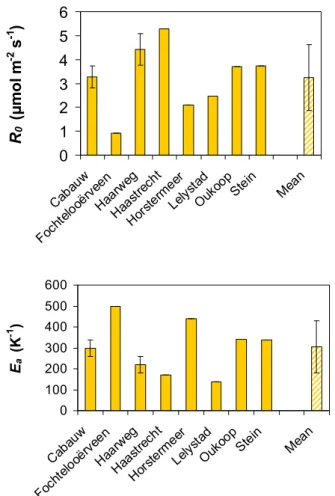
First, the nighttime fluxes of all grassland stations are analyzed in order to obtain the reference respiration, Ro, and the activation energy, Ea. Figure 2 shows the results from this analysis for the individual sites, as well as the mean parameter value from all
5
the sites. In the case of Haarweg and Cabauw, the mean of 4 years has been plotted. Error bars denote the standard deviation.
It can be seen that the Stein and Oukoop locations behave more or less similar in their respiration characteristics. Both stations are situated in the same area and have nearly the same history. Only during the past 20 years the Stein site is gradually
10
subjected to a different management regime, from intensively managed grassland into a meadow bird reserve. Apparently, this change has hardly affected the respiration characteristics until today. Second, we infer from Fig. 2 that the Fochteloo ¨erveen and Horstermeer grassland/wetland locations deviate most from all other locations. The Fochteloo ¨erveen area is a natural bog area. In summertime only, there is green
veg-15
etation with a very low LAI (about 1.7) and with a relatively high water table ranging between –0.0 m (wintertime) and –0.2 m (summertime) below the tussock soil inter-face. The Horstermeer area is a grassland/wetland area that is taken out of production for more than 10 years and has been developed into a semi-natural grassland/wetland. Also here the water table is relatively high and ranges between –0.4 (summertime) and
20
–0.0 m (wintertime). As a consequence, at both locations the aeration of the uppermost soil layer is probably reduced, which then limits the respiration. In peat areas where the water table is usually close to the ground surface, this phenomenon may then result in a close relation between the water table depth and respiration (Lloyd, 2006). In places with a less direct coupling between soil moisture content of the upper layer and the
25
depth of the groundwater table, such a relation may be very weak or absent (Lafleur et al., 2005; Nieveen et al., 2005).
For the Haarweg and Cabauw sites, observations from four complete years (2002– 1513
BGD
4, 1499–1534, 2007 Variability of annual CO2 exchange from Dutch Grasslands C. M. J. Jacobs et al. Title Page Abstract Introduction Conclusions References Tables Figures ◭ ◮ ◭ ◮ Back CloseFull Screen / Esc
Printer-friendly Version Interactive Discussion
EGU
2005) are available. To get insight into the interannual variation of Ro and Ea, their standard deviations have been calculated for both sites and plotted in Fig. 2 as well. These standard deviations can then be compared with the standard deviation from the average of all sites. In the case of Haarweg, the standard deviation in R0 amounts
to 0.66 µmol m−2s−1 (15% of the average from four years), while it is 39 K−1 in Ea
5
(18%). For Cabauw, the standard deviations are 0.46 µmol m−2s−1 (14%) and 39 K−1 (13%), respectively. This is much less than the standard deviations from all sites: 1.37
µmol m−2s−1 for R0(31%) and 125 K −1
(41%) for Ea, respectively. Assuming similar variability characteristics for all sites, these estimates of interannual variability imply an error of ∼15% in estimates of annual respiration if we apply the respiration
character-10
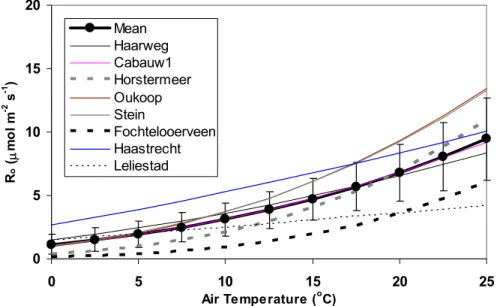
istics calculated from one year of observations to all other years (also see Sect. 3.3). To have some idea of the mutual respiration differences between all eight grasslands, the fitted respiration curves of all sites have been plotted in Fig. 3 as function of the air temperature along with the averaged temperature dependency and their standard deviations. Clearly, it can be inferred from Fig. 3 that both grassland/wetland
loca-15
tions reveal relatively low respiration rates at low temperatures, but their high tempera-ture sensitivity compensates for the lower base respiration at the higher temperatempera-tures. Considering the response curves over the entire range, these two sites cause the rel-atively large standard deviations from the mean value. Moreover, from Fig. 3 it can be observed that the Haastrecht site shows a relatively high base respiration rate. The
20
Haastrecht site is a peat soil area and has a lower water table than the Fochteloo ¨erveen and Horstermeer sites which ranges between –0.2 (summertime) and –0.4 m (winter-time). Probably both reasons (peat soil and lower water table) are responsible for the relatively high base respiration rate at the Haastrecht site. However, the temperature sensitivity is much less than at Horstermeer and Fochteloo ¨erveen, which tends to
re-25
duce the overall respiration rate at the higher temperatures. The Lelystad site reveals a similar low temperature sensitivity. However, in this case the base respiration is much like the average one, resulting in relatively large deviations from the average at higher temperatures.
BGD
4, 1499–1534, 2007 Variability of annual CO2 exchange from Dutch Grasslands C. M. J. Jacobs et al. Title Page Abstract Introduction Conclusions References Tables Figures ◭ ◮ ◭ ◮ Back CloseFull Screen / Esc
Printer-friendly Version Interactive Discussion
EGU
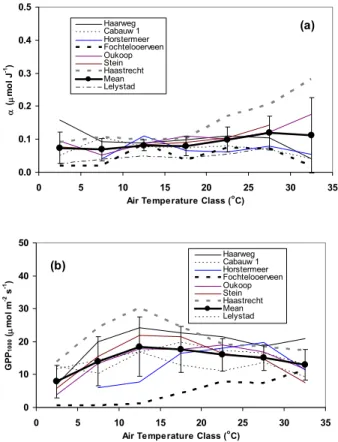
3.2 Light responses
Figure 4 depicts the characteristics of the light response curves of all eight grassland sites as a function of the temperature. The temperature taken is central in the 5-degrees temperature bins defined in the analysis. This is very close to the bin-averaged temperature. In the case of Cabauw and Haarweg, the values from 2005 have been
5
plotted. The variability of the parameters during the period 2002–2005 will be further investigated below.
In the top panel of Fig. 4, all the light conversion factors α are plotted along with the average from all sites and the standard deviations per temperature bin. It can clearly be seen that on average α is nearly a constant for all temperature classes, with a
10
value somewhat below 0.1 µmol J−1. The Fochteloo ¨erveen area has a very low LAI, especially during the start and the end of the growing season (LAI<<1). It must be expected that this is the reason for a relatively low light conversion factor for this area in particular for the low temperature classes. On the other hand, α at the Haastrecht site is rather high at higher temperatures. This causes the largest part of the standard
15
deviation in the temperature classes >20◦C. Since the Haastrecht site generally also shows the highest values of the gross maximum assimilation rate (see below) this may be an effect of a high LAI in this area. Effects of LAI on the light conversion factor and on the assimilation rate at saturating light intensity has been demonstrated at the Oukoop and Stein sites by Veenendaal et al. (2007)1. However, note that part of the
20
large standard deviation at high temperatures is due to uncertainty in the fits caused by low numbers of data in these temperature classes.
The bottom panel of Fig. 4 contains a measure for the gross assimilation rate at a so-lar light intensity of Ri n= 1000 W m
−2
, GPP1000. The maximum gross assimilation rate
GPPmax is an asymptotic value for the rectangular hyperbolic light response function
25
(see Eq. 4), which varies during the seasons and for different ecosystems. However, it often does not saturate within a realistic range of radiation intensities, especially in cases where the response tends to be linear, or if no observations are available beyond
BGD
4, 1499–1534, 2007 Variability of annual CO2 exchange from Dutch Grasslands C. M. J. Jacobs et al. Title Page Abstract Introduction Conclusions References Tables Figures ◭ ◮ ◭ ◮ Back CloseFull Screen / Esc
Printer-friendly Version Interactive Discussion
EGU
the quasi-linear section of the curves. In such cases, the fitted GPPmaxis not a realis-tic measure of maximum gross assimilation rates. Therefore, in order to obtain a more realistic comparison between different sites we follow Ammann et al. (2007) and use
GPP1000instead. As such, GPP1000can be interpreted as a measure for the so-called light saturation point for the various ecosystems.
5
It must be expected that for an ecosystem with a low LAI, the light saturation is reached at lower irradiations than for an ecosystem with a high LAI (Goudriaan and Van Laar, 1994) but GPP1000will be higher for ecosystems with higher LAI. Figure 4
clearly reflects that for the Fochteloo ¨erveen site, which has the lowest maximum LAI (LAImax≈1.7). Similarly, Haastrecht presumably has the highest LAI. Although there
10
are no direct observations, at locations near the Haastrecht site LAI values up to about 10 have been observed.
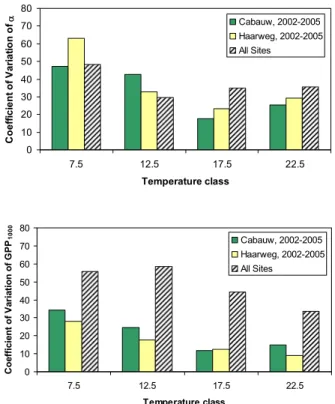
Observations from four complete years (2002–2005) at Haarweg and Cabauw are further analyzed to get insight into the interannual variation of α and GPP1000, relative to the variation between sites. We consider the temperature classes between 5 and
15
25◦C because the fits in these classes are most reliable and are available for all years. These variations can then be compared with the standard deviation from the average of all sites. Figure 5 shows as a function of the middle temperature of the bins the coefficient of variation (CV, standard deviation relative to the mean value) of α and
GPP1000for the Haarweg and Cabauw averages in the period 2002–2005, and for the
20
individual years of all sites (2005 in the case of Haarweg and Cabauw). The interannual variability of α is comparable or even larger than the inter-site variability, with CV values between 18 and 63%. In contrast, the interannual variability of GPP1000is clearly less than the inter-site variability. CV values range between 12 and 35% for the interannual variability, and between 34 and 59% for the inter-site variability. At the lower and higher
25
Ta classes, the uncertainty tends to be larger because there are less data in the bins. Also, because temperature and irradiation are correlated, high Ri nis underrepresented at low Ta and the reverse.
anti-BGD
4, 1499–1534, 2007 Variability of annual CO2 exchange from Dutch Grasslands C. M. J. Jacobs et al. Title Page Abstract Introduction Conclusions References Tables Figures ◭ ◮ ◭ ◮ Back CloseFull Screen / Esc
Printer-friendly Version Interactive Discussion
EGU
correlated, the estimated variability in the annual GPP is much less. Based on the ob-served meteorological conditions at Haarweg in the year 2005, the CV of annual GPP amounts to about 9 and 14% for Haarweg and Cabauw, respectively, while it is nearly 38% for the inter-site variability. Thus, again assuming similar variability characteristics for all sites, these estimates imply an error of ∼15% in estimates of annual GPP if we
5
apply the light-response characteristics calculated from 1 year of observations to all other years (also see Sect. 3.3).
3.3 Annual CO2exchange
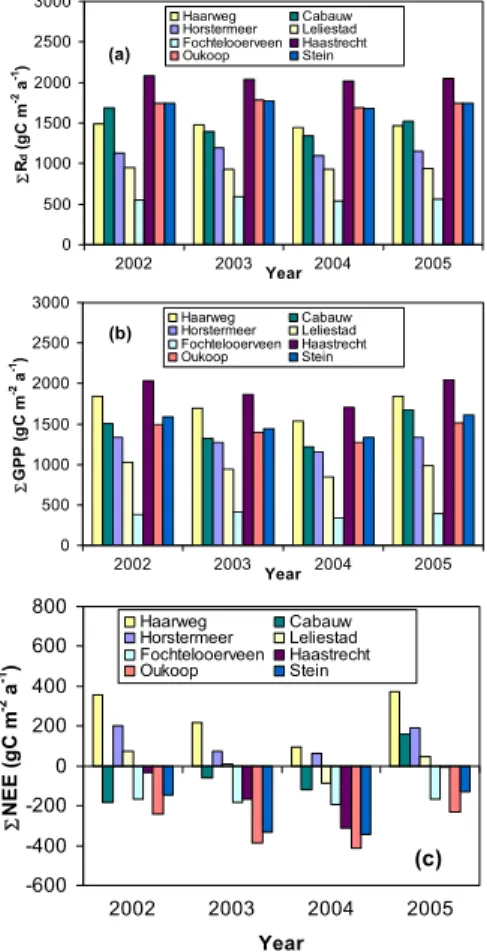
Figure 6 contains the individual annual sums of Rd, GPP and NEE for the eight differ-ent locations and the four selected years. The sums have been computed using the
10
observed meteorological conditions (Taand Ri n) at Haarweg as driver of the response functions. Because the response functions used are the same in each year, the in-terannual variability revealed in Fig. 6 reflects differences in the main climatological drivers.
The respiration does not show large interannual differences for all eight individual
15
sites. This is to be expected because the driving variable of the respiration model is Ta, that does not vary much on the annual timescale, in the period considered here. For example, at the Haarweg site the long-term mean annual air temperature is 9.4±0.7◦C (Jacobs et al., 2006). The mean annual respiration is 1450±25 gC m−2a−1. The aver-age GPP for all sites amounts to 1400±110 g C m−2a−1, which displays a much higher
20
variability (8%) than the respiration (2%). GPP depends on Ri nin combination with Ta. In particular Ri ncan vary much between the years. For example, the long-term Ri nfor the Haarweg site is 3400±300 MJ m−2a−1.
Obviously, the NEE shows a much larger variation (see Fig. 6c). On average, the annual NEE amounts to –65±85 gC m−2a−1, which means that on average our
grass-25
lands act as a source with a relatively large standard deviation.
We next assess the interannual variation of the carbon exchange components due to eco-physiological differences (see Sects. 3.1 and 3.2). To this end, annual sums
BGD
4, 1499–1534, 2007 Variability of annual CO2 exchange from Dutch Grasslands C. M. J. Jacobs et al. Title Page Abstract Introduction Conclusions References Tables Figures ◭ ◮ ◭ ◮ Back CloseFull Screen / Esc
Printer-friendly Version Interactive Discussion
EGU
are computed for the Cabauw and Haarweg sites for the year 2005, using the fits of each individual year in the period investigated. The average of the four sums and the standard deviation are then compared with the average and standard deviation from all sites, using the respective model fits of the specific year of the observations (2005 in the case of Cabauw and Haarweg), again driven with Taand Ri nfrom Haarweg in 2005.
5
Results are shown in Table 2. It can be seen that the absolute and relative variation in GPP and Rd due to the interannual differences in ecophysiological characteristics are much smaller than the intersite variation (10–15% versus 35–37%, respectively). However, the standard deviation of the site-average NEE is similar to the one of the period-average (207 versus 176–276 gC m−2a−1). Note that the CV of NEE given in
10
the table shows a spurious behavior due to the small averages.
From former research it must be expected that grasslands on organic soils (e.g. peat) are sources for carbon dioxide (Nieveen et al., 1998; Nieveen et al., 2005; Lloyd, 2006; Veenendaal et al., 20071), while grasslands on mineral soils (for example, clay and sand) are sinks for carbon dioxide (Gilmanov et al., 2007). Clearly it can be observed
15
that the Fochteloo ¨erveen, Haastrecht, Oukoop and Stein sites follow this rule for or-ganic soils and the Haarweg and Horstermeer sites for mineral soils. An exception appears to be the Cabauw site, which has a clay soil but sometimes behaves as a source (2002, 2003, 2004) and sometimes as a sink for CO2(2005).
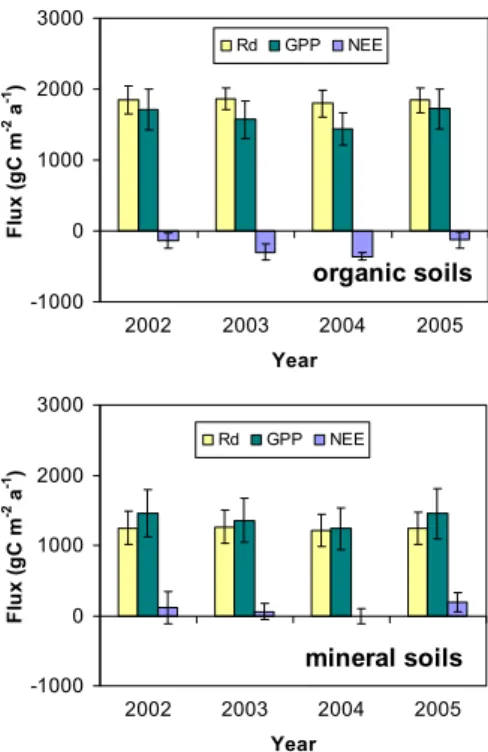
To make a distinction between both soil types, the sums of the annual carbon fluxes
20
are plotted separately for both soil types in Fig. 7 along with their standard deviations. From Fig. 7 we conclude that the annual standard deviations for all fluxes of the organic soils are much higher than those for the mineral soils. In our case this larger standard deviation is mainly caused by the Fochteloo ¨erveen bog site, which behaves quite dif-ferently from the other organic grassland sites. Second, we conclude that for both soil
25
types the interannual differences in Rd are small in comparison to the interannual dif-ferences in GPP and as a consequence the interannual difdif-ferences in NEE are large as well. This also can be concluded from Table 3 where for both soil types the mean of the whole selected period have been given.
BGD
4, 1499–1534, 2007 Variability of annual CO2 exchange from Dutch Grasslands C. M. J. Jacobs et al. Title Page Abstract Introduction Conclusions References Tables Figures ◭ ◮ ◭ ◮ Back CloseFull Screen / Esc
Printer-friendly Version Interactive Discussion
EGU
On average we conclude from Table 3 that the annual NEE amounts 90±90 gC m−2a−1 for the mineral soils and –220±90 g C m−2a−1for the organic soils. As stated earlier, about 80% of the Dutch grasslands are on mineral soils and about 20% on organic soils. Do we take the weighed mean for the Dutch grasslands we find on average 28±90 g C m−2a−1which means that on average the Dutch grasslands
5
behave like a sink for CO2.
Our results suggest that within small regions with relatively uniform climatic condi-tions the variability may be similar to the one observed at much larger scales with a large range of climatic conditions. At the European scale, Gilmanov et al. (2007) found the annual GPP to vary between 464 and 1881 gC m−2a−1, Re between 572
10
and 1636 gC m−2a−1 and NEE between an uptake of 655 gC m−2a−1 and a release of 164 gC m−2a−1. These numbers are based on gapfilled timeseries of observa-tions. Our ranges in GPP and Re are similar to the one reported by Gilmanov et al. (2007): annual GPP varies between 391 and 2109 gC m−2a−1, and Rebetween 560 and 2047 gC m−2a−1. We find the NEE to vary between a net uptake of 307 gC m−2a−1
15
and a release of 250 gC m−2a−1. Our results are based on ecosystem characteristics derived from on-site quality-controlled observations, extrapolated using response func-tions at the yearly timescale to the climatological condifunc-tions of one site. We feel that this method works satisfactorily for intersite-comparison and enables estimates of the relative contribution of climatological and ecophysiological conditions to the variability
20
of CO2exchanges of grassland.
Finally, comparing the ranges in annual CO2exchange at the European and National
(Dutch) scale, it may be concluded that emission factors should be derived at the scale of application, and cannot simply be interpolated from larger to smaller regions. More-over, there is a need for regionally specific and spatially explicit CO2 emission factors
25
at the field scale.
BGD
4, 1499–1534, 2007 Variability of annual CO2 exchange from Dutch Grasslands C. M. J. Jacobs et al. Title Page Abstract Introduction Conclusions References Tables Figures ◭ ◮ ◭ ◮ Back CloseFull Screen / Esc
Printer-friendly Version Interactive Discussion
EGU
4 Summary and conclusions
For eight Dutch grassland sites, CO2 fluxes were determined using the Eddy
Covari-ance technique during periods of at least 10 months per site. The measurement sites, four natural grasslands, two production grasslands and two meteorological stations within a rotational grassland region, are more or less distributed over the grassland
ar-5
eas in The Netherlands. The photosynthesis-light response analysis technique is used along with the respiration-temperature response technique to partition NEE among Gross Primary Production (GPP) and Ecosystem Respiration (Re) and to obtain the eco-physiological characteristics of the sites a the field scale. To assess annual sums of NEE, R0, GPP and their variability, calculations using the fitted response curves
10
were then carried out for four years (2002–2005). Air temperature and solar radia-tion observed at the Haarweg meteorological staradia-tion in the centre of The Netherlands were used as drivers of the response models. The main conclusions of this study are summarized as follows:
1. The annual NEE is estimated to be –65±85 gC m−2a−1. This means that on
15
average the grasslands act as a source, with a relatively large standard deviation. However, a distinction can be made between the grasslands on mineral soils, with a mean net uptake of 90±90 gC m−2a−1, and those on organic soils with a mean net release of 220±90 gC m−2a−1. The mean NEE weighed with the fraction of grasslands on organic (20%) and mineral soils (80%) is 28±90 g C m−2a−1,
20
implying that on average the Dutch grasslands behave like small sink for CO2.
2. The main characteristics of the respiration-temperature response curves, Ro and
Ea, of individual sites show an interannual variability which is much lower than the inter-site variability, with a variability coefficient of ∼15% versus ∼35%, re-spectively. The resulting corresponding variabilities in annual Reare similar. The
25
variability due to differences in climatological factors is much smaller, ∼2%. 3. The light conversion factor, α, is more or less a constant for all analyzed
ecosys-BGD
4, 1499–1534, 2007 Variability of annual CO2 exchange from Dutch Grasslands C. M. J. Jacobs et al. Title Page Abstract Introduction Conclusions References Tables Figures ◭ ◮ ◭ ◮ Back CloseFull Screen / Esc
Printer-friendly Version Interactive Discussion
EGU
tems and for all temperature classes, while GPP and the light saturation point,
GPP1000, differs for all analyzed ecosystems and temperature classes. It must
be expected that GPP1000 is a function of the leaf area index. Interannual
vari-ability of α ranges from ∼20 to ∼60 %, depending on the air temperature, and is similar to the intersite variability. The standard deviation of GPP1000 is ∼10 to
5
∼40% of the four-year averages and ∼ 40 to ∼60% of the means from all sites, again depending on the air temperature. The corresponding coefficients of vari-ation for annual GPP are ∼10 to 15% and ∼37%, respectively. Variability due to climatology is assessed to be ∼8%.
4. The standard deviation of annual NEE due to interannual and intersite
variabil-10
ity of ecophysiological differences is estimated to be 176–276 gC m−2a−1 both cases, as compared to 85 gC m−2a−1for climatologically driven variability.
5. Our variability estimates are similar to those on a much larger, European scale. It may be concluded that emission factors should be derived at the scale of applica-tion, and cannot simply be interpolated from larger to smaller regions. There is a
15
need for regionally specific and spatially explicit CO2emission factors at the field scale.
Acknowledgements. This research project is performed in the framework of the Dutch National
Research Programme Climate Changes Spatial Planning (http://www.klimaatvooruimte.nl). It
is co-funded by the Dutch Ministry of Agriculture. B. Heusinkveld (WU-METAQ), J. Elbers and
20
W. Jans (Alterra) are thanked for carrying out the field work.
References
Ammann, C., Flechard, C. R., Leifeld, J., Neftel, A., and Fuhrer, J.: The carbon budget of newly established temperate grassland depends on management intensity, Agric., Ecosyst. Environ., 121, 5–20, 2007.
25
Aubinet, M., Grelle, A., Ibrom, A., et al.: Estimates of the annual net carbon and water exchange of forests: The EUROFLUX methodology, Adv. Ecol. Res., 30, 113–175, 2000.
BGD
4, 1499–1534, 2007 Variability of annual CO2 exchange from Dutch Grasslands C. M. J. Jacobs et al. Title Page Abstract Introduction Conclusions References Tables Figures ◭ ◮ ◭ ◮ Back CloseFull Screen / Esc
Printer-friendly Version Interactive Discussion
EGU Aubinet, M., Heinesch, B., and Yermaux, M.: Horizontal and vertical CO2 advection in a sloping
forest, Bound.-Layer Meteorol., 108, 397–417, 2003.
Baldocchi, D., Falge, E., Gu, L., Olson, R., Hollinger, D., Running, S., Anthoni, P., Bernhofer, C., Davis, K., Evans, R., Fuentes, J., Goldstein, A., Katul, G., Law, B., Lee, X., Malhi, Y., Meyers, T., Munger, W., Oechel, W., Paw, K. T., Pilegaard, K., Schmid, H. P., Valentini, R.,
5
Verma, S., Vesala, T., Wilson, K., Wofsy, S.: FLUXNET: A New Tool to Study the Temporal and Spatial Variability of Ecosystem-Scale Carbon Dioxide, Water Vapor, and Energy Flux Densities. BAMS, 82, 2415–2434, 2001.
Beljaars A. C. M. and Bosveld, F. C.: Cabauw data for the validation of land surface parameter-ization schemes, J. Climate, 10, 1172–1193, 1997.
10
Brandes, L. J., Alkemade, G. E. M., Ruyssenaars, P. G., Vreuls, H. H. J., and Coenen, P. W. H. G.: Greenhouse Gas Emissions in the Netherlands 1990-2004, National Inventory Re-port 2006. MNP ReRe-port 500080001/2006, Netherlands Environmental Assessment Agency (MNP), Bilthoven, Netherlands, 2006.
CBS, Central Dutch Statistical Bureau:http://www.cbs.nl, 2007.
15
EEA: The European environment. State and outlook 2005. European Environment Agency, 2005.
Friedlingstein, P., Cox, P., Betts, R., Bopp, L., von Bloh, W., Brovkin, V., Cadule, P., Doney, S., Eby, M., Fung, I., Bala, G., John, J., Jones, C., Joos, F., Kato, T., Kawamiya, M., Knorr, W., Lindsay, K., Matthews, H. D., Raddatz, T., Rayner, P., Reick, C., Roeckner, E., Schnitzler,
20
K.-G., Schnur, R., Strassmann, K., Weaver, A. J., Yoshikawa, C., and Zeng, N.: Climate-Carbon Cycle Feedback Analysis: Results from the C4MIP Model Intercomparison, J. Clim. 19, 3337–3353, 2006.
Gilmanov, T. G., Soussana, J.-F., Allards, A. L., Ammann, C., Balzarolo, M., Barza, Z., Bern-hofer, C., Campbell, C. L., Cescatti, A., Clifton-Brown, J., Dirks, B. O. M., Dore, S., Eugster,
25
W., Fuhrer, J., Gimenco, C., Gruenwald, C., Haszpra, L., Hensen, A., Ibrom, A., Jacobs, A. F. G., Jones, M. B., Laurila, G., Lohila, A., Manca, G., Marcolla, B., Nagy, Z., Pilegaard, K., Pinter, K., Pio, C., Raschi, A., Rogiers, N., Sanz, M. J., Stefani, P., Sutton, M., Tuba, Z., Valentini, R., Williams, M. L., and Wohlfahrt, G.: Partitioning European grassland net ecosystem CO2 exchange into gross primary productivity and ecosystem respiration using
30
light response function analysis, Agric. Ecosyst. Environ. 121, 93–120, 2007.
Goudriaan, J. and Van Laar, H. H.: Modelling Potential Crop Growth Processes. Kluwer Ac. Publ., Dordrecht, ISBN 0-7923-3219-9, 1994.
BGD
4, 1499–1534, 2007 Variability of annual CO2 exchange from Dutch Grasslands C. M. J. Jacobs et al. Title Page Abstract Introduction Conclusions References Tables Figures ◭ ◮ ◭ ◮ Back CloseFull Screen / Esc
Printer-friendly Version Interactive Discussion
EGU Hadley, M.: Grasslands for sustainable ecosystems, in: Grasslands for our world, edited by:
Baker, M. J., SIR publishing, Wellington, New Zealand, 12–18, 1993.
Hendriks, D. M. D., Van Huissteden, J., Dolman, A. J., and Van der Molen, M. K.: The full green-house gas balance of an abandoned peat meadow, Biogeosci. Discuss., in press, 2007. Hu, S., Chapin III, F. S., Firestone, M. K., Field, C. B., and Chiariello, N. R.: Nitrogen limitation
5
of microbial decomposition in a grassland under elevated CO2, Nature, 409, 188–190, 2001.
IPCC: Good Practice Guidance for land Use, Land-Use Change and Forestry. IPCC, Cam-bridge, UK, 2003.
Jacobs, A. F. G., Ronda, R. J., and Holtslag, A. A. M.: Water vapour and carbon dioxide fluxes over bog vegetation, J. Agric. Forest Meteorol., 116, 103–112, 2003a.
10
Jacobs, A. F. G., Heusinkveld, B. G., and Holtslag, A. A. M.: Carbon dioxide and water vapour flux densities over a grassland area in the Netherlands, Int. J. Climatol., 23, 1663–1675, 2003b.
Jacobs, A. F. G., Heusinkveld, B. G., and Wichink Kruit, R. J.: Contribution of dew to the water budget of a grassland area in the Netherlands, Water Resour. Res., 42, W03415,
15
doi:10.1029/2005WR004055, 2006.
Keuning, J. A.: Grashoogtemeter hulpmiddel voor schatting grashoeveelheid. Meststoffen, 1, 1–3, (in Dutch), 1988.
Lafleur, P. M., Moore, T. R., Roulet, N. T., and Frolking, S.: Ecosystem respiration in a cool temperate bog depends on peat temperature but not water table, Ecosystems, 8, 619–629,
20
2005.
Lloyd, J. and Taylor, J. A.: On the temperature dependence of soil respiration, Funct. Ecol., 8, 315–323, 1994.
Lloyd, C. R.: Annual carbon balance of a managed wetland meadow in the Somerset Levels, UK, Agric. Forest Meteorol., 138, 168–179, 2006.
25
Nieveen, J. P., Jacobs, C. M. J., and Jacobs, A. F. G.: Diurnal and seasonal variation of carbon dioxide exchange from a former true raised bog, Global Change Biol., 4, 823–833, 1998. Nieveen, J. P., Campbell, D. I., and Schipper, L. A.: Carbon exchange of grazed pasture on a
drained peat soil, Global Change Biol., 11, 607–618, 2005.
Reichstein, M., Falge, E., Baldocchi, D., Papale, D., Aubinet, M., Berbigier, P., Bernhofer,
30
C., Buchmann, N., Gilmanov, T., Granier, A., Grunwald, T., Havrankova, K., Ilvesniemi, H., Janous, D., Knohl, A., Laurila, T., Lohila, A., Loustau, D., Matteucci, G., Meyers, T., Miglietta, F., Ourcival, J. M., Pumpanen, J., Rambal, S., Rotenberg, E., Sanz, M., J., Seufert, G.,
BGD
4, 1499–1534, 2007 Variability of annual CO2 exchange from Dutch Grasslands C. M. J. Jacobs et al. Title Page Abstract Introduction Conclusions References Tables Figures ◭ ◮ ◭ ◮ Back CloseFull Screen / Esc
Printer-friendly Version Interactive Discussion
EGU cari, F., Vesala, T., Yakir, D., and Valentini, R.: On the separation of net ecosystem exchange
into assimilation and ecosystem respiration: review and improved algorithm, Global Change Biol., 11, 1424–1439, 2005.
Ruppert, J., Mauder, M., Thomas, C., and Luers, J.: Innovative gap-filling strategy for annual sums of CO2 net ecosystem exchange, Agric. For. Meteorol., 138, 5–18, 2006.
5
Soussana, J. F., Allard, V., Pilegaard, K., Ambus, P., Ammann, C., Campbell, C., Ceschia, E., Clifton-Brown, J., Dominques, R., Flechard, C., Fuhrer, J., Hensen, A., Horvath, L., Jones, M., Kasper, G., Martin, C., Nagy, Z., Neftel, A., Raschi, A., Rees, R. M., Skiba, U., Manca,
G., Sutton, M., Tuba, Z., and Valentini, R.: Full accounting of the greenhouse gas (CO2,
N2O, CH4) budget of nine European grassland sites, Agric. Ecosystems and Environ., 121,
10
121–134, 2007a .
Soussana, J.-F., Fuhrer, J., Jones, M., and Van Amstel, A.: The greenhouse gas balance of grasslands in Europe. Agric., Ecosyst. Environ., 121, 1–4, 2007b.
Van de Wiel, B. J. H, Moene, A. F., Hartogensis, O. K., and De Bruin, H. A. R., Holtslag, A. A. M.: Intermittent turbulence in the stable boundary layer over land. Part III: a clasification for
15
annual sums of CO2net ecosystem exchange, J. Atmos. Sci., 60, 2509–2522, 2003.
Van Dijk, A. and Dolman, A. J.: Estimates of CO2uptake and release among European forests
based on eddy covariance data, Global Change Biol., 10, 1445–1459, 2004.
Van Ginkel, J. H., Whitmore, A. P., and Gorissen, A.: Lolium perenne grasslands may function as a sink for atmospheric carbon dioxide, J. Environ. Qual., 28, 1580–1584, 1999.
BGD
4, 1499–1534, 2007 Variability of annual CO2 exchange from Dutch Grasslands C. M. J. Jacobs et al. Title Page Abstract Introduction Conclusions References Tables Figures ◭ ◮ ◭ ◮ Back CloseFull Screen / Esc
Printer-friendly Version Interactive Discussion
EGU
Table 1. Site characteristics of the eight Dutch grassland sites.
Name Type Soil (FAO) Fertilizer Use Land Use Year
Haarweg WMO-Grassland Eutric gleyic Fluvisol No Mowing 2002–2005
Cabauw WMO-Grassland Eutric Fluvisol No Grazing sheep 2002–2005
Horstermeer Grassland/Wetland Eutric Histosol No Semi-natural
perma-nent grassland
2005 Fochterloo ¨erveen Natural Grassland Eutric Histosol No Natural grassland 1994–1995 Haastrecht Production Grassland Eutric Fibric Histosol Yes Intensively managed
permanent grassland
2003(July)–2004(May) Oukoop Production Grassland Fibric Eutric Histosol Yes Intensively managed
permanent grassland 2005
Stein Meadow Bird Reserve Fibric Eutric Histosol No Natural grassland 2005
Lelystad Production Grassland Calcaric Eutric Fluvisol Yes
(6 times a year)
Intensively managed permanent grassland
2004
BGD
4, 1499–1534, 2007 Variability of annual CO2 exchange from Dutch Grasslands C. M. J. Jacobs et al. Title Page Abstract Introduction Conclusions References Tables Figures ◭ ◮ ◭ ◮ Back CloseFull Screen / Esc
Printer-friendly Version Interactive Discussion
EGU
Table 2. Estimated mean and standard deviation of annual GPP, Re and NEE for all sites in the year 2005 and for Haarweg and Cabauw over the period 2002–2005.
Re (gC m−2a−1) σRe (gC m−2a−1) GPP (gC m−2a−1) σGPP (gC m−2a−1) NEE (gC m−2a−1) σNEE (gC m−2a−1) Cabauw (2002–2005) 1458 227 (15.6%) 1466 206 (14.1%) 8 276 (3422%) Haarweg (2002–2005) 1803 247 (13.7%) 2011 171 (8.5%) 208 176 (84.8%) All sites (2005) 1396 486 (34.8%) 1432 534 (37.7%) 36 207 (575%)
BGD
4, 1499–1534, 2007 Variability of annual CO2 exchange from Dutch Grasslands C. M. J. Jacobs et al. Title Page Abstract Introduction Conclusions References Tables Figures ◭ ◮ ◭ ◮ Back CloseFull Screen / Esc
Printer-friendly Version Interactive Discussion
EGU
Table 3. The mean annual sums of Rd, Gross Primary Production, GPP, and the net ecosystem exchange, NEE, for the organic and mineral soil types for 2002 until 2005.
Organic soils Mineral soils
Rd (gC m−2a−1) 1520±30 1250±30
GPP (gC m−2a−1) 1300±100 1370±100
NEE (gC m−2a−1) –220±90 90±90
BGD
4, 1499–1534, 2007 Variability of annual CO2 exchange from Dutch Grasslands C. M. J. Jacobs et al. Title Page Abstract Introduction Conclusions References Tables Figures ◭ ◮ ◭ ◮ Back CloseFull Screen / Esc
Printer-friendly Version Interactive Discussion
EGU
Fig. 1. Geographical distribution of the Dutch grassland study sites: 1 – Cabauw, 2 – Fochteloo ¨erveen, 3 – Haarweg, 4 – Haastertrecht, 5 – Horstermeer, 6 – Oukoop, 7 – Stein, 8 – Lelystad.
BGD
4, 1499–1534, 2007 Variability of annual CO2 exchange from Dutch Grasslands C. M. J. Jacobs et al. Title Page Abstract Introduction Conclusions References Tables Figures ◭ ◮ ◭ ◮ Back CloseFull Screen / Esc
Printer-friendly Version Interactive Discussion EGU 0 1 2 3 4 5 6 Cab auw Foch telo oërv een Haa rweg Haa stre cht Hor ster mee r Lely stad Ouk oopStein Mea n R0 ( µ m o l m -2 s -1 ) 0 100 200 300 400 500 600 Cab auw Foch telo oërv een Haa rweg Haa stre cht Hor ster mee r Lely stad Ouk oopStein Mea n Ea (K -1 )
Fig. 2. The ecosystem activation energy, Ea, and the reference respiration, Ro, for the various grassland stations. For the Haarweg and Cabauw sites, the standard deviations have been indicated for the four measurement years.
BGD
4, 1499–1534, 2007 Variability of annual CO2 exchange from Dutch Grasslands C. M. J. Jacobs et al. Title Page Abstract Introduction Conclusions References Tables Figures ◭ ◮ ◭ ◮ Back CloseFull Screen / Esc
Printer-friendly Version Interactive Discussion EGU 0 5 10 15 20 0 5 10 15 20 25 Air Temperature (oC) Ro ( μ m o l m -2 s -1 ) Mean Haarweg Cabauw1 Horstermeer Oukoop Stein Fochtelooerveen Haastrecht Leliestad 5
Fig. 3. The air temperature dependency of the respiration of all grassland locations along with