International and Local Aid
during the second Intifada
Riccardo BOCCO
Matthias BRUNNER
Jamil RABAH
IUED – Graduate Institute of Development Studies, University of Geneva
In collaboration with JMCC – Jerusalem Media & Communication Centre
A study funded by
INTERNATIONAL AND LOCAL AID
DURING THE SECOND INTIFADA
An Analysis of Palestinian Public Opinion
in The West Bank and The Gaza Strip
(October 2000 – February 2001)
FINAL REPORT
Geneva, March 2001
Cover photo:
Palestinians pass an Israeli army checkpoint on the main road from Ramallah to Jerusalem (March 13, 2001).
FOREWORD
The idea for this study originated in early December 2000, in the aftermath of the “UNRWA – SDC Workshop on Emergency Needs of Palestinian Refugees” held in Lausanne on 30.11 – 1.12.2000. The Swiss Agency for Development and Cooperation (SDC) felt it was timely and appropriate to run a poll in the West Bank and the Gaza Strip to better grasp the perceptions of the Palestinian population concerning the role and the impact of international and local aid during the current period of crisis.
SDC contracted the Graduate Institute of Development Studies (IUED) of the University of Geneva, Switzerland, to conduct the study. The IUED set up a small team of experts for the project, composed of Dr. Riccardo Bocco (professor of political sociology and research director at IUED), Mr. Matthias Brunner (lecturer in political science methodology at the Department of Political Science of the University of Geneva and director of CyberProjects) and Mr. Jamil Rabah (poll specialist and consultant for SDC Gaza and West Bank Liaison Office in Palestine). During the month of December the team worked on the elaboration of the questionnaire for the poll and benefited from exchanges and discussions with Prof. Elia Zureik (sociologist, Queen’s University, Canada), Mr. Jalal Husseini (researcher at the Department of Refugee Affairs, PLO, Ramallah) and Prof. Rémy Leveau (political scientist, Institut d’Etudes Politiques, Paris).
In January 2001, the JMCC (Jerusalem Media & Communication Centre) was contracted to run the poll, under the supervision of Mr. Ghassan Khatib and Ms. Manal Warrad. The draft of the questionnaire was also presented to a number of concerned parties and pre-tested for validity by the JMCC.
The results of the poll were ready by early February and the authors of this report met in Jerusalem from 10 to 17 February to examine the breakdown of the data and its tabulation. During the same week, the authors of the report also interviewed a number of concerned actors in Jerusalem, the Gaza Strip and the West Bank to get a preliminary feedback on the poll’s findings.1
The data were coded and entered by the JMCC, while the analysis and weighting of the data is the sole responsibility of the authors of the report.
Geneva, March 2001
TABLE OF CONTENTS
FOREWORD ... 1
TABLE OF CONTENTS ... 2
INTRODUCTION ... 3
METHODOLOGY ... 4
PART ONE : GENERAL DESCRIPTION OF THE SITUATION... 6
1.1-POPULATION AND REFUGEES... 6
1.2-EMPLOYMENT SITUATION... 10
1.3-MOBILITY... 15
1.4-HOUSEHOLDS... 17
1.5-MARTYRS, PEOPLE INJURED AND DAMAGE TO PROPERTY... 18
1.6-IMPACT ON CHILDREN... 21
PART TWO : ASSISTANCE DELIVERED DURING THE INTIFADA... 24
2.1-DISTRIBUTION OF ASSISTANCE... 24
2.2-TYPE AND VALUE OF ASSISTANCE... 28
2.3-SOURCE OF ASSISTANCE... 29
2.4-SATISFACTION WITH THE PROVIDED ASSISTANCE... 30
PART THREE : IMPACT OF ASSISTANCE DELIVERED AND PRIORITIES FROM PALESTINIANS‘ PERSPECTIVE... 32
3.1-INDIVIDUAL PERSPECTIVE... 32
3.2-COMMUNITY PERSPECTIVE... 37
PART FOUR : UNRWA... 42
4.1-TYPES OF ASSISTANCE PROVIDED... 42
4.2-SATISFACTION... 43
REFERENCES ... 45
LIST OF FIGURES ... 47
LIST OF TABLES... 48
ANNEX I: LIST OF EXPERTS INTERVIEWED... 49
ANNEX II: MARGINALS ... 50
ANNEX III: COPY OF THE QUESTIONNNAIRE IN ARABIC ... 73
INTRODUCTION
The questionnaire for the poll (see Annex 3 for the English version and Annex 4 for the Arabic version) was elaborated in a way that could offer data on Palestinians in the West Bank and the Gaza Strip (including refugees and non-refugees; refugees residing in camps and outside camps; rural and urban populations) on four main topics2:
- A general description of the situation allowing for assessing change in the employment situation and place of work during the past months of Intifada; the socio-economic conditions of households (number of people living in the household; people employed; number of members who lost their jobs); the impact of the crisis on Palestinian families in terms of mobility, material losses (property damaged, trees uprooted, business), as well as human suffering and losses (children, injured and martyrs).
- The assistance delivered according to type and source, as well as the Palestinians‘ satisfaction in relation to aid providers (private, public, local, international).
- The assistance needed from the Palestinians‘ perspective, both from an individual and community point of view. This section allows for measuring the perceptions of the impact of the aid delivered at the two above-mentioned levels (in five main areas: health, food, employment, education, infrastructure) as well as to better know the Palestinians‘ priorities.
- The type of assistance provided by UNRWA and the satisfaction of its beneficiaries.
2
Concerning the data collected through questions no. 5, 6, 7 and 10 of the questionnaire, they have not yet been entered and cleaned; they will be used in the future.
METHODOLOGY
A sample of 1267 Palestinians over the age of 18 were interviewed face-to face between the 25th and 29th of January 2001. Sixty-three
sampling units were randomly selected from both the West Bank (including East Jerusalem) and the Gaza Strip. Cities and regions were stratified according to population size as determined by the Palestinian Central Bureau of Statistics (PCBS).
Sampling units in towns, villages and refugee camps were selected according to simple random sampling from within a list that includes all Palestinian population concentrations. The selection was carried out in accordance to the population size of these concentrations. Each concentration was divided into units comprising one thousand people each. If a population concentration has a population of 10,000, then it is assigned ten units, accordingly it has ten chances of being randomly selected.
Sixty interviewers were then assigned to primary sampling units. Each of the interviewers was instructed to interview not more than twenty respondents. Households were selected according to a pre-defined route. Respondents were selected from within the households according to a Kish table that is an objective procedure for selecting household members. In case a respondent was not available during the interviewers’ visits, an appointment was made for a second visit.
West Bank Refugee Camps were over-sampled by 70 people in order to ensure sufficient cases for a deeper analysis of this group. The results presented hereafter are weighted to be representative of the whole Palestinian population.3
Following the donors’ request, all the results presented in the remainder of this report will be analysed in terms of:
Place of residence: The West Bank and the Gaza Strip (inside and outside refugee camps) and East Jerusalem.
Refugee Status: Refugees and non-refugees. Area of residence: Cities, villages and camps. Gender: men and women.
Age groups: 18-25 years / 26-35 years / 36-45 years / 46-60 years / more than 60 years.
3 According to random sampling, 62 persons in West Bank refugee camps should
have been interviewed. The sample of this survey included 132 West Bank camp residents. Therefore, for the results to be representative, less weight (0.497) had to be given to the surveyed West Bank camp residents, while more weight was given to the remaining interviewees (1.059). The only graphs and tables that are not weighted are those that include the category “West Bank refugee camp” as they are representative
The first two variables could have been combined into one category. In that case, however, some subgroups would have become too small for analysis (for example: non-refugees in camps). As such, it was thought more appropriate to analyse the variables of “place of residence” and “refugee status” separately.
Results were systematically tested for statistical significance at a 95% confidence level. If no differentiation is shown or mentioned, this means that there was none.
PART ONE :
GENERAL DESCRIPTION OF THE
SITUATION
The first part of this report provides a general description of the circumstances the Palestinian population are confronted with. In doing so, special emphasis is given to the four months since the start of the second Intifada4 (between late September 2000 and the end of January 2001) when a sample of 1267 Palestinians was surveyed for the purposes of this report.
After an overview of the spatial and demographic distribution of the Palestinian population and the refugees, the second section of part one will concentrate on the employment situation. The deterioration in the employment situation is one of the main problems emerging in the present crisis and is mainly an outcome of restrictions on mobility imposed upon the Palestinian population by the Israeli authorities. This will be examined in the third section. The impact of increased job losses will become clearer in the fourth section when the characteristics of the Palestinian households will be scrutinized. The consequences of the “quasi-war” situation with regard to the number of Palestinians injured or martyred and the damages inflicted on private and public property will be discussed in the fifth section. Finally, the last section of this part of the report will provide pointers that may contribute in evaluating the impact of the second Intifada on children.
Whenever possible, consideration was given to data generated from reports and surveys that were made available recently and that cover the same period of time on some issues addressed in this study.
1.1 - Population and refugees
In order to indicate the extent to which the data collected for this report are representative, it is important to compare them with some available official figures.
Projections of the Palestinian Central Bureau of Statistics (PCBS), based on the 1997 census, estimated the population residing in the Palestinian territories by mid-2000 to reach 3’150’056 people. Of those, 63.9% (2’011’768) would be living in the West Bank (including East Jerusalem) and 36.1% (1’138’288) would be residing in the Gaza Strip. (see at: www.pcbs.org).
4 The second Intifada is termed locally Intifada al-Aqsa, in reference to the visit of Mr.
Ariel Sharon to the Dome of the Rock’s complex and the beginning of the Palestinian uprising on September 29, 2000.
Figure 1, below, illustrates the geographical distribution of the sample of this study according to place of residence. Whereas PCBS estimated the proportion of West Bank Palestinians, including those living in East Jerusalem, at nearly 64%, West Bank and East Jerusalem respondents represent 63% of all respondents included in the survey conducted for this report.5
Figure 1 - Place of residence (q42 & q43)6
West Bank (not camps) 48%
West bank refugee camp 5%
East Jerusalem 10% Gaza (not camps)
24% Gaza refugee camps
12% 570 62 125 291 149
This population was oversampled by 70 people (unweighted N = 132)
According to the UNRWA figures for late June 2000, there are 1’407’631 registered refugees (RR) living in the West Bank and the Gaza Strip. The majority of the RR resides in the Gaza Strip (824’622). They constitute 78% of the Strip’s population and 54.7% of them (i.e. 451’186 people) live in eight Gaza Strip camps. In the West Bank, there are 583’009 RR and they represent 29.7% of the local population. The camp residents’ percentage (157’676 persons living in 19 camps) is lower than in the Gaza Strip and does not exceed 27% of the RR (UNRWA 2000a).
Taking into account the PCBS population projections for the year 2000, the percentage of the RR in the Palestinian territories according to
5
As explained in the methodology, West Bank refugee camps are over-sampled. Instead of interviewing 62 individuals in these locations, 132 were interviewed. Except for the results that single out the population in West Bank refugee camps, all the results presented hereafter are weighted to be representative.
6 Throughout the report, proper references are made to the questions of the survey
UNRWA is 44.7% (1’407’631/3’150’056). The percentage of RR in the sample of this report is 43%.7
Using the same calculation technique for the West Bank, the percentage of RR is 29.0% (583’0097/2’011’768), our figure is 30% while UNRWA gives 29.7%.
However, for the Gaza Strip, the estimation based on PCBS projections is 72.4% (824’622/1’138’288) and in our sample we have 64% of RR, while UNRWA gives 78%.8
Furthermore, in the PCBS surveys as well as in the sample of this report, refugees who are not registered with UNRWA and who may or may not reside in camps are included.
Comparing the sample of this report to UNRWA figures, in the West Bank 23% of RR are camp residents versus UNRWA’s figure of 27%; in the Gaza Strip 48% of RR are camp residents versus almost 55% according to UNRWA.
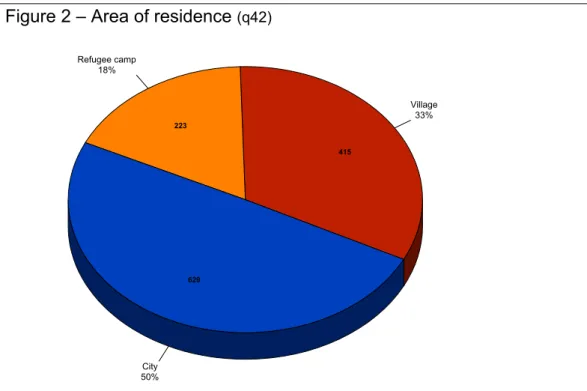
Figure 2 – Area of residence (q42)
City 50% Village 33% Refugee camp 18% 629 415 223
Taking a closer look at the areas of residence, figure 2, above, shows that approximately half of the respondents live in urban settings, one fifth in camps and one third in villages.
7 The percentage of 43% was deduced from the results of questions 1 & 4 in the
survey.
8 It should be noted that while UNRWA and PCBS figures include the population under
18 years, the sample of this report includes only people aged 18 and above. It is plausible that the percentage of population below 18 years is higher among the refugee population, especially among the camp residents. This may provide an explanation for the apparent underestimation of RR in the Gaza Strip sample of this report.
In the survey for this report, 577 women9 were interviewed. They account for 46% of the sample. According to PCBS projections for the year 2000, women account for 49.5% of the population.
Figure 3, below, illustrates the relatively young age structure of the Palestinian population surveyed. In fact, people over the age of 60 represent less than 6% of the surveyed population aged 18 and above. Figure 3 - Age groups (q38)
18-25 27% 26-35 34% 36-45 20% 46-60 13% over 60 6% 343 432 247 166 75
A comparison between PCBS data and results from the survey of this report, illustrated in table 1, indicates the proximity in the age distribution patterns.
Table 1 - Age group distribution comparison (q38)
Age Groups PCBS estimate Our sample
20-24 582'389 20.6% 251 20.6% 25-29 489'912 17.4% 222 18.2% 30-34 402'417 14.3% 197 16.2% 35-39 327'183 11.6% 161 13.2% 40-44 276'826 9.8% 118 9.7% 45-49 234'117 8.3% 80 6.6% 50-54 196'221 7.0% 56 4.6% 55-59 161'991 5.7% 37 3.0% 60+ 150'779 5.3% 95 7.8% Total 20+ 2'821'835 100.0% 1'217 100.0%
9 The gender of the respondents is specified in the answers to question 44 in the
1.2 - Employment situation
The recent crisis in the Palestinian territories has led to an increase in unemployment. This situation has put greater pressure on the breadwinners and has negatively influenced the living conditions of the Palestinians.
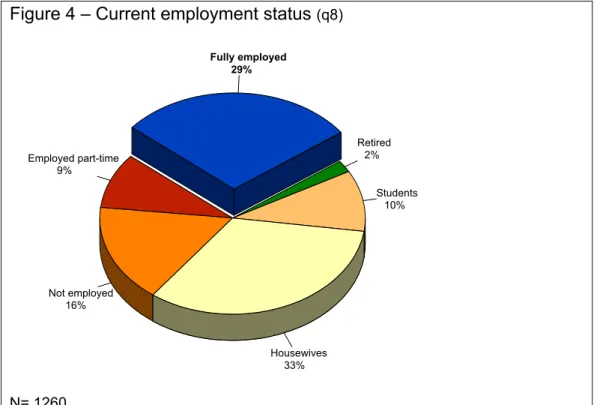
Between 1997 and the end of September 2000, the Palestinian labour market had witnessed an important employment growth. Data of PCBS indicate that the average rate of 23% of unemployment in 1996 was reduced to about 11% by mid-2000 (PCBS 2000-2001, Rabah 2000). In its recent report, UNSCO (2001) estimates that already in early October 2000, the core unemployment rate had risen from 11% to almost 30% and that, by late January 2001, 38% of the Palestinian labour force in the West Bank and the Gaza Strip was unemployed10. The results of the poll conducted for this report showed that, at the time the survey was conducted, only 29% of all Palestinians were fully employed. Figures 4 and 5, below, illustrate in further detail the current employment status of Palestinians and the place of work of the employed.
Figure 4 – Current employment status (q8)
Fully employed 29% Employed part-time 9% Not employed 16% Housewives 33% Students 10% Retired 2% N= 1260
10 The average number of unemployed people at the end of January 2001 was
estimated at 253’000 people (71’000 before the beginning of the Intifada), out of a total labor force of 662’000 persons.
When examining the number of people who are actually in the labor force11 (they constitute 55% of the sample), the survey showed that at the end of January 2001, only 53% were fully employed, 17% were partially employed, and 30% were unemployed. Although recent figures of the PCBS set the unemployment rate at 39%12, it is important to note two important points:
The survey for this report was conducted among people aged 18 and above, whilst the employment figures of the PCBS include the workers aged 15 and above.
In addition, the poll also showed that a sizeable number of people who lost their jobs during the Intifada, were able to find new jobs.
Since the survey conducted for this report is more recent than the one of the PCBS, it is safe to conclude that for some of those who lost their jobs in Israel, the employment situation may have eased due to an apparent absorption by the Palestinian labor market (in the formal or informal sectors).
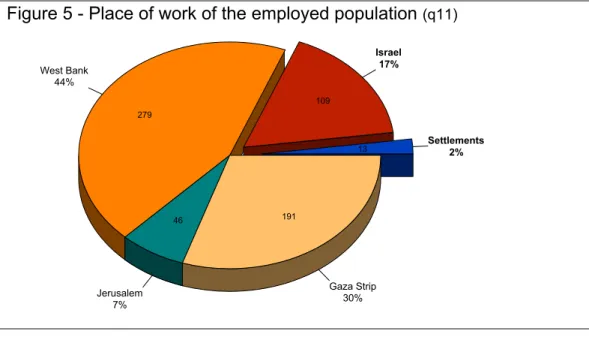
Figure 5 - Place of work of the employed population (q11)
Settlements 2% Israel 17% West Bank 44% Jerusalem 7% Gaza Strip 30% 13 109 279 46 191
When the respondents were asked about the effect of the Intifada on their employment situation, only 58% said that nothing had changed. As for the remaining 42%, some remained jobless (26%) and others found new jobs (16%).
11 Labor force excludes respondents who identified themselves as housewives, retired
persons or students. They make up 45% of the surveyed population.
12 According to the communiqué de presse given through Associated Press on
Figure 6, below, shows the effect of the crisis on Palestinian employment and the previous place of work of those who lost their jobs and remained jobless.
Although the majority of the respondents who said to have lost their jobs in the first four months of the Intifada said that they used to work in Israel or in the settlements, almost 48% of Palestinians who lost their jobs used to work in the Palestinian territories. This shows the harsh impact of the crisis on the internal Palestinian economy and the consequences it had on the social and economic conditions of the West Bank and the Gaza Strip.
Figure 6 - Impact of the second Intifada on job situation (q12 & q13) and
previous place of work (q11)
No change 58%
Had to change job 16% Lost job 26% Settlements 5% Israel 48% West Bank 22% Jerusalem 5% Gaza Strip 21%
It is also important to stress that, according to UNSCO (2001), Palestinian workers in Israel and in the settlements received, as a group, an average of US$ 3.5 millions for each working day prior to the crisis. The cumulative income loss for the period 1 October 2000-31 January 2001 has been estimated at US$ 243.4 millions.13
Although nearly one half of the people who lost their jobs used to work on Palestinian territory, the closures hit those who used to work in Israel much harder.14 Figure 7, below, shows that nearly 7 people out of 10 lost their jobs while this was the case for “only” 12% of the people in the West Bank, 15% in Jerusalem and 18% in Gaza. Job “recovery” was better in the West Bank, where more people were able to change their jobs than in the Gaza Strip.
13 The value of the internal direct losses in income-earning opportunities is estimated
at US$ 907.3 millions. For the 105 working days during the period from 1.10.2000 to 31.1.2001, the loss is approximately US$ 8.6 million per day. (UNSCO 2001)
14 According to PCBS (2000) and UNSCO (2001), an average of 130’000 Palestinians
from the West Bank and the Gaza Strip were working in Israel before the end of September 2000. In the first four months of the Intifada, the Palestinians lost over 100’000 jobs.
Figure 7 - Impact of the second Intifada on job situation (q12 & q13) by previous place of work (q11)
70% 13% 17% 17% 18% 12% Israel (N=105) West Bank (N=263) Gaza Strip (N=185)
Previous place of work
0% 10% 20% 30% 40% 50% 60% 70% 80%
Percentage of people whose employment status has changed due to Intifada Job losses Jobs changed
Concerning the employment situation for the skilled and unskilled workers, 47% versus 51% respectively lost their jobs, 22% versus 28% changed their occupation, and 32% versus 21% did not change their employment.
Figure 8 - Impact of the second Intifada on job situation (q12 & q13) by place of residence (q42 & q43)
10% 13% 14% 16% 22% 7% 33% 30% 29% 25% 23% 13% Gaza (N=157) WB - Refugee Camp (N=30)
Gaza - Refugee Camp (N=80)
Total (N=632)
West Bank (N=310)
Jerusalem (N=54)
Place of residence
0% 5% 10% 15% 20% 25% 30% 35%
Percentage of people who have changed or lost their job Changed Lost
Figure 8, above, indicates that the impact of the second Intifada on the job situation was sharper in the Gaza Strip and in West Bank refugee camps than in the remainder of the West Bank or East Jerusalem. Figure 9, below, illustrates that the Intifada affected the employment situation of the older generation more severely than that of the younger generation.
A potential explanation for these findings could be that less young Palestinians are employed inside Israel or in the settlements than their elders. More specifically, whereas a mere 16% of the 18 to 25 age group works in Israel or in settlements, 25% of the 45-60 age group do so. Incidentally, similar assumptions can be made from a gender perspective. Only 6% of the women labour force worked inside Israel and the settlements compared to 22% of the men. Moreover, more men than women lost their jobs (29% against 9%) or had to change it (18% against 9%).
Figure 9 - Impact of the second Intifada on job situation (q12 & q13) by age group (q38) 19% 15% 16% 17% 28% 23% 26% 29% 18-25 26-35 36-45 46-60 Age group 0% 5% 10% 15% 20% 25% 30%
Percentage of people who have changed or lost their job Changed Lost
The questionnaire of this report did not include questions on the strategies adopted by the Palestinian families to face the crisis. However, a poll conducted by a Birzeit University team on 8-10 February 2001 in the West Bank and the Gaza Strip among 1’200 respondents showed the main means adopted by families to cope with the harsh economic conditions. The majority of the Palestinian population surveyed said - in decreasing order of importance - that they reduced expenditures (84%); spent existing savings (55%); took a loan
(43%); asked for assistance (28%); sold wife’s dowry and wedding gifts (22%); resorted back to agriculture and raising cattle (17%); sold property (4%). (Birzeit University 2001)
Furthermore, concerning the deterioration in living conditions among Palestinians, the World Bank (2001) and the UNSCO (2001) reports suggest that by January 2001 about 1 million people in the Palestinian territories lived under the poverty line15 compared to 654’000 before the fall of 2000.
1.3 - Mobility
The second Intifada is characterized by severe border closures, internal movement restrictions and the closing of international borders which, of course, affect mobility. As UNSCO (2001) has noted: “the short term and direct economic effects of such policies are to reduce income to farmers, workers, merchants and business people who cannot reach their places of employment or who are unable to obtain inputs and/or sell their goods and services”.
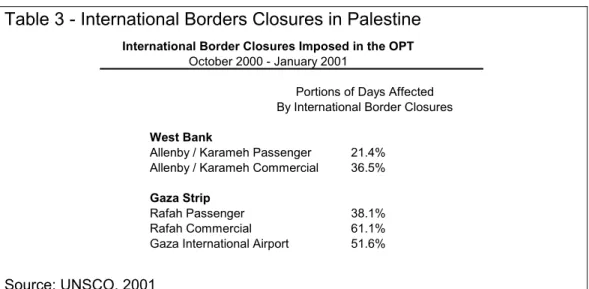
Table 2 and table 3, below, on internal closures and international border closures respectively, drawn from a recent UNSCO report, further illustrate the restrictive effects of these closures on the mobility of the Palestinian population.16
Table 2 - Internal Closures in Palestine
Internal Closures Imposed in the Occupied Palestinian Territory
October 2000 - January 2001
Portions of Days Affected By Internal Closures West Bank Partial Closure 44.4% Severe Closure 55.6% Gaza Strip Partial Closure 81.1% Severe Closure 8.7% Source: UNSCO, 2001
15 The poverty line is estimated by the World Bank at US$ 2.10 per person per day in
consumption expenditures.
16 For further details with regard to the closure of crossings in the Gaza Strip since the
Table 3 - International Borders Closures in Palestine
International Border Closures Imposed in the OPT
October 2000 - January 2001
Portions of Days Affected By International Border Closures
West Bank
Allenby / Karameh Passenger 21.4% Allenby / Karameh Commercial 36.5%
Gaza Strip
Rafah Passenger 38.1% Rafah Commercial 61.1% Gaza International Airport 51.6%
Source: UNSCO, 2001
At the time the survey was conducted for this report, a mere 2% of the respondents said that mobility had not been a problem since the beginning of the Al-Aqsa Intifada at the end of September 2000; for 19% of the interviewees mobility had posed a small problem, while for 79% mobility had been a serious problem.
The place of residence of Palestinians in the West Bank and the Gaza Strip made a significant difference as to the extent to which mobility posed a problem.
In Gaza refugee camps, 84% of the interviewees stated that mobility formed a big problem. In the West Bank, in and outside camps, this proportion amounts to 83%.
Among non-camp respondents in the Gaza Strip, the figure decreased to 72%, while in Jerusalem only 65% of the respondents believed that the lack of mobility formed a major impediment.
Although on the issue of mobility, the variable of age of the respondents made no significant difference, the gender of the respondents did. While 82% of the male respondents stated that the inability to move freely had been a serious problem, only 75% of female respondents believed so. The Birzeit University poll confirms the findings of this report and offers further detail on two specific issues related to mobility restrictions. More than 35% of the respondents in the Gaza Strip and almost 46% of those in the West Bank said that the closures seriously impeded access to health services. More than 70% of the surveyed population affirmed that mobility restrictions totally or partially obstructed access to schools and universities. (Birzeit University 2001)
1.4 - Households
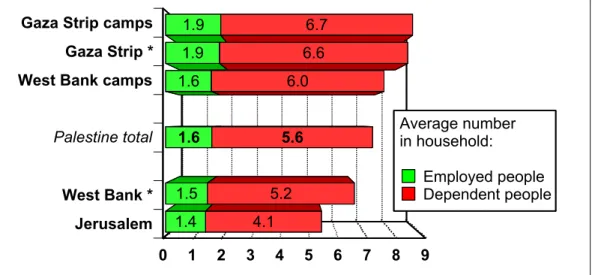
In general, households in the Palestinian territories are large. As indicated in table 4 and figure 10 below, the results of the survey reveal that the average Palestinian household is composed of 7.3 individuals. The number of household members substantially varies between the West Bank and the Gaza Strip. Whilst the average size of a West Bank family is 6.6, the average size of a Gaza Strip family is 8.5. Size of families in refugee camps in both the West Bank and the Gaza Strip is higher than that in non-camp areas. Jerusalem has the lowest number of household members with an average of 5.5 per household.
Table 4 - Household size (q14), number of people employed (q15), number of employed women (q16)
Place of residence Mean 6.6 5.1 1.5 0.2 N 570 562 535 Mean 7.7 6.1 1.6 0.2 N 132 129 113 Mean 5.5 4.1 1.4 0.4 N 123 120 109 Mean 8.5 6.6 1.9 0.4 N 291 285 176 Mean 8.7 6.8 1.9 0.4 N 148 147 89 Mean 7.3 5.7 1.6 0.3 N 1264 1243 1018 Gaza Gaza camps Total No. of employed women West Bank WB Camps Jerusalem No. of people in household No. of dependents per house hold No. of employed people
The large size of Palestinian households puts a great deal of pressure on the standard of living. The survey showed that an average of 3.56 persons depend on a single breadwinner, excluding the breadwinner (the number rises to 4.5 if the breadwinner is included). The number is about the same in the West Bank and the Gaza Strip. This could probably be explained by the fact that more women are employed per family in the Gaza Strip than in the West Bank as indicated in table 4 above.
Figure 10 - Average number of employed and dependent persons per household by place of residence
0 1 2 3 4 5 6 7 8 9
Gaza Strip camps Gaza Strip * West Bank camps Palestine total West Bank * Jerusalem 1.9 1.9 1.6 1.6 1.5 1.4 6.7 6.6 6.0 5.6 5.2 4.1 Average number in household: Employed people Dependent people
Respondents were asked to state the impact of the crisis on the wage earners in their household. The results show that in the average household, 0.57 persons lost their jobs due to the current situation. If this figure is compared to the 1.6 average workers, this gives an impressive picture of the effect of the closures on the economic situation of Palestinian households!
Respondents were also asked to state where those who lost their jobs used to work. Interestingly, some differences emerge when comparing the distribution that was reported with the one that comes out from the analysis of the working respondents (figure 6).
When the interviewees were asked about where their household members who lost their job used to work, the settlements (10% against 4%) and Israel (52% versus 48%) are over-reported. Although the figures that emerged from individual analysis can be thought of as more representative of the reality, one can notice here that job losses in Israel and the settlements were more striking to the respondents.
1.5 - Martyrs, people injured and damage to property
In addition to the severe economic and social effects of the recent crisis on the Palestinian society, the emotional and psychological conditions of the Palestinian public were also negatively affected. Most households have had to cope with the loss of a beloved one or the injury of a relative.
According to the Palestinian Ministry of Health (quoted in the UNSCO report, 2001), as of 10 February 2001, 337 Palestinians had died as a result of the confrontations and more than 12’000 had been injured. A
report made available by PHR in early November 2000 underlined the high percentage of casualties suffered by children as well as the fact that more than 50% of the injuries were related to the upper part of the body, mainly caused by live and rubber-coated metal bullets.17 More
recent reports of the Palestinian Ministry of Health confirmed these findings.18
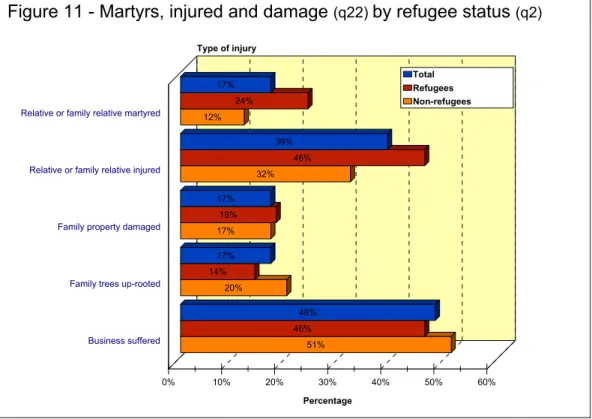
As indicated in figure 11, below, the number of respondents who had an injured relative or family member is very high. Also worth noting is that while, among the surveyed Palestinians, a higher percentage of refugees than non-refugees stated that they had relatives martyred or injured, more non-refugees than refugees suffered in their business or had their trees uprooted by the Israeli authorities.
Figure 11 - Martyrs, injured and damage (q22) by refugee status (q2)
17% 39% 17% 17% 48% 24% 46% 18% 14% 46% 12% 32% 17% 20% 51%
Relative or family relative martyred
Relative or family relative injured
Family property damaged
Family trees up-rooted
Business suffered Type of injury 0% 10% 20% 30% 40% 50% 60% Percentage Total Refugees Non-refugees
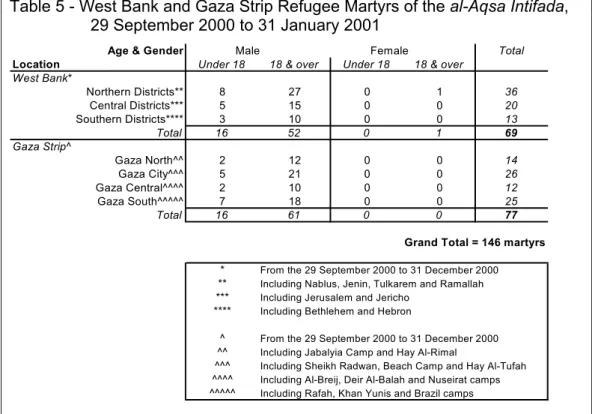
Table 5, below, drawn from a recent report prepared by BADIL (2001) provides an overview of the number of refugee martyrs in the various districts of the West Bank and the Gaza Strip. In total, 146 refugees were martyred between 29 September 2000 and 31 January 2001.
17 See also UNRWA, 2000b.
18 The serious attacks on emergency medical personnel and services are also worth
mentioning. In its reports of December 2000 and 2001, HDIP indicates the killing of one German doctor and of one Palestinian Red Crescent Society (PRCS) ambulance driver. Furthermore, according to HDIP, 64 PRCS emergency medical technicians and 18 Union of Palestinian Medical Relief Committees first aid workers (including two physicians) have been injured. 49 PRCS ambulances (72% of their fleet) were hit by live ammunition, rubber bullets, and/or stones thrown by Israeli settlers in 96 separate attacks.
Table 5 - West Bank and Gaza Strip Refugee Martyrs of the al-Aqsa Intifada, 29 September 2000 to 31 January 2001
Age & Gender Male Female Total
Location Under 18 18 & over Under 18 18 & over West Bank* Northern Districts** 8 27 0 1 36 Central Districts*** 5 15 0 0 20 Southern Districts**** 3 10 0 0 13 Total 16 52 0 1 69 Gaza Strip^ Gaza North^^ 2 12 0 0 14 Gaza City^^^ 5 21 0 0 26 Gaza Central^^^^ 2 10 0 0 12 Gaza South^^^^^ 7 18 0 0 25 Total 16 61 0 0 77
Grand Total = 146 martyrs
* From the 29 September 2000 to 31 December 2000
** Including Nablus, Jenin, Tulkarem and Ramallah
*** Including Jerusalem and Jericho
**** Including Bethlehem and Hebron
^ From the 29 September 2000 to 31 December 2000
^^ Including Jabalyia Camp and Hay Al-Rimal
^^^ Including Sheikh Radwan, Beach Camp and Hay Al-Tufah
^^^^ Including Al-Breij, Deir Al-Balah and Nuseirat camps
^^^^^ Including Rafah, Khan Yunis and Brazil camps
Source: BADIL, 2001
According to the results of the survey conducted for this report, the crisis affected Palestinians in the Gaza Strip and in the West Bank differently. As shown in table 6, Gaza Strip respondents suffered more in terms of martyrs, injured, property damage and having their trees uprooted than West Bank respondents. However, a higher number of West Bank interviewees than Gaza Strip interviewees reported that their business had suffered since the outbreak of the Intifada.
Table 6 - Impact of the crisis (q22) by place of residence (q42 & q43) PLACE OF RESIDENCE
TYPE OF INJURY WEST
BANK
WB RC JERUSALEM GAZA GAZA
STRIP RC RELATIVE MARTYRED 11% 20% 5% 27% 31% RELATIVE INJURED 28% 48% 23% 62% 44% FAMILY PROPERTY DAMAGED 17% 15% 10% 23 % 17% FAMILY TREES UPROOTED 18% 2% 6 % 28% 10% FAMILY BUSINESS SUFFERED 56% 37% 41 % 46% 34%
Incidentally, perceptions on the impact of the crisis among respondents do not differ according to gender. Furthermore, when analyzing the impact of the crisis according to the various age groups surveyed, it seemed that the youngest and eldest respondents were less aware of the general situation regarding casualties and other issues than the other respondents.
Finally, the value of damages to private and public properties (such as housing, buildings and infrastructure, shops, workshops, offices, schools, medical facilities, vehicles, agricultural land) during the first four months of the Intifada has been estimated in the tens of millions of US$. PCHR (2000, 2001a, 2001b) has accurately documented the situation in the Gaza Strip. The reports of the Palestinian Ministry of Agriculture (2001) and of PHRMG (2001) also cover the situation for the West Bank.
1.6 - Impact on Children
The devastating effects of the crisis on the Palestinian society are severely felt. As illustrated in figure 12, below, the crisis has also harshly affected the Palestinian children. Over 70% of the respondents stated that they noticed changes in their children’s behavior.
Figure 12 - Effect of the second Intifada on children (q20)
84% 82% 79% 73% 66% 62% 16% 18% 22% 27% 34% 38% Gaza camps Gaza
West Bank camps
Palestine total West Bank Jerusalem Area of residence 0% 10% 20% 30% 40% 50% 60% 70% 80% 90% percentage Children behavior Change No change
The Birzeit University survey reveals that the age group 5-14 years is the most affected by the crisis in terms of manifesting psychological problems, followed by children under 5 years. The suffering of children, though significant throughout the West Bank and the Gaza Strip, is observed higher in the Gaza Strip than in the West Bank. (Birzeit University 2001)
Figure 13, below, illustrates the type of changes the parents and the other household adults that were surveyed for the purpose of this report, have witnessed in their children as a result of the conflict. The most frequently stated change in behavior of children evolved around sleeping disorders, including nightmares and bed-wetting. Over 50% of the respondents stated that the children in their households are suffering from sleeping disturbances.
A significant number also observed other disturbances such as fear, lack of concentration, and violent behavior. Over 15% of the respondents who noticed a change in the behavior of children (son, daughter, brother, sister, etc.) said that children are having difficulties in concentration. The rest noticed multiple effects on their children since the outbreak of the Intifada, as indicated below.
Figure 13 - Nature of the effect of the second Intifada on children (q21)
Sleeping 51% Concentration 16% Fear 6% violence 4% Other 23%
sleep & fear 8% sleep & conc.
68%
sleep & vio. 4%
con & fear 10%
all 10% Sleeping disturbances include
nightmares and bed-wetting.
The results of the survey conducted for this report also indicate that refugee children seem to have suffered more than non-refugee children. Indeed, 80% of the refugee respondents reported a change in children’s behavior as a result of the crisis compared to 67% of the non-refugee respondents.
According to the results of the survey, the place of residence also had an impact on whether or not Palestinian children manifested behavioral changes. Of all respondents, 84% of Gazan refugee camp residents noticed a change in behavior in their children and 82% of the total Gaza Strip respondents did so. Similarly, 79% of West Bank refugee camp respondents reported behavioral changes in their children and 66% of total West Bank respondents did so. The perceived behavioral changes in children were the lowest among respondents from Jerusalem, with 62%.
PART TWO :
ASSISTANCE DELIVERED DURING THE
INTIFADA
The severe impact of the crisis on Palestinian society prompted many local and international organizations to deliver services for the needy. According to UNSCO, during the last quarter of 2000 more than 32% of the Palestinian population in the Occupied Palestinian Territories (i.e. more than one million people) benefited from emergency aid: “Some 340’000 persons in the West Bank and 693’000 persons in Gaza received assistance from national and international agencies. About 42.5% of the registered refugee population in the Occupied Palestinian Territories received assistance from UNRWA”. (UNSCO 2001)19
In order of importance, the main types of emergency aid consisted of: food aid, one-off cash assistance, health insurance coverage and/or distribution of household items.
Although a number of services that were delivered between October 2000 and the end of January 2001 were very effective in relieving the suffering of the Palestinian population, many services were not perceived as such by the vast majority of Palestinians. The increased efforts by the various departments of the Palestinian Authority, for example, were not necessarily considered as an extra effort. Furthermore, the provision of health and education services were rarely stated as assistance provided to the Palestinian public because, in the view of the authors of this report, such services are taken for granted and their provision is looked upon as a responsibility and as an obligation by the government towards the public.
2.1 - Distribution of Assistance
While the assistance delivered during the first four months of the new Intifada was mostly emergency aid, one should put the donors’ actions into the local context.
As a study of the JMCC (1999) has pointed out, during the past decade, the planning initiatives and efforts of international donors have constantly tried to make the bridge between development programs and the peace process. A poll run by the JMCC in the spring of 1997 revealed considerable public disenchantment with the donors’ initiatives. Cynicism about foreign aid and its distribution seemed an
19 UNSCO information is based on data available from the Palestinian Ministry of
Social Affairs, the Palestinian Ministry of Supply, the UN World Food Program, UNRWA, and the NGO World Vision International.
important conclusion in the analysis of the survey, while the PNA’s performance was rated only slightly better. From the point of view of the authors of this report, this means – inter alia – that donors’ assistance during this new Intifada is intervening in a context of disillusionment, marked both by the progressive decline of momentum in the peace process and the absence of its promised dividends, and by a lack of trust in the “peace-brokers”.
Having said that, a large portion of the sampled population stated that they did receive assistance in one form or another. As illustrated in figure 14, below, 43% of the respondents stated that they received some form of assistance. Of those respondents who said that they received assistance, 66% are refugees and 34% are non-refugees. In fact, as the sample of the survey includes 45% refugees and 55% non-refugees, this means that 64% of the refugee population surveyed in the poll has received assistance, against 27% of non-refugees.
Figure 14 - Proportion of Palestinians receiving assistance (q23) in
general by refugee status (q2)
Yes 43% No 56% Not sure 1% Refugees 66% Non Refugees 34% n=1260 n=540
Did you or your family receive assistance?
The results in figure 15, below, indicate that assistance heavily targeted refugee camps. Moreover, the results point out the almost opposite situation between refugee camps and villages with regard to receipt of assistance. Indeed, while three quarters of the respondents in the camps said they received assistance, more than 75% of the respondents in the villages stated that they did not receive any assistance.
Figure 15 - Assistance (q23) by area (q43) 76 45 23 24 55 77 Refugee Camps Cities Villages Place of residence 0 20 40 60 80 Percentage Recieved assistance: Yes No
The concentration of assistance to camps may be explained by two reasons. Firstly, the refugee camp population is certainly the most needy of assistance. Secondly, due to the “visibility” of UNRWA, many perceive it as the main source of assistance in refugee camps.
The results of the survey do not only indicate that refugee camp respondents received more assistance than city or village respondents, they also point to major differences between the West Bank and the Gaza Strip with respect to assistance distribution.
As specified in figure 16, below, the majority of Gaza’s non-refugee camp respondents received assistance, while the majority of West Bank and Jerusalem non-camp residents did not. Clearly, least assistance was distributed in Jerusalem.
This does not imply that foreign donors and/or local agencies were less inclined to provide assistance in Jerusalem and the West Bank. Indeed, when examining the provision of assistance in those areas it is essential to keep in mind the realities on the ground, such as: the topography and the size of the West Bank20; the difficulties of distributing aid, especially in villages located in areas “B” and “C”, or villages close to Israeli settlements; the difficulties created by the closure policies with the numerous road-blocks and check-points of the Israeli army; the long procedures of clearance and security checks at the international borders. In addition, with regard to Jerusalem, despite the real needs of the Palestinian population, international donors might shun from
providing major assistance in the eastern part of the Holy City in order not to further irritate the Israeli authorities. Moreover, the capacity of the various Palestinian private and public institutions in this respect is limited by their inability to provide direct support to Jerusalem residents because of Israeli restrictions.
Figure 16 - Assistance (q23) by place of residence (q42 & q43)
Gaza camps Gaza Strip WB camps West Bank Jerusalem
Area 0 10 20 30 40 50 60 70 80 90 100 Percentage Recieved assistance:
Yes No Don't Know
In conclusion, a comparison between the results on distribution of assistance and the results presented in part one of this report, demonstrates that the assistance provided seems coherent with the needs, at least according to place of residence. As discussed earlier in the report, the crisis had a sharper impact in the West Bank’s and the Gaza Strip’s refugee camps in the following aspects:
employment ;
the number of the dependent people for one worker ; martyrs and people injured ;
2.2 - Type and value of assistance
The survey showed that of those respondents who confirmed that they received aid, the majority received food assistance followed by financial aid. As figure 17, below, illustrates, 72% of assistance provided was in the form of food and 24% in the form of financial assistance.
Figure 17 -Type of assistance during the first four months of Intifada (q24)
Food 72% Other 2% Financial aid 24% Non-financial aid 2% Medication 15% Clothing 38% Fuel 8% Employment 38% 45% (214) of food assistance is from UNRWA. 76% of financial assistance is said to have come from the Palestinian Authority
Figure 18 - Average value of assistance received by type (q24)
117 863 116 855 240 Food assistance Financial assistance Clothing Employment Medication Type of assistance 0 200 400 600 800 1000
Value in Shekels (1$=4.1 Shekels)
The average should be around 600 shekels but the value is higer because one respondent received around 40,000 in assistance
When respondents were asked to assess the value of the provided assistance, the average value of food came at a little less than 30 US$. Figure 18, above, provides a picture as to the perception of recipients with regard to the value of the assistance provided.
Surprisingly, many respondents have failed to mention received benefits such as health care and education. Possibly, and as indicated earlier, respondents perceived such assistance as an obligation by service providers that should be delivered irrespectively of whether or not there is an emergency situation. In any case, as will be discussed later, the sampled population were generally satisfied with the delivery of health and educational services.
2.3 - Source of assistance
Not unexpectedly, the United Nations Relief and Works Agency for Palestine refugees (UNRWA) was identified as the main single source of assistance, followed by the Palestinian Authority. Whilst it is acknowledged that the efforts and services of the above organizations are supported by various local and international organizations, it is safe to conclude that most respondents know only the direct provider. Only few have mentioned the efforts and assistance of non-government organizations, or international organizations as shown in figure 19 below.
Figure 19 - Source of assistance (q24)
UNRWA 45% Palestinian Authority 17% Religious Org. 18% Relatives/Friends 4% Arab countries 3% Charitable orga. 6% Others 7% International organizations NGOs Political factions Red Crescent Popular committees
2.4 - Satisfaction with the provided assistance
The respondents were asked to affirm their level of satisfaction with assistance in two different manners. First, they were asked to state their level of satisfaction with assistance in general, and, second, they were requested to specify their level of satisfaction with assistance they themselves benefited from.
Regarding the level of satisfaction with assistance in general, respondents were relatively negative. As indicated in figure 20, of the respondents who stated that they received assistance, only 30% said that they were satisfied or very satisfied with the provided assistance. The remaining 70% of the respondents evaluated aid provision negatively.
When examining the question of satisfaction with assistance in general according to different subgroups, there were no significant differences in the responses to this question according to the refugee status of the respondents, their gender or their age. However, a significant difference in the evaluation of assistance in general was found depending on the place of residence of the respondents. Almost 62% of the respondents in Jerusalem said they were at least satisfied, compared to only 25% of their colleagues in the West Bank agreeing. In the Gaza Strip, a mere 34% of the respondents in refugee camps and 30% of non-camp respondents were either very satisfied or satisfied with the general state of assistance provision.
Figure 20 - Satisfaction with the assistance provided
(q25 & q24 for food and financial aid)
2 2 5 28 44 53 37 33 30 33 21 12 General Perception Food assistance Financial assistance Type of assistance 0 10 20 30 40 50 60 70 80 90 100 Percentage Very satisfied Satisfied Disatisfied Very disatisfied n=522 n=422 n=136
Regarding the level of satisfaction with assistance respondents themselves benefited from, the evaluation became somewhat more positive. More specifically, and as illustrated in figure 20, above, 46% of the respondents who received food assistance were at least satisfied with it and 58% of the respondents who benefited from financial assistance were either satisfied or very satisfied.
Although the positive attitude towards financial assistance was expected, one could argue that the less positive evaluation of food assistance stems from the feeling that other forms of assistance are more appropriate and constitute a priority for the Palestinian public. Part three of this report will address this issue and the attitudes of the sampled population towards what kind of assistance is needed.
PART THREE :
IMPACT OF ASSISTANCE DELIVERED AND
PRIORITIES FROM PALESTINIANS‘
PERSPECTIVE
In the second part of the report, it became clear that the Palestinian public did not always evaluate the assistance distributed by the various service providers positively. This could be a consequence of the public’s perception that the provided assistance does not fully answer the main needs and priorities of the community as a whole or on an individual level. This perception will be the object of the analysis in part three of this report.
3.1 - Individual perspective
Figure 21, below, indicates that of all the respondents who confirmed not to have received any assistance, 63% stated that they were in need of it, 30% affirmed that they did not need assistance and 6% said that they were not sure whether or not they were in need of assistance.
Figure 21 - Need of assistance (q26) for the population [total and by
refugee status (q2)]who did not benefit from aid
71% 24% 5% 63% 31% 6% 59% 34% 7%
Yes No Not sure
Would you need assistance ?
0% 10% 20% 30% 40% 50% 60% 70% 80% Percentage Refugees Total population Non-refugees
Moreover, it becomes clear from figure 21, above, that 71% of the refugees who did not receive any assistance stated that they were in need of it. This percentage falls to 59% among the non-refugee population.
Figure 22, below, indicates that the need for assistance for those who did not receive any differs according to the place of residence of the respondents. In the West Bank, 80% of camp respondents indicated their need for assistance compared to only 49% of Gaza camp residents.
In fact, whereas in the West Bank, more camp respondents than non-camp respondents affirmed their need for assistance, the opposite is true for the Gaza Strip where respondents living outside camps stated more frequently than their colleagues residing in camps that they were in need of assistance.
Figure 22 - Need of assistance (q26) by place of residence (q42 & q43)
80% 16% 4% 67% 23% 10% 66% 28% 6% 47% 50% 3% 43% 53% 4%
Yes No Not sure
Would you need assistance ? 0% 10% 20% 30% 40% 50% 60% 70% 80% Percentage WB - refugee camps Gaza West Bank Gaza - refugee camp Jerusalem
N=923
Figure 23, below, compares the most important needs of the total sample of the survey with those of the respondents who said they were in need of assistance. When looking at the responses of the total sample, the four main needs in order of importance are: financial needs (24%), political and security needs (23%), employment (21%), and food (8%). When looking at the responses of the respondents who said they
were in need of assistance, the three main needs in order of importance are: Financial needs (34%), employment (18%), political and security needs (15%), and food (14%). From the comparison of the above figures, three main deductions can be drawn:
1. Although financial need is the priority for both the total sample and those respondents who said they were in need of assistance, it was even more valued for the latter than for the former.
2. Although the need for employment is the second priority for the respondents who affirmed their need of assistance and only the third priority for the total sample, the percentage of respondents selecting employment as a need in the total sample is higher than among respondents who said they were in need of assistance.
3. Although food is the fourth priority for both the total sample and those respondents who said they were in need of assistance, it was even more valued for the latter than for the former.
Figure 23 - Most important need for oneself (q27) in general and for
those who say they need assistance (q26)
24% 21% 23% 8% 6% 5% 4% 4% 1% 4% 34% 18% 15% 14% 5% 5% 2% 3% 1% 3% Financial Work Politicial needs Food Services Health Education Developing economy Infrastructure Others 0% 5% 10% 15% 20% 25% 30% 35% 40% Total population
Those who need assistance
including helping the old, housing Including end to restrictions and personal security
Including the environemnt
When comparing the most important needs of the respondents according to area of residence, as illustrated in figure 24, below, financial needs, political needs and need of food are proportionally higher among respondents from cities and villages than among respondents from refugee camps. However, the need for employment was a priority for a significantly higher proportion of camp respondents than respondents from villages and cities.
Figure 24 - Most important need from individual perspective (q27) by area of residence (q43) 22% 22% 24% 8% 19% 29% 20% 6% 32% 15% 24% 11% Financial Work Politicial needs Food 0% 5% 10% 15% 20% 25% 30% 35% 40%
City Camp Village
N=584 (city) / 215 (camp) / 356 (village)
Focusing further on the topic of financial needs, respondents were asked how much money they would need for their household to meet their basic life necessities. The responses averaged at 2733 shekels, and half of the respondents said that they need 2500 shekels or less. The results in table 7, below, illustrate that the sampled respondents did not overestimate their needs. In fact, by multiplying the average number of people employed in an average sized household by the average income of an employed individual, a number close to the above-mentioned figure can be reached.
A breakdown of the sample according to refugee status did not reveal any significant differences between refugee respondents and non-refugee respondents as to the monthly income necessary to meet basic needs. However, a breakdown according to place of residence, as
specified in table 7, did disclose that respondents in Jerusalem and West Bank refugee camps estimated the average monthly income needed to meet ends higher than the respondents in other places of residence.
Although not indicated in a table, it is worth noting that respondents who affirmed their need of assistance, estimated the monthly income to cover basic necessities lower (2568 NIS, N=579) than those who stated that they did not receive any assistance (3017 NIS, N=272).
Table 7 - Monthly income needed (q42) by place of residence (q42 & q43)
Location Average Shekels needed per month Number of respondents Jerusalem 3894 123
West Bank camps 3071 123
Gaza Camp 2750 148
Gaza Strip 2568 287
West Bank 2528 560
Total 2733 1245
median=2500 min=100 max=20000
Respondents were also asked how close their present income is to 3000 shekels. The results in table 8, below, indicate that less than 9% of the sampled respondents have a higher household income than the one necessary to meet basic life necessities. Even by including the respondents with revenue close to 3000 shekels, there are still about 70% of the interviewees unable to meet their household’s basic needs.
Table 8 - Household income (q29)
Household income Percentage N
Much higher than 3000 shekels 3% 34
Little higher than 3000 shekels 6% 74
About the same 20% 247
Little less than 3000 shekels 24% 298
Much less than 3000 47% 587
A breakdown of the total sample according to refugee status reveals that 77% of the refugee respondents compared to 68% of the non-refugee respondents have a household income that does not suffice to meet basic necessities. Analysis on this issue according to place of residence, illustrated in figure 25, below, accentuates the dire financial needs in refugee camps as 82% of the sampled refugee camp households have a monthly income that is either a little or much less than 3000 Shekels.
Figure 25 - Household income (q29) by place of residence (q42 & q43)
64% 20% 12% 53% 27% 12% 48% 25% 20% 47% 25% 21% 27% 19% 31%
Much less Little less About the same
Household income comapred to 3000
0% 10% 20% 30% 40% 50% 60% 70% 80% Percentage
Gaza - refugee camp WB - refugee camps West Bank Gaza Jerusalem
3.2 - Community perspective
Only 16% of the respondents know of a project that was carried out in their community since al-Aqsa Intifada started. This proportion is about 20% among the refugees, but only 12% among the remainder of the population.
As figure 26 below indicates, emergency assistance was visible to approximately one third of the respondents living in Gaza camps compared to only 6% of those living in Jerusalem. This confirms some of the previous findings in this report.
With a more general area analysis, visibility of assistance reaches 26% in refugee camps, however, with great variation between the Gaza Strip and the West Bank. Emergency assistance was visible to about 13% of the respondents in villages and to 14% of those in the cities.
Those in the sample who knew about a project had to name it. 187 persons described a project in an open response. This small number does not permit a detailed analysis, however the most cited project was “fixing roads” (32% of the answers); followed by “building and renovating schools” (15%); “building medical centers and clinics (13%); “unemployment” (9%); and “infrastructure” (8%).
Figure 26 - Visibility of assistance (q30) projects by place (q42 & q43)
32%
20%
12% 12%
6%
Gaza - refugee camp Gaza WB - refugee camps West Bank Jerusalem 0% 5% 10% 15% 20% 25% 30% 35%
% who know of a project carried out in their community since Intifada
In an open question, the interviewees were asked what, in their opinion, is the most important need for their community. As specified in figure 27, below, 22% of the respondents mentioned job opportunities as the most needed relief for their community, followed by 16% who stated that health related relief is the most important need. Surprisingly, the need for relief that boosts the morale and self-esteem of the population was cited more frequently than the need for food and financial assistance. A closer analysis on the issue of relief needed by the community according to refugee status reveals that 25% of the refugee respondents compared to 20% of the non-refugee respondents considered job creation as the most important need for their community. However, the need to boost the morale within the community was valued higher by the surveyed non-refugees than by the surveyed refugees (16% against 10%).
A breakdown of the results on relief needed by the community according to the place of residence of the respondents points to some interesting variations in opinions.
Figure 27 – Relief needed by your community (q34) 22% 16% 13% 10% 9% 9% 5% 4% 3% 2% Job opportunities
Health (medical courses, treatment, building healt
Boosting the morale, unity, stability
Food
Financial assistance
Education
Improving the regions and organizing the environme
Infrastructure (electricty, paving roads, sewage s
Improving and developing economy
Political measures (lifting the siege, ending the
0% 5% 10% 15% 20% 25%
Figure 28 – Relief needed by your community (q34) by place of
residence (q42 & q43) 17% 25% 12% 12% 12% 9% 10% 18% 15% 15% 12% 13% 15% 9% 49% 2% 3% 11% 32% 7% 7% 9% 7% 7% 29% 9% 6% 8% 9% 8% Job opportunities Health Moral status Food Financial assistance Education 0% 10% 20% 30% 40% 50% West bank WB - Refugee Camp Jerusalem Gaza
As illustrated in figure 28, above, a very high percentage of Jerusalemite respondents, 49%, considered the need to boost the morale of the community a priority. The need to create job opportunities in the community was higher valued among respondents in the Gaza Strip than among their colleagues in the West Bank and in Jerusalem. Health related relief was a much more important need for West Bank respondents than for respondents in Jerusalem and the Gaza Strip. The respondents were also asked to evaluate various types of assistance according to their level of importance and effectiveness. As indicated in table 9, below, assistance in employment generation was rated as highly important by 81% of the respondents. Assistance in health related areas was considered highly important by 73% of the respondents, followed by 71.6% of the respondents who stated that assistance in the field of education was highly important. Aid in terms of food distribution came in fourth with 64.5% of the respondents deeming it to be highly important. Only 45.3% of the respondents rated assistance in the domain of infrastructure as highly important and it is, as such, the least important issue under study.
Assistance was evaluated relatively poorly in terms of its effectiveness. Assistance in health related areas was rated most positively with 50.7% of the respondents stating that it was at least effective, followed by 44.2% of the surveyed public evaluating assistance in the field of education as such. Only 22.1% of the interviewees said that aid related to food distribution was either very effective or effective. Assistance in the field of infrastructure and especially aid in employment generation were evaluated very negatively. Over 88% of the respondents felt that assistance in the domain of infrastructure was either not very effective or not effective at all. Assistance in job creation, which was rated the highest in terms of its importance, was considered by 96.1% of the respondents as either not so effective or not effective at all.
Table 9 - Importance (q35) and effectiveness (q35) of the assistance
Importance (%) Very high High Medium Low Very low N
Education 71.6 23.0 4.3 0.7 0.3 1260
Health 73.0 22.1 3.6 1.0 0.3 1261
Food distribution 64.5 24.1 8.7 1.9 0.7 1259
Employment generation 81.0 11.7 2.8 2.3 2.1 1260
Infrastructure 45.3 26.9 19.3 6.1 2.4 1227
Effectiveness (%) Very effectively Effectively Not so eff. Not eff. at all N
Education 7.5 36.7 47.1 8.8 1249
Health 12.1 38.6 37.6 11.6 1249
Food distribution 2.5 19.6 47.2 30.8 1219
Employment generation 1.4 2.5 28.0 68.1 1234
Infrastructure 1.3 10.1 41.4 47.2 1146
It is worth noting that the relatively better evaluation of assistance both in health related areas and in the field of education might have been a reflection of some positive initiatives taken during the crisis in those
domains. The Palestinian Ministry of Education has implemented a decentralization plan that has allowed for a reduction in problems of mobility caused to students and teachers by the closures’ policies of the Israeli authorities. As for health assistance, the work of the PRCS and its mobile clinics, the role of the Ministry of Health and the hospitals, -despite the inconveniencies created by the Israeli army - have all proved very efficient in their mission.
A breakdown of the results according to refugee status on the level of importance of assistance does not reveal any major differences in opinion between refugees and non-refugees. As for the effectiveness of assistance, non-refugees seem to evaluate most types of assistance more positively than refugees, with the exception of health related aid. Table 10 contains a breakdown of the results according to place of residence on the level of importance and effectiveness of assistance. It shows, for example, that more frequently health assistance was perceived to be effective in Gaza refugee camps than in other places.
Table 10 - Importance (q35) and effectiveness (q35) of the assistance by
place of residence
% who think it is important Education Health Food Employment Infrastructure
West Bank - non RC % 94.0 92.9 86.3 89.9 66.1
N 567 566 568 565 542 WB - Refugee Camp % 87.4 84.6 82.3 91.6 66.4 N 127 130 130 131 119 Jerusalem % 94.4 96.8 86.9 93.6 81.0 N 125 125 122 125 121 Gaza - non RC % 96.2 98.6 92.4 96.2 75.9 N 290 290 289 290 291
Gaza - Refugee Camp % 97.3 99.3 94.6 96.6 82.6
N 149 149 149 149 149
Total % 94.3 94.5 88.3 92.7 71.9
N 1258 1260 1258 1260 1222
% who think it is effective Education Health Food Employment Infrastructure
West Bank - non RC % 53.5 42.5 21.4 5.6 13.2
N 561 560 552 558 508 WB - Refugee Camp % 43.8 39.1 22.3 8.5 9.8 N 128 128 130 129 112 Jerusalem % 40.8 45.5 6.7 2.7 9.3 N 120 123 105 111 86 Gaza - non RC % 29.9 57.4 24.8 1.4 11.8 N 291 289 286 288 289
Gaza - Refugee Camp % 39.9 77.7 29.7 1.4 6.8
N 148 148 148 148 147
Total % 44.2 50.1 22.0 4.1 11.4
N 1248 1248 1221 1234 1142
Finally, it is interesting to note that the respondents to the Birzeit University poll were rather negative concerning the question of distribution of food and cash aid to those who deserve it. More than 60% of the population surveyed in the West Bank and almost 50% in Gaza, answered that this kind of assistance did not target the needy (Birzeit University 2001).