Population genetic structure of Mycosphaerella graminicola
and Quinone Outside Inhibitor (QoI) resistance
in the Czech Republic
Jana Drabešová&Pavel Ryšánek&Patrick Brunner& Bruce A. McDonald&Daniel Croll
Accepted: 23 August 2012 / Published online: 14 September 2012 # KNPV 2012
Abstract Damage caused by the wheat pathogen Mycosphaerella graminicola increased rapidly during the last two decades in the Czech Republic. We col-lected isolates from naturally infected fields in seven wheat-growing locations and analysed these using eight microsatellite markers. All markers were highly polymorphic. We found a high degree of genetic di-versity and low clonality within all sampled Czech populations. We identified 158 unique multilocus hap-lotypes among 184 isolates. Field populations showed weak genetic structure but we detected more differen-tiation between climatic regions within the Czech Republic. We compared the Czech field populations to populations from the United Kingdom, Germany and Switzerland and found a marked differentiation between Czech populations and Western European populations. We hypothesize that decades of different agricultural practices, including the use of different wheat cultivars, may explain this genetic differentia-tion. We detected a rapid increase in QoI fungicide resistance during the sampling period from 2005 to 2011, coinciding with the widespread application of this class of fungicides in the Czech Republic. M.
graminicola populations in the Czech Republic under-went a rapid adaptive evolution from sensitivity to resistance similar to what was described earlier in Western Europe.
Keywords Septoria tritici . Migration rates . Eastern Europe . Fungicide resistance
Introduction
Mycosphaerella graminicola (Fuckel) Schröt. in Cohn is a haploid, heterothallic ascomycete and the causal agent of Septoria tritici blotch (STB) on wheat. The anamorph, Septoria tritici Roberge in Desmaz., was first described by Desmazières in France in 1842 (Desmazières1842), but the sexual stage M. gramini-cola was not connected with the anamorph until more than a century later (Sanderson 1972). The complex para- and polyphyletic nature of the Mycosphaerella genus was recently reorganized and a new genus was created to accommodate Septoria-like species found on graminicolous hosts under the new genus name Zymoseptoria (Quaedvlieg et al. 2011). Hence, Mycosphaerella graminicola was proposed to be renamed Z. tritici.
M. graminicola has a worldwide distribution and causes significant yield loss in many wheat-growing areas of the world (Eyal 1999), including the Czech Republic. M. graminicola propagates both by asexual pycnidiospores and by sexually produced ascospores DOI 10.1007/s10658-012-0080-8
J. Drabešová
:
P. RyšánekDepartment of Plant Protection, CULS Prague, 165 21 Prague, Czech Republic
P. Brunner
:
B. A. McDonald:
D. Croll (*) Institute of Integrative Biology, ETH Zurich, 8092 Zurich, Switzerlandthat play a major role in shaping the genetic structure of populations (Chen and McDonald1996; Zhan et al. 2003). Equal distribution of both mating type idio-morphs (MAT1-1 and MAT1-2) was found in most populations worldwide, consistent with ubiquitous sexual reproduction (Waalwijk et al. 2002; Zhan et al.2002b; Siah et al.2010). Knowledge of the genetic structure of pathogen populations provides important insight into the evolutionary processes that shaped populations in the past and may allow prediction of the evolutionary potential of the pathogen. Knowledge of evolutionary principles can inform disease manage-ment in agricultural ecosystems (e.g., McDonald and Linde2002a). Fungal populations with high levels of genetic variation are more likely to adapt rapidly to fungicides or overcome host resistance than popula-tions with less genetic variation. For instance, the cultivar‘Gene’ was highly resistant to M. graminicola when it was released but became susceptible only 5 years after exposure to field populations of the pathogen (Cowger et al. 2000). Knowledge of the evolutionary potential of a pathogen may allow us to predict a pathogen’s response to different control strat-egies and develop new approaches for sustainable disease management (McDonald and Linde2002b).
Populations of M. graminicola have been charac-terized using a variety of molecular markers: RFLP markers were used for global studies (Linde et al. 2002; Zhan et al.2002b; Jürgens et al.2006); Razavi and Hughes (2004) assessed genetic variability of Canadian populations using RAPD markers; and pop-ulations in Germany, the USA and Iran were charac-terized using AFLP markers (Schnieder et al. 2001; Kabbage et al.2009; Abrinbana et al.2010). Owen et al. (1998) described the first nine microsatellite markers in M. graminicola. Almost 100 additional microsatellite markers were identified later using an EST sequence database (Goodwin et al. 2007). In recent years, several M. graminicola population genet-ic studies were performed using mgenet-icrosatellite markers (Banke and McDonald2005; El Chartouni et al.2011; Gurung et al.2011; Boukef et al.2012).
Population genetic studies from different geograph-ical regions showed that the genotypic diversities of M. graminicola field populations are very high and that there is little genetic differentiation among pop-ulations within a region, suggesting significant ho-mogenizing gene flow (Schnieder et al. 2001; Linde et al. 2002; Zhan et al. 2003; Banke and McDonald
2005). As exceptions, some genetic differentiation w a s fo u nd be t w ee n p o pu l a t i on s s am pl e d i n California, Indiana, Kansas and North Dakota (Kabbage et al.2009; Gurung et al.2011) and strong differentiation was found among populations sampled from different wheat-growing provinces in Iran (Abrinbana et al. 2010). In the latter case, a high genetic diversity could be consistent with the hypoth-esis that M. graminicola adapted to wheat during the domestication process in the Fertile Crescent approx-imately 10,000 years ago (Stukenbrock et al. 2007). The pathogen is thought to have dispersed throughout the wheat-growing areas of the world during the spread of agriculture. An analysis of populations of sister species of M. graminicola found on wild grasses in Iran suggested that the speciation pro-cess was not only associated with host adaptation but also accompanied by significant genetic differ-entiation (Stukenbrock et al. 2007).
Major European wheat cultivars vary widely in Septoria tritici blotch resistance (STB). The durability of major Stb resistance genes is doubtful in the ab-sence of appropriate breeding strategies and disease management. Quantitative resistance is likely to be more durable than single-gene resistance but it involves more complex breeding strategies. A success-ful application of quantitative resistance breeding for M. graminicola resistance was recently demonstrated by Risser et al. (2011). In the absence of useful resis-tance, fungicide treatment is the main control measure to manage STB. Two major categories of fungicides have been used against STB: quinone outside inhib-itors (QoI), also known as strobilurins, and sterol demethylation inhibitors (DMIs), also known as azoles. In addition, benzimidazole (or MBC) fungi-cides were used. The most recent fungifungi-cides include multisite fungicides, such as chlorothalonil, and SDHI fungicides inhibiting the complex II. QoI fungicides act by inhibiting the mitochondrial respiration by binding at the Qo site of the cytochrome bc1 complex, blocking electron transfer and disrupting the energy cycle within the fungus (Barlett et al. 2002). QoI fungicides were first used in 1996 but resistant M. graminicola strains emerged rapidly and spread throughout many European countries (Fraaije et al. 2005). In most fungal pathogens, QoI resistance is conferred by a single point mutation in the mitochon-drial cytochrome b gene leading to an amino acid change (Gisi et al. 2002). The amino acid glycine at
codon 143 is replaced by alanine in resistant strains of M. graminicola. Interestingly, the G143A mutation emerged independently in different genetic and geo-graphic backgrounds (Torriani et al.2009).
Wheat is the most important cereal in the Czech Republic. The damage caused by M. graminicola in-creased rapidly during the last two decades, leading to severe yield losses (Šíp2003). The main control strat-egy against M. graminicola in the Czech Republic is the application of fungicides. The application of stro-bilurin fungicides on cereals increased rapidly be-tween 2000 and 2008 (according to data from the State Phytosanitary Administration). Based on obser-vations from other European M. graminicola popula-tions (Fraaije et al.2005; Torriani et al.2009), a rapid emergence of resistant strains is expected in the Czech Republic due to extensive use of QoI fungicides dur-ing the past decade. However, no population genetic data are currently available to support this hypothesis. The first objective of this study was to analyze the genetic structure of M. graminicola populations across different agriculturally important regions of the Czech Republic. The second objective was to assess the frequency of QoI-resistant genotypes in Czech popu-lations and to determine the extent and origin of the QoI resistance. So far, many M. graminicola studies focused on populations collected from Western European countries. Here, we provide the first popu-lation genetic study from the Czech Republic, an Eastern European country that has experienced very different agricultural practices due to its political history.
Material and methods
Sampling and DNA extraction
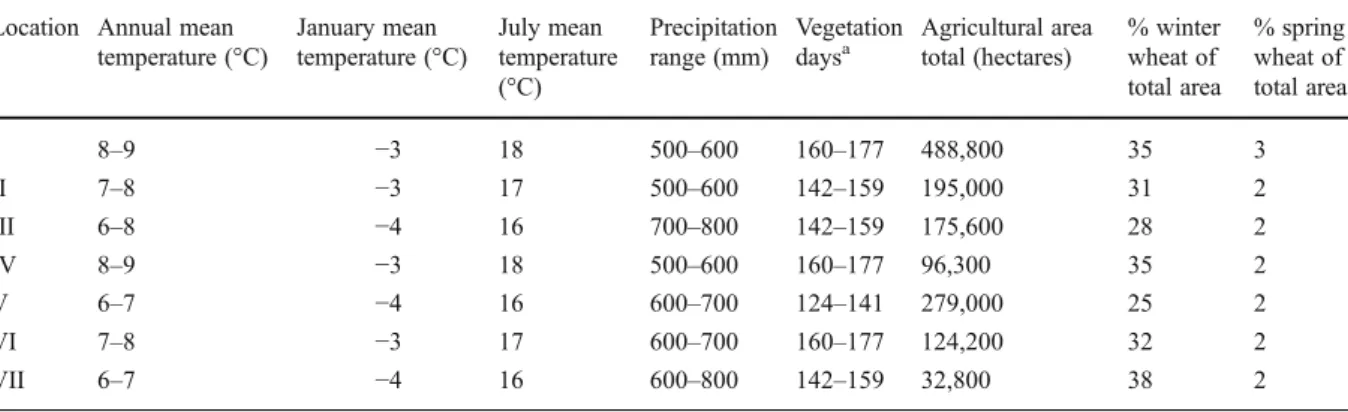
A total of 192M. graminicola isolates was collected from seven geographical locations in the Czech Republic (Fig.1a, Table1). Two locations (I and IV) consisted of fields with small-scale experimental plots, while the others were conventional agricultural fields. Locations I and IV were not treated with fungicides prior to sampling but the other locations were treated with fungicides. The different locations varied in ele-vation and amount of precipitation. Eleele-vation ranged from 220 m (IV) to 530 m (V) above sea level. Locations I, II, and IV are in drier and warmer regions,
while locations III, V, VI, and VII are in regions with higher humidity and lower temperature (Table 1). Samples were collected using a transect sampling scheme in each field. Distances between samples were 2 m in small-scale plots and 10 m in normal fields. From each field, we collected ~30 leaves. Different fields within one location were ~5 km apart. All fields were naturally infected by M. graminicola and infected leaf tissue was taken from different wheat cultivars. In three cases more than one strain (3–5) was isolated from one lesion, otherwise each strain was obtained from a different plant. The number of strains isolated per population varied between 23 and 40. Ninety six isolates were collected during the years 2005–2009. In 2011 an additional 96 samples were isolated from two populations (IV and V) already sampled in the 2005–2009 collection, and two new populations (VI and VII) were added.
Air-dried wheat leaves were surface-sterilized using a routine disinfection technique (70 % ethanol for 10 s, 0.5 % sodium hypochlorite solution for 60 s and rinsed in distilled water for 10 s) and placed into Petri dishes containing wet filter paper. Petri dishes were incubated at 18 °C for 48 h to induce oozing of spore-containing cirri. A sterile needle was used to transfer the contents of pycnidia onto new Petri dishes containing yeast malt dextrose agar broth (YMDA; 4 g of yeast extract, 4 g of maltose extract, 4 g of dextrose, 15 g of agar, 1 l of distilled H2O). After incubation at 18 °C for 1–
2 weeks, one colony per dish was randomly selected and plated on a fresh YMDA plate. After an additional 2 weeks of incubation at 18 °C, the cultures were harvested by gently scraping with a sterile spatula. The harvested spores were used immediately for DNA extraction.
Mycelia of M. graminicola isolates (~100 mg) were frozen in liquid nitrogen and ground to a fine powder with mortar and pestle. DNA was extracted using the established CTAB extraction protocol (Schnieder et al. 1998). The DNA concentration of each sample was adjusted to 25 ng/ml and samples were stored at −20 °C.
Microsatellite analyses
Template DNA was amplified with eight microsa-tellite markers (TCC_09, AC_01, CCA_03, GGC_01, AG_11, GT_03, AG_06 and TCC_08; Goodwin et al. 2007). PCR reaction volumes of
20 μl contained 0.5 μM of each primer (one was labelled with a fluorescent dye), 0.25 mM of dNTPs, reaction buffer and 0.04 U of Taq polymerase (Fermentas, Mont-sur-Lausanne, Switzerland). PCR amplification was carried out using a thermal cy-cler (Biometra, Göttingen, Germany) with the
following conditions: initial denaturation at 96 °C for 5 min, followed by 35 cycles of 96 °C for 30 s, 53 °C for 30 s, 72 °C for 30 s, and a final extension at 72 °C for 5 min. Amplified fragments were separated on an ABI capillary sequencer (Life technologies, Carlsbad CA, USA) using 50 km VII I VI II I V IV III Poland Slovakia Austria Germany 2011 2009 I II III IV V VI VII 2008 2007 2006 2005
a
b
black: proportion QoI-resistant isolates grey: proportion QoI-sensitive isolates
sampling location
Bohemia Ore Mountains
Giant Mountains
Bohemian Forest Moravia
Jeseníky
Fig. 1 a Geographical locations of sampled Mycosphaerella graminicola field populations in the Czech Republic. Within circles, roman numerals indicate the population number. Bold names indicate mountain ranges and higher elevation areas in
the Czech Republic. b Frequency of QoI resistance alleles in M. graminicola populations in the Czech Republic sampled during the years 2005–2011. Pie areas within one sampling year are proportional to the sample size
Table 1 Average annual temperatures and precipitation in each sampling location of the Czech Republic. Data obtained from the Czech Hydrometeorological Institute. The extent of the
agricultural area in each region is indicated including the per-centage of winter and spring wheat
Location Annual mean temperature (°C) January mean temperature (°C) July mean temperature (°C) Precipitation range (mm) Vegetation daysa Agricultural area total (hectares) % winter wheat of total area % spring wheat of total area I 8–9 −3 18 500–600 160–177 488,800 35 3 II 7–8 −3 17 500–600 142–159 195,000 31 2 III 6–8 −4 16 700–800 142–159 175,600 28 2 IV 8–9 −3 18 500–600 160–177 96,300 35 2 V 6–7 −4 16 600–700 124–141 279,000 25 2 VI 7–8 −3 17 600–700 160–177 124,200 32 2 VII 6–7 −4 16 600–800 142–159 32,800 38 2 a
GeneScan-500 LIZ as internal size standard (Life Technologies, Carlsbad CA, USA).
Mating type determination
The mating type idiomorphs were determined by a multiplex PCR amplification using MAT1-1 and MAT1-2 primer pairs corresponding to the two idio-morphs of the MAT locus (Waalwijk et al.2002). Each 25μl PCR reaction contained 0.5 μM of each of the four primers, 0.25 mM of dNTPs, reaction buffer and 0.04 unit of Taq polymerase (Fermentas, Mont-sur-Lausanne, Switzerland). PCR amplification was car-ried out using a thermal cycler (MJResearch PTC-200; Bio-Rad, Hercules CA, USA) with the following con-ditions: initial denaturation at 94 °C for 3 min, fol-lowed by 35 cycles of 94 °C for 30 s, 68 °C for 30 s, 72 °C for 60 s and final extension at 72 °C for 10 min. PCR products were separated on a 1 % agarose gel in 1X TBE buffer at 100 V for 1 h. Isolates carrying the MAT 1-1 allele could be scored by a specific 340 bp PCR product and isolates carrying the MAT1-2 allele by a specific 600 bp PCR product.
Detection of QoI fungicide resistance genotypes
Detection of the QoI resistance A143 allele was per-formed using a PCR-RFLP technique described by Torriani et al. (2009). Amplification of the mitochon-drial cytb gene was followed by a restriction digestion with the enzyme SatI (Fermentas, Mont-sur-Lausanne, Switzerland). Digestion products were separated on agarose gels as described above. Resistant isolates carrying an A143 allele generated three restriction fragments (298 bp, 210 bp and 144 bp) and sensitive isolates with a G143 allele generated two restriction fragments (442 bp and 210 bp).
Fungicide resistance assays based on mycelial growth
We tested the effect of carrying different QoI resis-tance alleles on mycelial growth. We randomly select-ed three isolates carrying the QoI-resistant allele each from a different population (III, V, VI). In addition, we randomly selected 12 isolates carrying the QoI-sensitive allele. These isolates were selected from all seven populations. We used 5μl of a calibrated spore suspension (100 spores/μl) to inoculate YMA plates containing 0.5 mM salicylhydroxamic acid (SHAM)
in order to control for the effect of a potential alterna-tive respiration pathway. In the fungicide assay plates, we added 1 ppm of technical grade azoxystrobin (Amistar, Syngenta, Prague, Czech Republic). Both the SHAM and azoxystrobin were dissolved in meth-anol. The final concentration of methanol in the media was 0.3 % v/v for all treatments. Each isolate was replicated three times per plate and all plates were replicated three times. The inoculated YMA plates were incubated in the dark at 20 °C for 14 days.
Population genetic analyses
Raw electropherograms from the capillary sequencer were scored with GeneMapper 4.0 software (Life tech-nologies, Carlsbad CA, USA). Isolates showing iden-tical alleles for all eight loci within populations were considered clones and only a single representative haplotype was used for subsequent analyses. The Geno Dive 2.0 software (Meirma ns an d Van Tienderen2004) was used to calculate allele frequen-cies, Nei’s genotypic diversity (G), gene diversity (H) and the fixation index (GST) of Nei (1973) for each
population. We used the χ2 statistic to test for even distribution of MAT1-1 and MAT1-2 alleles in the populations. Randomness of associations among microsatellite loci was tested by measuring the index of association IA using LIAN 3.5 (Haubold and Hudson2000).
Genetic differentiation and gene flow among European populations
To obtain a broader picture of the population genetic relationships among European populations, we includ-ed microsatellite data from a recent study by Boukef et al. (2012). This study included samples from three major wheat-growing regions in Western Europe: Great Britain (n032), Germany (n 032) and Switzerland (n032), typed using the same eight microsatellite loci as the Czech populations. We used the hierarchical analysis of molecular vari-ance (AMOVA) implemented in GenoDive 2.0 to determine the degree of genetic differentiation among populations and among countries of origin. We used the Bayesian algorithms implemented in the software STRUCTURE (Pritchard et al. 2000) to identify population structure without predefined enti-ties. Initial runs with 20 replicates for groups of K01
to 15 consisted of a burn-in period of 5000 and a Markov chain Monte Carlo (MCMC) sampling of 50,000 generations. We identified the most likely number of groups by plotting theΔK values according to Evanno et al. (2005), which determines the second-order rate of change in the distribution of the L(K) values. We repeated the analyses for the most likely K values with a burn-in of 500,000 and a MCMC sam-pling of 1,000,000.
Estimates of recent migration rates were performed with the software BayesAss (version 3; Rannala and Yang 2003). The Bayesian approach estimates the inferred posterior mean of m, the proportion of geno-types in a population composed of migrants over the last few generations. We used the following priors to perform the MCMC. The mixing parameter for allele frequencies was initially set to 0.3 and the mixing parameter for inbreeding coefficients was set to 0.1. We allowed for a burn-in of 1,000,000 iterations and a MCMC sampling of 10,000,000 iterations. We veri-fied that the large log-probability fluctuations were restricted to the burn-in phase and that during the MCMC sampling no major oscillations occurred bias-ing parameter estimates.
In addition to the estimates of recent migration rates, we used the maximum-likelihood approach implemented in the software MIGRATE-N (version 3.2.16; Beerli 2011) to estimate historic migration rates. We encoded the haploid data as diploids with one phase as missing values, according to the soft-ware’s instructions. The starting values for the migra-tion rates were estimates based on pairwise FST. We
employed 10 short chains and three long chains with a burn-in phase of 10,000 trees for each chain and a four-temperature, adaptive heating scheme. To ac-count for the mutation mode at microsatellite loci, we set the parameters to account for a Brownian mutation model for microsatellite locus mutations. The Brownian mutation model closely follows the classic stepwise mutation model but is less computa-tionally costly.
Results
Genetic diversity and structure of Czech populations
All microsatellite loci were polymorphic. The total number of alleles was 74 and the number per
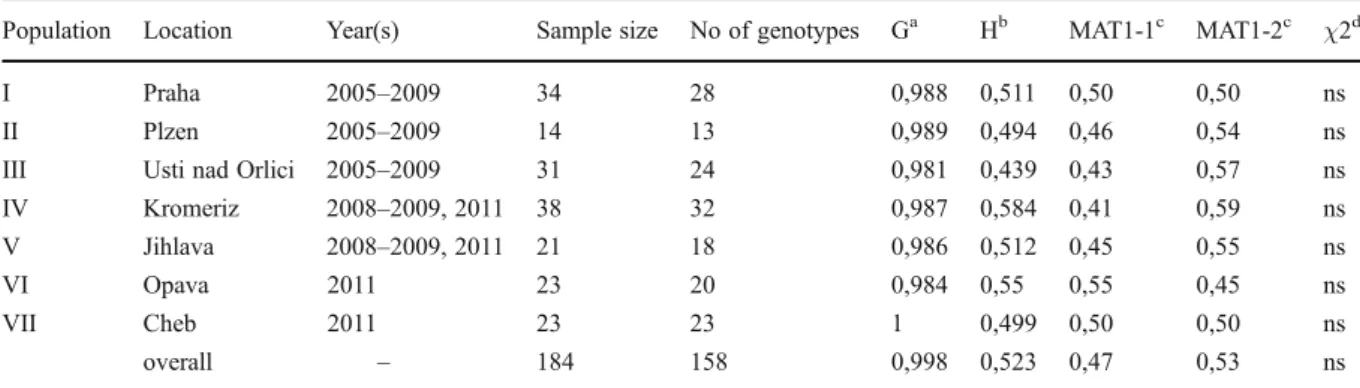
locus ranged from 4 (TCC-08) to 14 (GGC-01). Eight isolates that did not amplify for more than two loci were removed from the data set. In total, we included 184 isolates in the analyses and found 158 unique multilocus haplotypes. 17 clones were found within lesions or field populations but nine haplotypes were shared among different popula-tions. In two cases identical haplotypes had differ-ent mating types and were therefore not considered clones. Six haplotypes occurred multiple times in different populations during the same sampling year. Furthermore, we found four haplotypes at the same site multiple times but in different sam-pling years. The most frequent haplotype was shared among five populations (I, III-VI). The genotype diversity was highest in population VII (n023 unique haplotypes) and lowest in population III (n024 unique haplotypes). Nei’s measure of gene diversity per population ranged from 0.44 to 0.58 (Table 2).
We found low genetic differentiation among Czech populations. Pair-wise comparisons among populations are given in Table 3. The highest genetic differentiation was found between popula-tions I and VIII (GST00.07, p00.001). We found
no significant effect of geographic distance on the genetic differentiation among pairs of populations (Mantel test; Z-statistic054.597, p 00.601). AMOVA analyses showed that 97.6 % of genetic variation could be explained by differences among individuals within field populations and 2.4 % by differences among populations. We found higher differentiation after forming two groups of popula-tions representing either more humid or drier regions of the Czech Republic (hierarchical GST0
0.03, p00.004).
Mating type distribution and sexual reproduction
The PCR amplification of the mating type idiomorphs p r o d u c e d s i n g l e a m p l i c o n s i n a l l i s o l a t e s corresponding to either MAT1-1 or MAT1-2. In the clone-corrected set of isolates, 47 % were MAT1-1 and 53 % were MAT1-2. The ratio of mating type idiomorphs calculated individually for each popula-tion did not differ significantly from the expected 1:1 ratio (Table 2). We detected no significant deviation from random marker association based on the stan-dardized index of association.
Genetic differentiation of Czech populations compared to Western Europe
The analysis of genetic differentiation including pop-ulations from Germany, Great Britain, Switzerland and the combined Czech populations showed that 3.2 % (p00.001) of the total genetic variance was explained by country of origin. A further 1.7 % (p00.009) of the total genetic variance was explained by variation among Czech populations. We found no shared hap-lotype between Western European and Czech populations.
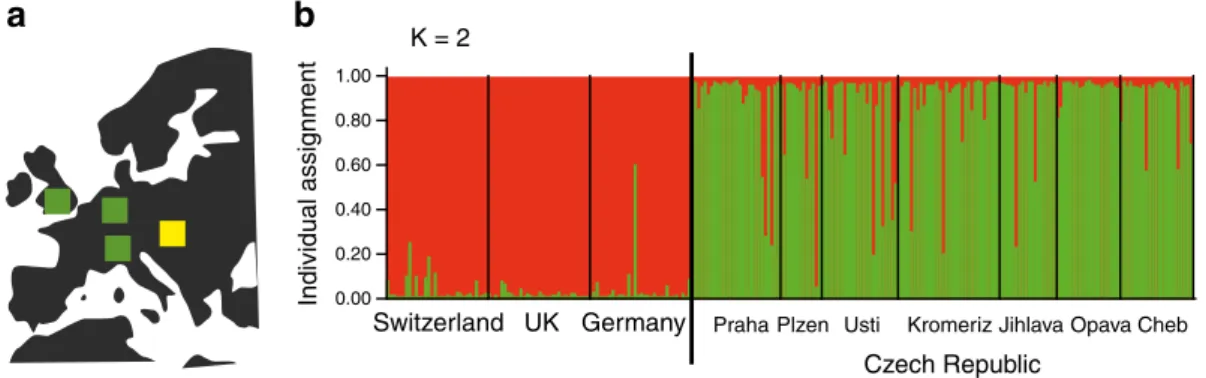
We performed Bayesian analyses of population structure without prior assumptions using the software STRUCTURE. We determined that K02 was the low-est number of groups supported by a high ΔK value. This assignment closely grouped the populations from Switzerland, United Kingdom and Germany into one group and all Czech Republic populations into the
second group (Fig.2b). All Czech populations showed some isolates with high posterior probability assign-ments to the Western European populations while one German isolate showed a high posterior probability of being assigned to the Czech population.
We estimated recent migration events using BayesAss. The MCMC sampling showed no major oscillations and auto-correlation over the sampling iterations, indicating good convergence for the migra-tion rates. Significant migramigra-tion was found from Germany and the United Kingdom to Switzerland, but this migration was asymmetrical as Switzerland contributed very few migrants to the United Kingdom and Germany (Table 4). Migration from Germany, Switzerland and the United Kingdom into the Czech Republic was relatively low, ranging between 0.71 % and 3.38 %, but all migration rates were significantly different from 0. Similarly, we detected low rates of migration from the Czech Republic into Western Table 2 Population genetic summary of the sampled populations of Mycosphaerella graminicola in the Czech Republic based on eight microsatellite markers
Population Location Year(s) Sample size No of genotypes Ga Hb MAT1-1c MAT1-2c χ2d
I Praha 2005–2009 34 28 0,988 0,511 0,50 0,50 ns
II Plzen 2005–2009 14 13 0,989 0,494 0,46 0,54 ns
III Usti nad Orlici 2005–2009 31 24 0,981 0,439 0,43 0,57 ns IV Kromeriz 2008–2009, 2011 38 32 0,987 0,584 0,41 0,59 ns V Jihlava 2008–2009, 2011 21 18 0,986 0,512 0,45 0,55 ns VI Opava 2011 23 20 0,984 0,55 0,55 0,45 ns VII Cheb 2011 23 23 1 0,499 0,50 0,50 ns overall – 184 158 0,998 0,523 0,47 0,53 ns a
Nei’s genotypic diversity
bNei’s gene diversity c
MAT1-1 and MAT1-2: frequency of mating types
dχ2 test for deviation from a 50:50 ratio (p<0.05), ns: non-significant.
Table 3 Population differentia-tion measured by GST(above the
diagonal) among the seven Czech M. graminicola popula-tions with p-values below the diagonal. Asterisk indicate sig-nificant p-values with a sequen-tial Bonferroni correction (α00.05)
GST/p-value I II III IV V VI VII
I – −0.01 −0.01 0,03 0 0.02 0.07 II 0,76 – −0.03 0 −0.03 −0.01 0,05 III 0,63 0,95 – 0,03 0 0,03 0,04 IV 0,03 0,56 0,03 – 0.01 −0.02 0,04 V 0,44 0,91 0,60 0,25 – 0.01 0,04 VI 0,08 0,58 0,05 0,97 0,30 – 0.02 VII 0,00* 0,02 0,02 0,00* 0,02 0,07 –
European (0.78– 3.69 %). Within the Czech Republic, we found a high contribution of immigrants to the Kromeriz population (IV) from all other Czech pop-ulations (20.78–24.76 %). This migration was very asymmetrical as opposing migration rate estimates were small, all ranging from 0.81 to 0.84 %.
Historical migration rates were estimated based on the maximum-likelihood estimates implemented in MIGRATE-N. We pooled all Czech populations and estimated the long-term migration rate M (scaled by the mutation rate) between Czech Republic and the three Western European populations. We found moderate levels of historic gene flow among the four major sampling locations within Europe (Fig. 3). Gene flow was generally similar to the estimated mutation rate (M01). Significant asym-metric gene flow was detected both from Germany into Czech populations and from the United Kingdom into Czech populations.
QoI resistance in Czech populations
We found no resistant alleles at the QoI locus in the 32 isolates sampled prior to 2007. The first QoI resistance alleles were found in the sample collected in 2007 from the Usti nad Orlici population where six out of 10 isolates (60 %) carried the A143 resistance allele. Samples collected in neighbouring regions in 2008 showed a frequency of the A143 allele of 35 %. The most recent collection from 2011 showed the highest frequency of resistant isolates in all populations (av-erage 42 %), with the Jihlava population being com-pletely resistant (Fig.1b, Table5).
We performed a QoI sensitivity assay with azoxy-strobin on three isolates carrying the QoI-resistant allele and 12 isolates carrying the QoI-sensitive allele. We found a consistent association with azoxystrobin sensitivity and the QoI-sensitive allele, as all tested isolates carrying the QoI-sensitive allele showed no mycelial growth at 1 ppm azoxystrobin (Fig. 4). Isolates carrying the QoI-resistant allele showed my-celial growth at the same azoxystrobin concentration.
Discussion
Our microsatellite analyses found a high degree of genetic diversity and low clonal fractions within all Czech M. graminicola populations. Both mating types of M. graminicola were found at equilibrium frequen-cies in all populations and no significant deviation from random association was found for the marker loci. Few haplotypes were shared among different populations. These findings are in agreement with previous studies, which revealed high genetic diversi-ty in natural field populations across major wheat-producing areas worldwide (Zhan et al. 2003, 2002a). Our findings indicate that Czech populations of M. graminicola most likely experience frequent sexual reproduction. Regular sexual recombination is thought to allow a pathogen to adapt more rapidly to its environment, including the deployment of resistant host cultivars or new classes of fungicides (McDonald and Linde2002b).
Czech M. graminicola populations showed very weak genetic differentiation. This is in agreement with 1.00 0.80 0.60 0.40 0.20 0.00 Switzerland UK Germany Czech Republic Plzen Usti
Praha Kromeriz Jihlava Opava Cheb K = 2
a
b
Individual assignment
Fig. 2 Analysis of population structure using Bayesian individ-ual assignment to clusters. a Schematic map of the sampling locations in the United Kingdom, Germany and Switzerland (green squares) and the Czech Republic (yellow square). b
Posterior probability of the individual assignment to two clus-ters (K02) showing the groupings Western Europe and the Czech Republic
relatively low levels of differentiation reported earlier in Western European populations (Schnieder et al. 2001; El Chartouni et al. 2011), as well as globally (Zhan et al. 2003). We detected an increased genetic differentiation between different climatic regions. However, geographic distance may also play a role in the observed differentiation, despite the lack of a significant isolation-by-distance effect among pairs of populations. M. graminicola generally causes more serious damage in wet and colder regions (Eyal et al. 1985). Thus, the genetic differentiation between the drier and more humid regions of the Czech Republic may reflect local adaptation to differences in fungicide applications, climate or wheat cultivars. Evidence for asymmetrical gene flow between populations was also found within the Czech Republic, with a much higher indicated influx of migrants into population IV (Kromeriz) compared to the other Czech populations. Kromeriz is located in the warmest and driest region of the Czech Republic and is also home to an important cereal breeding station. We hypothesize that the ob-served asymmetry of gene flow may be associated with the movement of infected seeds or plant material from around the country into this breeding station.
In general, little differentiation has been found among M. graminicola populations worldwide (Zhan et al. 2003). But stronger population structure was observed in France (El Chartouni et al.2011), between California, Kansas, Indiana and North Dakota in the USA (Kabbage et al.2009; Gurung et al.2011) and in Iran (Abrinbana et al.2010). Local adaptation to cli-mate and agricultural practices were proposed as explanations for the French and USA populations, while the elevated population structure and genetic diversity in the Iranian populations are consistent with the proposed centre of origin of M. graminicola in the Fertile Crescent (Stukenbrock et al. 2007). Even though genetic structure data are available for M. graminicola for many geographical regions, compar-ing the results of different studies can be problematic. Differences in the nature and number of molecular markers, the level of detected polymorphism and the statistical methods used for data analyses can make comparisons of different studies impractical. Different genetic markers are known to produce different levels of genetic structure for the same samples (see, e.g., Nybom 2004). A comprehensive analysis including the full geographic range of M. graminicola popula-tions based on the same marker (e.g., microsatellites)
T able 4 Migration rate estimates (% of the population composed of recent immigrants) by BayesAss between all Czech Republic populations and the three W ester n European populations of Mycosphaer ella graminicola with 95 % confidence intervals indicated in parentheses Source of migrants Destination of migrants Czech Republic Switzerland UK Germany Praha Plzen Usti Kromeriz Jihlava Opava Cheb Switzerland 89.73 (3.48) 0.86 (0.83) 0.86 (0.84) 0.93 (0.90) 0.85 (0.83) 0.84 (0.83) 3.38 (2.98) 0.84 (0.81) 0.84 (0.82) 0.87 (0.84) UK 26.22 (2.15) 67.49 (0.80) 0.71 (0.70) 0.71 (0.70) 0.71 (0.69) 0.72 (0.70) 1.29 (1.16) 0.71 (0.69) 0.72 (0.70) 0.72 (0.70) Germany 26.18 (2.14) 0.72 (0.70) 67.50 (0.80) 0.72 (0.70) 0.71 (0.69) 0.71 (0.69) 1.32 (1.16) 0.71 (0.70) 0.72 (0.70) 0.72 (0.70) Praha 2.23 (2.00) 0.78 (0.75) 0.77 (0.75) 67.58 (0.87) 0.77 (0.75) 0.78 (0.76) 24.76 (2.76) 0.78 (0.75) 0.77 (0.75) 0.78 (0.75) Czech Plzen 2.41 (2.24) 1.22 (1.17) 1.22 (1.16) 1.22 (1.18) 68.25 (1.46) 1.23 (1.18) 20.78 (3.57) 1.22 (1.17) 1.22 (1.16) 1.23 (1.17) Republic Usti 1.99 (1.76) 0.87 (0.84) 0.86 (0.83) 0.87 (0.84) 0.87 (0.84) 67.71 (1.00) 24.21 (2.72) 0.87 (0.83) 0.87 (0.84) 0.87 (0.84) Kromeriz 3.69 (2.72) 0.82 (0.81) 0.83 (0.80) 0.84 (0.80) 0.82 (0.79) 0.81 (0.80) 89.75 (3.24) 0.81 (0.80) 0.83 (0.80) 0.82 (0.80) Jihlava 1.91 (1.90) 1.02 (0.98) 1.03 (0.99) 1.03 (0.98) 1.02 (0.98) 1.02 (0.98) 22.98 (3.12) 67.94 (1.20) 1.02 (0.98) 1.03 (0.98) Opava 1.30 (1.21) 0.96 (0.92) 0.95 (0.91) 0.96 (0.93) 0.97 (0.93) 0.96 (0.93) 24.13 (2.60) 0.96 (0.93) 67.85 (1.10) 0.96 (0.91) Cheb 1.70 (1.49) 0.88 (0.85) 0.88 (0.85) 0.87 (0.84) 0.87 (0.84) 0.86 (0.84) 24.47 (2.59) 0.88 (0.85) 0.87 (0.84) 67.72 (1.00)
would be a key step in better understanding the vari-able levels of population structure found in some geographic regions. A fundamental issue in accu-rately estimating dispersal rates in wind-borne organisms is the turbulent nature of wind dispersal. Dispersal in wind-borne organisms is, hence, sig-nificantly shaped by a power-law behaviour at the tail end of the distribution and more appropriate statistics for genetic differentiation should be ap-plied (see, e.g., Wingen et al. 2007).
Based on the microsatellite analyses, Czech popu-lations showed a marked differentiation compared to Western European populations (Switzerland, Great Britain and Germany). Within Western Europe, we observed very weak population differentiation. Genetic differentiation between populations may arise neutrally through reduced migration or through local adaptation. Very recent gene flow (over the past few generations) was detected mostly from Germany and the United Kingdom into the Swiss population. The
1.49* 0.65 1.02 0.91 1.42* 0.76 0.59 0.95 1.19 1.13 Czech Republic Switzerland Germany United Kingdom Fig. 3 Maximum-likeli-hood estimates of historic migration rates among the Czech Republic (treated as a single population), Switzer-land, Germany and the United Kingdom. The numbers above the arrows indicate the directional mi-gration rate M (scaled by the mutation rate). Asterisks in-dicate significant asymmet-rical gene flow as per a separation of the 95 % confidence intervals of the maximum likelihood esti-mates of the migration rate M
Table 5 Summary of all isolates of Mycosphaerella graminicola in each sampling location assayed for the G143A QoI fungicide-resistance mutation
Location 2005 2006 2007 2008 2009 2011
Total no Resistant Total no Resistant Total no Resistant Total no Resistant Total no Resistant Total no Resistant
I 9 0 12 0 6 0 6 2 5 2 – – II – – 5 0 4 0 – – 5 0 – – III 3 0 3 0 10 6 4 3 11 7 – – IV – – – – – – 9 0 1 0 30 23 V – – – – 1 1 – – 2 1 20 20 VI – – – – – – – – – – 23 6 VII – – – – – – – – – – 23 16
Czech populations showed higher genetic differentia-tion and reduced levels of recent gene flow compared to those in Western Europe. However, historic gene flow was asymmetrical from the United Kingdom and Germany into the Czech Republic. Gene flow origi-nating from Germany and the United Kingdom into Switzerland and the Czech Republic may partially be explained by the large differences in wheat production among the different countries. Germany and the United Kingdom produced 24.11 million metric tons (MMT) and 14.88 MMT in 2010, respectively (FAOstat2012). Switzerland and the Czech Republic produced 0.52 and 4.16 MMT, respectively. Large wheat producing areas may provide large source pop-ulations for M. graminicola spore dispersal.
Among the possible reasons for the distinct Czech populations may be the long period of collective farm-ing (1950–1990) imposed by the socialist regime. Agricultural fields were collectivized after the Second World War and during this process German and French wheat cultivars were replaced by cultivars originating mostly from Eastern Europe. Effective re-placement of susceptible cultivars may have been slow compared to Western European agricultural practice due to ineffective, centralized planning. Furthermore, following the velvet revolution in 1993, Czech agri-culture experienced a decline due to ownership changes (Swinnen et al. 2009). To further elucidate the impact of the very different agricultural practices in the Czech Republic on M. graminicola populations, other Eastern European countries should be included
in future comparative studies. An informative compar-ison would include collections from Slovakia and Poland as these countries had similar agricultural prac-tices during the last century.
Two non-exclusive hypotheses may explain the emergence and spread of QoI resistance in the Czech Republic. Either the fungicide resistance emerged through gene flow from Western European tions that acquired QoI resistance earlier than popula-tions in the Czech Republic, or the QoI resistance emerged independently in the Czech Republic. We found that M. graminicola populations underwent a rapid shift from almost complete sensitivity to almost complete resistance to the QoI class of fungicides within 6 years. Strobilurin fungicides were first sold in the Czech Republic in 1997. The application of strobilurins increased from 5,700 kg in 2000 to 18,700 kg in 2007 and to 31,700 kg in 2011 (State Phytosanitary Administration, 2012). Strobilurins are currently applied to approximately 90 % of the wheat fields (State Phytosanitary Administration, 2012). Hence, the rapid increase in QoI-resistant alleles, tracks the rise in strobilurin application across the Czech Republic. The first occurrence of resistant strains was most likely in the Českomoravská vrcho-vina region (populations III and V). This region is situated at relatively high elevation and receives higher amounts of precipitation than other regions. These are favorable conditions for most leaf pathogens and significant yield losses caused by M. graminicola were first reported from this region. Consequently, Fig. 4 In vitro QoI fungicide sensitivity assay. Two isolates
carrying the QoI-sensitive allele and one isolate carrying the QoI-resistent allele are shown. Each isolate was replicated three
times on each plate. The left image represents a YMA plate containing 1 ppm azoxystrobin and the right image shows a control YMA plate
more frequent fungicide treatments were most likely applied by affected farmers, thereby selecting for re-sistant strains that were already present but at a low frequency. Populations I and IV were sampled from small experimental field plots that had never been treated with fungicides in the years prior to our sam-pling. The high frequency of resistant isolates found in these fields suggests that resistant genotypes were immigrants from neighbouring treated fields, likely a result of wind-dispersed ascospores. A complicating factor in effective containment of QoI resistance is that the G143A mutation seems to incur no fitness cost to the fungus (Gisi et al. 2002). Therefore, a pathogen population gaining QoI resistance through a selective sweep imposed by applications of QoI fungicide is likely to maintain the resistance even after fungicide application is reduced or stopped entirely.
The emergence and rapid increase in frequency of QoI-resistant haplotypes was already reported in Western Europe (Fraaije et al. 2005). The resistance emerged independently in different genetic back-grounds and geographical regions and spread rapidly through wind dispersal of ascospores (Torriani et al. 2009). The historic asymmetric gene flow from Western Europe may have introduced QoI-resistant alleles into Czech populations. The significant levels of gene flow among populations in the Czech Republic would likely have contributed to the rapid subsequent spread of QoI resistance to the different regions once QoI resistance was established in the Czech Republic. However, two factors suggest that QoI resistance may have independently arisen in the Czech Republic. First, recent gene flow was more constrained between Western Europe and the Czech Republic, making it less likely that QoI-resistant alleles spread quickly from neighbouring countries. Second, the QoI-resistant alleles were first detected in the central region of the Czech Republic (locations III and V) and subsequently found in the neighbouring location I. This suggests that QoI resistance may have emerged and spread from the centre of the Czech Republic to the periphery. However, our collections do not contain isolates from all locations from the earlier sampling years and we may have missed some earlier emergence of QoI resistance. The current fun-gicide application strategy for Czech wheat fields con-sists of 1-2 applications of a combination of azoles and QoI fungicides (Jan Kazda, pers. comm.). However, the rapid emergence of QoI resistance casts doubt on
the effectiveness of such fungicide treatments to con-tain STB. Broad resistance screening of European wheat cultivars (e.g., Schilly et al.2011) may provide a more sustainable containment strategy for STB. Furthermore, a switch to modern combinations of multi-site and SDHI fungicides may help to contain yield losses.
Our analyses revealed a low degree of genetic differentiation among Czech populations and con-firmed frequent sexual reproduction of the pathogen. Moderate differentiation was observed between Western European populations and the Czech Republic suggesting that differences in wheat cultivars and agricultural regime affected population structure. QoI resistance emerged later than in Western Europe and may have been an independent event. As else-where, the resistance rapidly increased in frequency spread across regions.
Acknowledgments We would like to thank Lubomír Věchet for providing some of the isolates used in this study. This work was financially supported by a Ministry of Agriculture grant (QH 81284) from the Czech government. Data analyzed in this paper were partly generated in the Genetic Diversity Centre of ETH Zurich.
References
Abrinbana, M., Mozafari, J., Shams-bakhsh, M., & Mehrabi, R. (2010). Genetic structure of Mycosphaerella graminicola populations in Iran. Plant Pathology, 59, 829–838. Banke, S., & McDonald, B. A. (2005). Migration patterns
among global populations of the pathogenic fungus Mycos-phaerella graminicola. Molecular Ecology, 14, 1881– 1896.
Barlett, D. W., Clough, J. M., Godwin, J. R., Hall, A. A., Hamer, M., & Parr-Dobrzanski, B. (2002). The strobilurin fungi-cides. Pest Management Science, 58, 649–662.
Beerli, P. (2011). Migrate-N, version 3.2.16. Retrieved on March 1, 2012, fromhttp://popgen.sc.fsu.edu/Migrate. Boukef, S., McDonald, B. A., Yahyaoui, A., Rezgui, S., &
Brunner, P. C. (2012). Frequency of mutations associated with fungicide resistance and population structure of Mycosphaerella graminicola in Tunisia. European Journal of Plant Pathology, 132, 111–122.
Chen, R. S., & McDonald, B. A. (1996). Sexual reproduction plays a major role in the genetic structure of populations of the fungus Mycosphaerella graminicola. Genetics, 142, 1119–1127.
Cowger, C., Hoffer, M. E., & Mundt, C. C. (2000). Specific adaptation by Mycosphaerella graminicola to a resistant wheat cultivar. Plant Pathology, 49, 445–451.
Desmazières, J. B. H. (1842). Cryptogames nouvelles. Annales des Sciences Naturelles, 17, 91–118.
El Chartouni, L., Tisserant, B., Siah, A., Duyme, F., Leducq, J.-B., Deweer, C., Fichter-Rosin, C., Sanssené, J., Durand, R., Halama, P., & Reignauld, P. (2011). Genetic diversity and population structure in French populations of Mycosphaerella graminicola. Mycologia, 103(4), 764–774. Evanno, G., Regnaut, S., & Goudet, J. (2005). Detecting the
number of clusters of individuals using the software STRUCTURE: a simulation study. Molecular Ecology, 14, 2611–2620.
Eyal, Z. (1999). The Septoria tritici and Stagonospora nodorum blotch diseases of wheat. European Journal of Plant Pa-thology, 105, 629–641.
Eyal, Z., Scharen, A. L., Huffman, M. D., & Prescott, J. M. (1985). Global insights into virulence frequencies of Mycosphaerella graminicola. Phytopathology, 75, 1456– 1462.
FAOstat (2012). Resource document. http://faostat.fao.org
Accessed on 2 August 2012.
Fraaije, B. A., Cools, H. J., Fountaine, J., Lovell, D. J., Motteram, J., West, J. S., & Lucas, J. A. (2005). Role of ascospores in further spread of QoI-resistant cytochrome b alleles (G143A) in field populations of Mycosphaerella graminicola. Phyto-pathology, 95(8), 933–941.
Gisi, U., Sierotzki, H., Cook, A., & McCaffery, A. (2002). Mechanisms influencing the evolution of resistance to Qo inhibitor fungicides. Pest Management Science, 58, 859– 867.
Goodwin, S. B., van der Lee, T. A. J., Cavaletto, J. R., Hekkert, B., Crane, C. F., & Kema, G. H. J. (2007). Identification and genetic mapping of highly polymorphic microsatellite loci from an EST database of Septoria tritici blotch patho-gen Mycosphaerella graminicola. Fungal Genetics and Biology, 44, 398–414.
Gurung, S., Goodwin, S. B., Kabbage, M., Bockus, W. W., & Adhikari, T. B. (2011). Genetic differentiation at micro-satellite loci among populations of Mycosphaerella grami-nicola from California, Indiana, Kansas, and North Dakota. Phytopathology, 101, 1251–1259.
Haubold, H., & Hudson, R. R. (2000). LIAN 3.0: detecting linkage disequilibrium in multilocus data. Bioinformatics, 16, 847–848.
Jürgens, T., Linde, C. C., & McDonald, B. A. (2006). Genetic structure of Mycosphaerella graminicola populations from Iran, Argentina and Australia. European Journal of Plant Pathology, 115, 223–233.
Kabbage, M., Leslie, J. F., Hulbert, S. H., & Bockus, W. W. (2009). Comparison of natural populations of Mycosphaer-ella graminicola from single fields in Kansas and Califor-nia. Physiological and Molecular Plant Pathology, 74, 55– 59.
Linde, C. C., Zhan, J., & McDonald, B. A. (2002). Population structure of Mycosphaerella graminicola: from lesions to continents. Phytopathology, 92, 946–955.
McDonald, B. A., & Linde, C. (2002a). The population genetics of plant pathogens and breeding strategies for durable resistance. Euphytica, 124, 163–180.
McDonald, B. A., & Linde, C. (2002b). Pathogen population genetics, evolutionary potential, and durable resistance. Annual Review of Phytopathology, 40, 349–379. Meirmans, P. G., & Van Tienderen, P. H. (2004). GENOTYPE
and GENODIVE: two programs for the analysis of genetic
diversity of asexual organisms. Molecular Ecology Notes, 4, 792–794.
Moravec, D., & Votýpka, J. (1998). Klimatická regionalizace České republiky. Karolinum: Nakladateství Univerzity Karlovy.
Nei, M. (1973). Analysis of gene diversity in subdivided pop-ulations. Proceedings of the National Academy of Sciences of the United States of America, 70, 3321–3323. Nybom, H. (2004). Comparison of different nuclear DNA
markers for estimating intraspecific genetic diversity in plants. Molecular Ecology, 13, 1143–1155.
Owen, P. G., Pei, M., Karp, A., Royle, D. J., & Edwards, K. J. (1998). Isolation and characterization of microsatellite loci in the wheat pathogen Mycosphaerella graminicola. Mo-lecular Ecology, 7, 1611–1612.
Pritchard, J. K., Stephens, M., & Donnelly, P. (2000). Inference of population structure using multilocus genotype data. Genetics, 155, 945–959.
Quaedvlieg W., Kema G. H. J., Groenewald J. Z., Verkley G. J. M., Seifbarghi S., Razavi M., Mirzadi Gohari A., Mehrabi R. & Crous P. W. (2011) Zymoseptoria gen. nov.: a new genus to accommodate Septoria-like species occuring on graminico-lous hosts. Persoonia, 26, 57–69.
Rannala, B., & Yang, Z. (2003). Bayes estimation of species divergence times and ancestral population sizes using DNA sequences from multiple loci. Genetics, 164, 1645–1656. Razavi, M., & Hughes, G. R. (2004). Microsatellite markers
provide evidence for sexual reproduction of Mycos-phaerella graminicola in Saskatchewan. Genome, 47, 789–794.
Risser, P., Ebmezer, E., Korzun, V., Hartl, L., & Miedaner, T. (2011). Quantitative trait loci for adult-plant resistance to Mycosphaerella graminicola in two winter wheat popula-tions. Phytopathology, 101(10), 1209–1216.
Sanderson, F. R. (1972). A Mycosphaerella species as the ascogenous state of Septoria tritici Rob. and Desm. New Zealand Journal of Botany, 10, 707–710.
Schilly, A., Risser, P., Ebmeyer, E., Hartl, L., Reif, J. C., Wuerschum, T., & Miedaner, T. (2011). Stability of adult-plant resistance to Septoria tritici blotch in 24 European winter wheat varieties across nine field envi-ronments. Journal of Phytopathology, 159, 411–416. Schnieder, F., Koch, G., Jung, C., & Vereet, J. A. (1998). The
application of molecular markers for genetic characteriza-tion of Septoria tritici populacharacteriza-tions. Plant Diseases and Protection, 105, 452–461.
Schnieder, F., Koch, G., Jung, C., & Verreet, J. A. (2001). Genotypic diversity of the wheat leaf blotch pathogen Mycosphaerella graminicola (anamorph) Septoria tritici in Germany. European Journal of Plant Pathology, 107, 285–290.
Siah, A., Tisserant, B., Chartouni, L. E., Duyme, F., Deweer, C., Roisin-Fichter, C., Sanssene, J., Durand, R., Reignault, P., & Halama, P. (2010). Mating type idiomorphs from a French population of the wheat pathogen Mycosphaerella graminicola: widespread equal distribution and low but distinct levels of molecular polymorphism. Plant Patholo-gy, 59, 661–670.
Šíp, V. (2003). Breeding wheat for resistance to Septoria tritici blotch in the Czech Republic. In: G.H.J. Kema, M. van Ginkel, M. Harrabi (Eds.), Global insights into the
Septoria and Stagonospora diseases of cereals. Proceed-ings of the 6th international symposium on septoria and stagonospora diseases in cereals, Tunis, Tunisia, 169–170. State Phytosanitary Administration (2012). Resource document.
http://www.srs.czAccessed on 2 August 2012.
Stukenbrock, E. H., Banke, S., Javan-Nikkhah, & McDonald, B. A. (2007). Origin and domestication of the fungal wheat pathogen Mycosphaerella graminicola via sympatric spe-ciation. Molecular Biology and Evolution, 24, 398–411. Swinnen J., van Herck K., & Vranken L. (2009). Agricultural
productivity in transition economies. Resource document.
http://www.choicesmagazine.org/magazine/article.php? article093Accessed on 2 August 2012.
Torriani, S. F. F., Bruner, P. C., McDonald, B. A., & Sierotzki, H. (2009). QoI resistance emerged independently at least 4 times in European populations of Mycosphaerella grami-nicola. Pest Management Science, 65, 155–162.
Waalwijk, C., Mendes, O., Verstappen, E. C. P., Waard, M. A., & Kema, G. H. J. (2002). Isolation and characterization of the mating type idiomorphs from the wheat septoria leaf
blotch fungus Mycosphaerella graminicola. Fungal Genet-ics and Biology, 35, 277–286.
Wingen, L. U., Brown, J. K. M., & Shaw, M. W. (2007). The population genetic structure of clonal organisms generated by exponentially bounded and fat-tailed dispersal. Genet-ics, 177, 435–448.
Zhan, J., Mundt, C. C., Hoffer, M. E., & McDonald, B. A. (2002a). Local adaptation and effect of host genotype on the rate of pathogen evolution: an experimental test in plant pathosys-tem. Journal of Evolutionary Biology, 15, 634–647. Zhan, J., Kema, G. H. J., Waalwijk, C., & McDonald, B. A.
(2002b). Distribution of mating type alleles in the wheat pathogen Mycosphaerella graminicola over spatial scales from lesions to continents. Fungal Genetics and Biology, 36, 128–136.
Zhan, J., Pettway, R. E., & McDonald, B. A. (2003). The global genetic structure of the wheat pathogen Mycosphaerella graminicola is characterized by high nuclear diversity, low mitochondrial diversity, regular recombination, and gene flow. Fungal Genetics and Biology, 38, 286–297.