HAL Id: hal-02425241
https://hal.archives-ouvertes.fr/hal-02425241
Submitted on 7 Sep 2020
HAL is a multi-disciplinary open access
archive for the deposit and dissemination of
sci-entific research documents, whether they are
pub-lished or not. The documents may come from
teaching and research institutions in France or
abroad, or from public or private research centers.
L’archive ouverte pluridisciplinaire HAL, est
destinée au dépôt et à la diffusion de documents
scientifiques de niveau recherche, publiés ou non,
émanant des établissements d’enseignement et de
recherche français ou étrangers, des laboratoires
publics ou privés.
Molecular emissions in sonoluminescence spectra of
water sonicated under Ar-based gas mixtures
R. Pflieger, E. Fayard, C. Noël, S.I. Nikitenko, T. Belmonte
To cite this version:
R. Pflieger, E. Fayard, C. Noël, S.I. Nikitenko, T. Belmonte. Molecular emissions in sonoluminescence
spectra of water sonicated under Ar-based gas mixtures. Ultrasonics Sonochemistry, Elsevier, 2019,
58, pp.104637. �10.1016/j.ultsonch.2019.104637�. �hal-02425241�
Contents lists available atScienceDirect
Ultrasonics - Sonochemistry
journal homepage:www.elsevier.com/locate/ultson
Molecular emissions in sonoluminescence spectra of water sonicated under
Ar-based gas mixtures
R. P
flieger
a,⁎, E. Fayard
a, C. Noel
b, S.I. Nikitenko
a, T. Belmonte
baInstitut de Chimie Séparative de Marcoule, ICSM UMR 5257– CEA, CNRS, Univ Montpellier, ENSCM, Bagnols-sur-Cèze Cedex, France bUniversité de Lorraine, Institut Jean Lamour, UMR CNRS 7198, Nancy, France
A R T I C L E I N F O Keywords: Sonochemistry Sonoluminescence Emission spectra Ultrasound Plasma A B S T R A C T
Sonoluminescence (SL) spectroscopy is one of the very few ways to study the plasma formed in solutions sub-mitted to ultrasound. Unfortunately, up to now only very limited emission bands were reported in SL spectra of aqueous solutions, moreover broad and badly resolved. It is shown here that by adding some N2and/or CO2in
Ar, new molecular emissions (CN, N2and CO) can be observed and that for some of them rovibronic
tem-peratures can be derived. The paramount importance of Stark broadening in these emissions is underlined, together with the need for data on Stark parameters for molecular emissions.
1. Introduction
When a liquid is irradiated by ultrasounds (US) emitted at a fre-quency set in the range 20 kHz–1 MHz, a particular chemical activity is observed, called sonochemistry. Its origin is acoustic cavitation: nu-cleation, growth and violent collapse of microbubbles containing dis-solved gases and vapour of the bulk liquid. The formation of a plasma in cavitation bubbles at collapse is now widely admitted[1]even though the underlying mechanism remains unclear. Moreover characterization of this plasma is not straightforward due to its small size (< 1 µm), its short lifespan (< 1 ns) and the stochastic (non-predictable) nature of its apparition. Two main directions can be followed to study it: monitoring of its chemical activity and emission spectroscopy of its sonolumines-cence (SL, the light emitted by the sonochemical plasma). Yet, and despite the obvious qualities of water as a solvent, relatively few atomic and molecular emissions have been reported in SL spectra of aqueous solutions and limited information about the plasma characteristics could be derived from them.
Reported molecular emissions are those from OH[2], C2[3]and NH
[4] radicals and from non-volatile solutes such as alkali metals [5], lanthanide Ln(III) ions[6]and uranyl UO22+ ions[7]. Different
ex-citation mechanisms do exist: exex-citation by the photons of sonolumi-nescence (sonophotolumisonolumi-nescence) of ions in solution (e.g. Ce3+[8]or
UO22+[7]), collisional excitation at the bubble interface [7]or
for-mation in the intra-bubble plasma[9]. The latter case being common, these emissions have been used to characterize the formed plasma or more generally the conditions reached at collapse.
For instance, emissions from alkali were the focus of various studies aiming at determining the maximum pressure reached in cavitation bubbles. The made assumption was that pressure (or more exactly the intra-bubble density) was the main parameter affecting the line shift and broadening of the emissions. Lepoint-Mullie et al. [5a] measured Rb resonance line shifts in sonoluminescence of RbCl aqueous solutions sonicated at 20 kHz under Ar or Kr, compared them with tabulated ones vs. relative density and deduced a relative density of 18 ± 2. Similar results were obtained in silicon oil with the same approach[10]. On the other hand, relative densities derived from line broadening were much higher: 36–50 at 460 kHz under Ar[11], 59.5 at 138 kHz under Ar[12], corresponding to 885 bar if a temperature of 4300 K is considered or 800–1200 bar at 22 and 44 kHz under Ar[13]. The discrepancy in the values obtained with these two approaches was attributed to the non-negligible contribution of Stark effects in both broadening and shift [4b].
Rovibronic temperatures of excited species, obtained from simula-tion of the SL spectra, were also used to estimate the peak temperature reached at collapse. In early works, unicity of the temperature was assumed. Didenko et al. [3a]fitted C2Swan (d3Πg– a3Πu) bands in the
SL spectra of an aqueous 10−3M benzene solution sonicated at 20 kHz under Ar and obtained a temperature of 4300 ± 200 K. More recently, a study [3b] at different ultrasonic frequencies of Swan bands in SL spectra of aqueous tert-butanol solutions under Ar showed the necessity of considering the non-equality of the vibrational Tvand rotational Tr
temperatures (Tv> Tr). Temperatures ( ± 1000 K) estimated in the
tert-butanol concentration range where the intensity of Swan bands was
https://doi.org/10.1016/j.ultsonch.2019.104637
Received 10 April 2019; Received in revised form 5 June 2019; Accepted 11 June 2019
⁎Corresponding author.
E-mail address:rachel.pflieger@cea.fr(R. Pflieger).
Available online 11 June 2019
1350-4177/ © 2019 Elsevier B.V. All rights reserved.
highest were e.g. Tv= 6300 K and Tr= 4800 K at 20 kHz and
Tv= 8000 K and Tr= 4000 K at 362 kHz. Similar temperatures and the
same trend of an increase in vibrational temperatures at high US fre-quency were obtained fromfits of OH (A2Σ+-X2Π) and NH (A3Π -X3
Σ−) emissions in SL spectra of 0.1 M ammonia solutions under Ar: for
OH Tv= 9000 ± 1000 K and Tr= 5000 ± 500 K at 20 kHz, and
Tv= 13000 ± 2000 K and Tr= 6000 ± 1000 K at 359 kHz, for NH
Tv= 7000 ± 1000 K and Tr= 4000 ± 500 K at 20 kHz, and
Tv= 10000 ± 1000 K and Tr= 2200 ± 500 K at 359 kHz.
The comparison of these values shows a large variation. Thus, the need for information on the plasma formed in cavitation bubbles re-mains essential and it is important to gain a better understanding of mechanisms controlling molecular emissions produced in known con-ditions and in systems as simple as possible. The present work focuses on high-frequency (362 kHz) SL spectra of water saturated with gas mixtures in Ar. The added gases and their concentrations were be-forehand optimised to allow the observation of some new molecular emissions (CN, CO) in SL without decreasing much the SL intensity, and of already reported ones (OH, NH, C2). Rovibronic temperatures and
broadening parameter are determined and compared.
2. Experimental methods
For all experiments, 250 mL of deionized water (Milli-Q 18.2 MΩ cm) were placed in a thermostated glass reactor equipped with a 362-kHz transducer (ELAC Nautik, 25 cm2) at its bottom. The absorbed acoustic power was determined calorimetrically (Pac= 43 W). The
so-lution was submitted to a continuous gas flow (82 mL/min) of Ar or mixtures of N2 (5%) and/or CO2 (0.5%) in Ar (all gases with a
purity > 99.999%, and provided by Air Liquide), starting half an hour before the experiment and maintained during the ultrasonic treatment. Emission spectra of sonoluminescence were collected through aflat quartz window mounted on the sonoreactor and recorded in the spec-tral range 250–650 nm by means of SP 2356i Roper Scientific spectro-meter (gratings 150blz500, 600blz300 and 1200blz300; 50 µm slit) coupled with a CCD camera that is equipped with UV coating (SPEC10-100BR Roper Scientific) cooled by liquid nitrogen. Spectral calibration was performed using a Hg(Ar) pen-ray lamp (LSP035, LOT-Oriel). The spectra acquisition was started after reaching a steady-state tempera-ture. For each experiment, at least ten 300-s (150blz500 grating), re-spectively 600-s (600blz300 and 1200blz300 gratings), spectra were averaged and corrected for the background noise and for the quantum efficiencies of gratings and CCD.
Molecular emissions werefitted using Specair[14]software after removal of a linear baseline. Computation parameters were the vibra-tional and rotavibra-tional temperatures (Tvand Tr) of the considered species,
the gas temperature, taken equal to Tr, and the pressure p. Instrumental
broadening was taken into account by convoluting calculated spectra with an experimental slit function. Due to the relatively high signal scattering, the low spectral resolution and the strong broadening of the emissions, an automaticfitting was not possible and the computation parameters were fitted manually in a row to reproduce the relative intensities of the different rovibronic transitions (Tv, Tr) and the width
of the peaks (p).
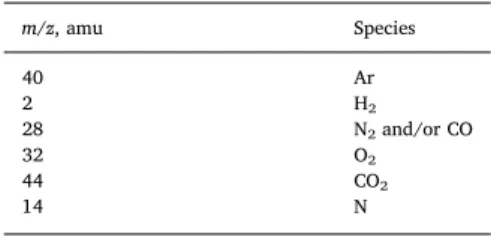
Gases formed during the sonolysis were measured online by mass spectrometry (Prima BT, Thermo Fischer Scientific). Monitored masses are given inTable 1. The fragment N (m/z = 14) was recorded to dis-criminate CO from N2(m/z = 28). MS analysis was started at the same
time as pre-saturation of the solution, i.e. at least half an hour before the beginning of sonication, to record a baseline for each monitored species. In the particular case of CO, this baseline includes the ion in-tensities of N2and of the fragment CO of CO2. The increase in ion
in-tensity of m/z = 28 during the sonolysis is due to CO gas and com-parison of the ion intensities during sonolysis and of the baseline allows to quantify its amount.
3. Results & discussion 3.1. Formed gaseous products
Table 2summarizes the chemical yields of the observed gaseous products of the sonolysis for the various gas mixtures. Hydrogen arises from the dissociation of water molecules in cavitation bubbles at col-lapse and subsequent recombination of radicals (where))) stands for a reaction induced by ultrasound):
H2O→ ))) → H + %OH (1)
H + H→ H2 (2)
%OH + %OH → H2O2 (3)
H +%OH → H2O (4)
As soon as some amount of molecular gas is added in Ar, the H2
yield decreases. This effect can be partly attributed to the less efficient energy concentration at collapse[15]and the additional losses in en-ergy due to higher thermal conductivity of molecules, vibrational and rotational excitations and chemical reactions, translating into a less energetic plasma, but also to additional reactions consuming H radicals and/or H2molecules. It is known[4a,16]that the following reactions
involving nitrogen and hydrogen take place in cavitation bubbles during the high-frequency sonolysis of water saturated with Ar-N2,
leading to a decrease in H2formation yield:
N2→ ))) → 2 N (5)
N + H→ NH (6)
N + H2→ NH + H (7)
The reduction in H2yield in the presence of CO2may be attributed
to the reactions of CO2with H atoms[17]:
CO2+ H→ ))) → CO + %OH (8)
CO2+ H→ ))) → %COOH (9)
The subsequent reaction of this latter radical with H atoms leads to the formation of formic acid, as previously reported by Henglein[17b] who showed that the main product of the 300-kHz sonolysis of water presaturated with Ar-CO2mixtures was carbon monoxide, with some
amount of formic acid. Reaction(8)would also explain the observed formation of CO in the sonolysis of water saturated with Ar-0.5%CO2
and the concomitant similar decrease in CO2 ion intensity (of
1.4 ± 0.6 µmol/kJ). A second reaction can also lead to CO formation
Table 1
Masses (amu) of the gases monitored by mass spectrometry. m/z, amu Species 40 Ar 2 H2 28 N2and/or CO 32 O2 44 CO2 14 N Table 2
Chemical yields of the formed gaseous products, H2and CO.
Saturating gas H2yield, µmol/kJ ( ± 0.02) CO yield, µmol/kJ ( ± 0.6)
Ar 0.36 –
Ar-5%N2 0.27 –
Ar-0.5%CO2 0.09 1.7
Ar-0.5%CO2-5%N2 0.12 –
R. Pflieger, et al. Ultrasonics - Sonochemistry 58 (2019) 104637
[17b]:
CO2→ ))) → CO + O (10)
Adding conjointly 0.5% CO2 and 5% N2 in Ar leads to the
dis-appearance of CO in the outlet gas, which can be traced back to the reaction[17a]of CO with N2:
N2+ CO→ ))) → CN + NO (11)
Reaction(11)would also account for the lesser decrease in H2yield
with this ternary gas mixture compared to the binary ones Ar-5%N2and
Ar-0.5%CO2, less CO2and N2molecules being available for quenching
H atoms.
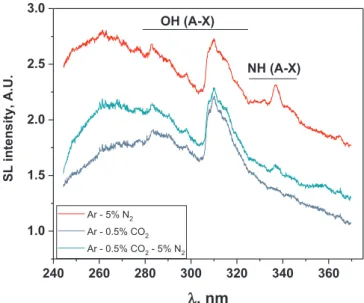
3.2. Observed molecular emissions in sonoluminescence emission spectra Fig. 1 presents the UV parts of SL spectra of water sonicated at 362 kHz under Ar-5%N2, Ar-0.5%CO2 and Ar-0.5%CO2-5%N2 gas
flows, andFig. 2their visible parts.
Like the usually reported SL spectra of water under Ar, they show an
intense continuum spanning from the UV to the near IR and the emis-sion from excited OH radicals (OH (A-X)). The latter arise from the dissociation of water molecules in cavitation bubbles at collapse (re-action(1)). When the saturating gas is Ar-5%N2, a molecular emission
is present around 337 nm that is assigned to NH (A-X)[4a]. A probable mechanism of formation of this excited species is given by reactions (5)–(7).
The sonolysis of water in the presence of Ar-0.5%CO2gas mixture
leads to a complex SL spectrum. A tiny peak appears near 386 nm and is attributed to CN violet[18]; indeed, CN can be formed in the presence of air traces by reaction(11) [17a].
Besides, the maxima of C2Swan bands are recognizable but
super-impose with a broad not-well-defined emission, or a sum of emissions, likely from CO (possibly CO (X-X)[18](Fig. 1SI), CO (C-A) and CO (d-a)[18]). This hypothesis on the nature of this emission is supported by the presence of CO in the outlet gas (Table 2). The ultrasonically driven formation of C2excited species in the presence of CO gas was recently
[19]reported and explained by CO disproportionation followed by the recombination of carbon atoms and/or formation and subsequent dis-sociation of C2O molecules[20]:
CO→ ))) → CO2+ C (12)
C + C + M→ ))) → C2+ M (13)
C + CO + M→ ))) → C2O + M (14)
C2O + C→ ))) → C2+ CO (15)
Adding conjointly 0.5% CO2 and 5% N2 in Ar leads to the
ob-servation of OH (A-X), NH (A-X), CN violet (confirming the nature of the emission at 386 nm) and C2Swan bands. In this gas mixture, CN
formation can also be attributed to following reaction[21]:
C2+ N2→ 2 CN (16)
The absence of CO emission in the SL spectra of water saturated with Ar-0.5%CO2-5%N2correlates with the absence of CO in the outlet
gas (Table 2).
3.3. Derived rovibronic temperatures
Fig. 3compares the OH (A-X) emissions observed with the different gas mixtures in Ar (after subtraction of a baseline due to the SL con-tinuum). They are very similar, except for two zones (indicated by ar-rows) where the intensity is higher when N2 is present in the gas:
Fig. 1. UV part of SL spectra of water under Ar-5%N2, Ar-0.5%CO2and
Ar-0.5%CO2-5%N2(362 kHz, 43 W, 14 °C, 600blz300 grating).
Fig. 2. Visible part of SL spectra of water under Ar-5%N2, Ar-0.5%CO2and
Ar-0.5%CO2-5%N2(362 kHz, 43 W, 14 °C, 150blz500 grating).
Fig. 3. Comparison of OH emission in SL spectra of water sparged with gas mixtures in Ar.
around 308 nm and around 315 nm. The former may be due to NH (c-a) and/or to N2(C-B) and the latter to N2 (C-B) emissions (Fig. 2SI in
Supporting Information), superimposed on that of OH. Thus simulation was performed (using Specair software [14]) on OH (A-X) emission under Ar (Fig. 3SI in Supporting Information). It can be reasonably fitted with Tv= 9000 K ( ± 1000 K), Tr= 6500 K ( ± 1000 K) and an
effective pressure of 1000 bar ( ± 300 bar).
The simulation of NH (A-X) in the presence of Ar-5%N2(Fig. 4SI in
Supporting Information) leads to Tv= 10000 K ( ± 1000 K),
Tr= 10000 K ( ± 1000 K) and an effective pressure of 4000 bar
( ± 500 bar). The bulge around 340–345 nm is of unknown origin. In-terestingly, when N2 content in Ar is increased, NH (A-X) emission
cannot befitted anymore, which is attributed to the presence of a non-negligible N2(C-B) emission (Fig. 2SI in Supporting Information).
Due to the presence of a strong CO emission in the SL spectra of water saturated with Ar-0.5%CO2, the simulation of C2 Swan bands
could be performed only for the gas mixture Ar-5%N2-0.5%CO2 for
which no CO emission was noted. It was done focusing on theΔν = 0 andΔν = 1 bands (Fig. 5SI in Supporting Information). Derived rovi-bronic temperatures are Tv= 22000 K ( ± 1000 K), Tr= 5000 K
( ± 1000 K) and an effective pressure of 6000 bar ( ± 1000 bar). In the presence of the gas mixture Ar-5%N2-0.5%CO2an intense CN
(B-X) molecular emission is also observed that can be simulated with Tv= 12500 K ( ± 2500 K), Tr= 10000 K ( ± 1000 K) and an effective
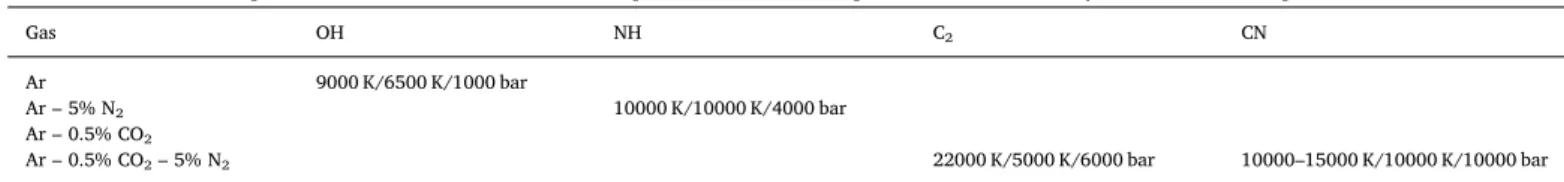
pressure of the order of 10000 bar (Fig. 6SI in Supporting Information). Table 3summarizes all derived rovibronic temperatures and effec-tive pressures in the form vibrational temperature Tv/rotational
tem-perature Tr/effective pressure.
The very large effective pressure values obtained, in particular from CN emission, and the fact that they considerably differ depending on which emitting species is considered, undoubtedly confirm that pres-sure cannot be considered as the main broadening parameter, as pre-viously discussed[4b]and that Stark broadening should be taken into account. Unfortunately however, data on Stark broadening of molecular emissions are particularly scarce, which considerably limits the in-formation that can be derived from the measured broadenings.
Comparison of the present OH rovibronic temperatures with pre-viously[2d]reported ones for the sonication of water at 362 kHz under Ar shows a good agreement for both Tv(9000 vs. 8000 K) and Tr(6500
vs. 5250 K), whereby the difference may be due to the uncertainty in the baseline definition. Similarly, a difference in the continuum shape in the wavelength range of OH emission may also account for the higher Tvreported for OH in a 0.1 M ammonia solution[4b](13000 K).
In the presence of Ar– 5% N2two molecular emissions are observed,
the vibrational temperatures of which are fairly close, while NH rota-tional temperature is higher than that of OH. Interestingly, it is also much higher than the rotational temperature derived from NH emission in the sonolysis of an ammonia solution[4b](2200 K). Considering the different reaction pathways leading to NH formation in both cases (sonolysis of NH3molecule vs. reactions(1) & (5)–(7)) it is conceivable
that the formation of NH from H and N radicals necessitates several steps compared to the direct sonolysis of NH3or H2O molecules. Then,
the chemical pathway leading to emission likely affects the rotational distribution of the emitting states, leading to the observed discrepancy between measurements.
A similar disagreement is observed between the derived rovibronic
temperatures for the gas mixture Ar– 0.5% CO2– 5% N2. The several
steps leading to CN formation may also lead to specific rotational po-pulations and rotational temperature that do not match with the gas temperature, due to the extremely short lifetime of the formed plasma. For the same reason, vibrational temperatures might be different as well.
4. Conclusion
Although it was long considered that SL spectra of aqueous solutions were relatively featureless compared to those of exotic liquids (e.g. concentrated sulfuric acid), thus strongly limiting the possibility to study the formed plasma, this study shows that besides usual OH and C2
emissions and the recently reported NH one, at least three more mo-lecular emissions can be observed in high-frequency SL spectra of aqueous solutions, namely CN, N2and CO. Thisfinding enriches the
“toolbox” available to characterize the sonochemical plasma, the con-ditions reached at collapse of cavitation bubbles and the chemical re-actions taking place in bubble cores.
Unfortunately, not all these emissions can befitted yet: CO blends into the continuum and N2superimposes over the strong OH emission.
Moreover, their presence perturbs thefitting of the other better-defined emissions, like C2or OH.
To go further in the exploitation of these emissions, there is a strong need for tabulated data on Stark parameters for molecular emissions. Once available, the present data might allow estimation of the reached pressure and of plasma characteristics such as electron density and temperature. The optimised three-component gas mixture is in this purpose of particular interest since the corresponding SL spectra pre-sent three different usable molecular emissions.
Acknowledgements
CNRS and in particular its Réseau des Plasmas Froids are ac-knowledged for supporting this work with an IPMC.
Appendix A. Supplementary data
Supplementary data to this article can be found online athttps:// doi.org/10.1016/j.ultsonch.2019.104637.
References
[1] P.J. Bruggeman, M.J. Kushner, B.R. Locke, J.G.E. Gardeniers, W.G. Graham, D.B. Graves, R. Hofman-Caris, D. Maric, J.P. Reid, E. Ceriani, D.F. Rivas, J.E. Foster, S.C. Garrick, Y. Gorbanev, S. Hamaguchi, F. Iza, H. Jablonowski, E. Klimova, J. Kolb, F. Krcma, P. Lukes, Z. Machala, I. Marinov, D. Mariotti, S.M. Thagard, D. Minakata, E.C. Neyts, J. Pawlat, Z.L. Petrovic, R. Pflieger, S. Reuter, D.C. Schram, S. Schroter, M. Shiraiwa, B. Tarabova, P.A. Tsai, J.R.R. Verlet, T. von Woedtke, K.R. Wilson, K. Yasui, G. Zvereva, Plasma Sources Sci. Technol. 25 (5) (2016) 053002.
[2] (a) C. Sehgal, R.G. Sutherland, R.E. Verrall, J. Phys. Chem. 84 (4) (1980) 388–395; (b) T.V. Gordeychuk, Y.T. Didenko, S.P. Pugach, Acoust. Phys. 42 (2) (1996) 240–241;
(c) T. Lepoint, F. Lepoint-Mullie, N. Voglet, S. Labouret, C. Petrier, R. Avni, J. Luque, Ultrason. Sonochem. 10 (3) (2003) 167–174;
(d) R. Ji, R. Pflieger, M. Virot, S.I. Nikitenko, J. Phys. Chem. B 122 (27) (2018) 6989–6994.
[3] (a) Y.T. Didenko, W.B. McNamara, K.S. Suslick, J. Am. Chem. Soc. 121 (24) (1999) 5817–5818;
Table 3
Estimated rovibronic temperatures ( ± 1000 K unless otherwise specified) and effective pressures ( ± 300 bar) by simulations with Specair software.
Gas OH NH C2 CN
Ar 9000 K/6500 K/1000 bar
Ar– 5% N2 10000 K/10000 K/4000 bar
Ar– 0.5% CO2
Ar– 0.5% CO2– 5% N2 22000 K/5000 K/6000 bar 10000–15000 K/10000 K/10000 bar
R. Pflieger, et al. Ultrasonics - Sonochemistry 58 (2019) 104637
(b) R. Pflieger, A.A. Ndiaye, T. Chave, S.I. Nikitenko, J. Phys. Chem. B 119 (1) (2015) 284–290.
[4] (a) T. Ouerhani, R. Pflieger, W. Ben Messaoud, S.I. Nikitenko, J. Phys. Chem. B 119 (2015) 15885–15891;
(b) R. Pflieger, T. Ouerhani, T. Belmonte, S.I. Nikitenko, PCCP 19 (38) (2017) 26272–26279.
[5] (a) F. Lepoint-Mullie, N. Voglet, T. Lepoint, R. Avni, Ultrason. Sonochem. 8 (2) (2001) 151–158;
(b) S. Abe, P.K. Choi, Jpn. J. Appl. Phys. 48 (2009) 7;
(c) C. Cairos, J. Schneider, R. Pflieger, R. Mettin, Ultrason. Sonochem. 21 (6) (2014) 2044–2051;
(d) G.L. Sharipov, B.M. Gareev, A.M. Abdrakhmanov, Acoust. Phys. 59 (5) (2013) 521–527.
[6] (a) G.L. Sharipov, JETP Lett. 85 (9) (2007) 458–460;
(b) G.L. Sharipov, R.K. Gainetdinov, A.M. Abdrakhmanov, Russ. Chem. Bull. 52 (9) (2003) 1969–1973;
(c) G.L. Sharipov, B.M. Gareev, A.M. Abdrakhmanov, JETP Lett. 91 (11) (2010) 566–569;
(d) R. Pflieger, J. Schneider, B. Siboulet, H. Mohwald, S.I. Nikitenko, J. Phys. Chem. B 117 (10) (2013) 2979–2984.
[7] R. Pflieger, V. Cousin, N. Barre, P. Moisy, S.I. Nikitenko, Chem.-Eur. J. 18 (2) (2012) 410–414.
[8] G.L. Sharipov, R.K. Gainetdinov, A.M. Abdrakhmanov, Russ. Chem. Bull. 57 (9) (2008) 1831–1836.
[9] (a) G.L. Sharipov, A.M. Abdrakhmanov, B.M. Gareev, Tech. Phys. 58 (2) (2013) 255–258;
(b) C. Cairos, R. Mettin, Phys. Rev. Lett. 118 (2017) 6.
[10] W.B. McNamara, Y.T. Didenko, K.S. Suslick, Nature 401 (6755) (1999) 772–775. [11] C. Sehgal, R.P. Steer, R.G. Sutherland, R.E. Verrall, J. Chem. Phys. 70 (5) (1979)
2242–2248.
[12] P.K. Choi, S. Abe, Y. Hayashi, J. Phys. Chem. B 112 (3) (2008) 918–922. [13] M.V. Kazachek, T.V. Gordeychuk, Tech. Phys. Lett. 35 (2) (2009) 193–196. [14] C.O. Laux, T.G. Spence, C.H. Kruger, R.N. Zare, Plasma Sources Sci. Technol. 12 (2)
(2003) 125–138.
[15] F.R. Young, Sonoluminescence, CRC Press, New York, 2005. [16] Supeno, P. Kruus, Ultrason. Sonochem. 9 (1) (2002) 53–59. [17] (a) G. Schlesinger, S.L. Miller, J. Mol. Evol. 19 (5) (1983) 383–390;
(b) A. Henglein, Zeitschrift Fur Naturforschung Section B-a, J. Chem. Sci. 40 (1) (1985) 100–107.
[18] R.W.B. Pearse, A.G. Gaydon, The Identification of Molecular Spectra, 4th ed., Chapman and Hall, London, 1976.
[19] N.M. Navarro, R. Pflieger, S.I. Nikitenko, Ultrason. Sonochem. 21 (3) (2014) 1026–1029.
[20] (a) H.L. Wallaart, B. Piar, M.Y. Perrin, J.P. Martin, Chem. Phys. Lett. 246 (6) (1995) 587–593;
(b) W. Urban, J.X. Lin, V.V. Subramaniam, M. Havenith, J.W. Rich, Chem. Phys. 130 (1–3) (1989) 389–399.