HAL Id: hal-02352101
https://hal.sorbonne-universite.fr/hal-02352101
Submitted on 6 Nov 2019
HAL is a multi-disciplinary open access
archive for the deposit and dissemination of
sci-entific research documents, whether they are
pub-lished or not. The documents may come from
teaching and research institutions in France or
abroad, or from public or private research centers.
L’archive ouverte pluridisciplinaire HAL, est
destinée au dépôt et à la diffusion de documents
scientifiques de niveau recherche, publiés ou non,
émanant des établissements d’enseignement et de
recherche français ou étrangers, des laboratoires
publics ou privés.
processing in the visual cortex
Florence Bouhali, Zoé Bézagu, Stanislas Dehaene, Laurent Cohen
To cite this version:
Florence Bouhali, Zoé Bézagu, Stanislas Dehaene, Laurent Cohen. A mesial-to-lateral dissociation
for orthographic processing in the visual cortex. Proceedings of the National Academy of Sciences
of the United States of America , National Academy of Sciences, 2019, 116 (43), pp.21936-21946.
�10.1073/pnas.1904184116�. �hal-02352101�
ORTHOGRAPHIC PROCESSING IN THE VISUAL
CORTEX
Florence Bouhali
1,2,*, Zoé Bézagu
1, Stanislas Dehaene
3,4, Laurent Cohen
1,51. Inserm U 1127, CNRS UMR 7225, Sorbonne Universités, UPMC Univ Paris 06 UMR S 1127,
Institut du Cerveau et de la Moelle épinière, ICM, F-75013, Paris, France.
2. Department of Psychiatry and Weill Institute for Neurosciences, University of California San
Francisco (UCSF), San Francisco, CA 94143.
3. Cognitive Neuroimaging Unit, CEA DRF/I2BM, INSERM, Université Sud, Université
Paris-Saclay, NeuroSpin center, 91191 Gif/Yvette, France. 4. Collège de France, 11 Place Marcelin Berthelot, 75005 Paris, France. 5. AP-HP, Hôpital de la Pitié Salpêtrière, Féderation de Neurologie, F-75013, Paris, France. * corresponding author: florence.bouhali@gmail.com
A
BSTRACT
Efficient reading requires a fast conversion of the written word to both phonological and semantic codes. We tested the hypothesis that, within the left occipitotemporal cortical regions involved in visual word recognition, distinct subregions harbor slightly different orthographic codes adapted to those two functions. While the lexico-semantic pathway may operate on letter or open-bigram information, the phonological pathway requires the identification of multiletter graphemes such as “ch” or “ou” in order to map them onto phonemes. To evaluate the existence of a specific stage of graphemic encoding, twenty adults performed lexical decision and naming tasks on words and pseudowords during fMRI. Graphemic encoding was facilitated or disrupted by coloring and spacing the letters either congruently with multi-letter graphemes (ch-ai-r), or incongruently with them (c-ha-ir). This manipulation affected behavior, primarily during the naming of pseudowords, and modulated brain activity in the left mid-fusiform sulcus, at a site medial to the classical visual word form area (VWFA). This putative grapheme-related area (GRA) differed from the VWFA in being preferentially connected functionally to dorsal parietal areas involved in letter-by-letter reading, while the VWFA showed effects of lexicality and spelling-to-sound regularity. Our results suggest a partial dissociation within left occipitotemporal cortex: the mid-fusiform GRA would encode orthographic information at a sublexical graphemic level, while the lateral occipitotemporal VWFA would contribute primarily to direct lexico-semantic access.
S
IGNIFICANCE
S
TATEMENT
The Visual Word Form Area (VWFA) is essential to reading. Yet, the exact representations that it harbors are unclear. We tested the hypothesis that a subregion of ventral visual cortex may be specialized for the perception of multi-letter graphemes such as “ch” or “ou”. Indeed, the selective disruption of graphemic information impaired reading behavior and modulated brain activity in a mesial region around the mid- fusiform sulcus. In contrast, the VWFA was modulated by lexical variables. Those findings suggest a medial-to-lateral division of labor within the ventral occipitotemporal cortex. The existence of a "grapheme area", its functional dissociation from the VWFA, and their collaboration bear important implications for the understanding of reading acquisition and of inter-individual differences in reading skills.
Keywords: Reading ; grapheme processing ; visual word form area ; complex graphemes
I
NTRODUCTION
Alphabetic scripts constitute the majority of the writing systems used today around the world. They rely on the core principle of a correspondence between visual signs and speech sounds. There may be a one-to-one mapping between letters and sounds (e.g. BED and /bɛd/), but phonemes are also frequently represented by groups of letters (for instance, OO in loop). Hence, the orthographic units that represent a single phoneme, called graphemes, can comprise either a single letter or a group of letters (e.g. ee, ch, ough).
Behavioral studies show that multi-letter graphemes act as cohesive perceptual reading units. Detecting a target letter is more difficult when it is embedded in a multi-letter grapheme than when it stands for a phoneme on its own (e.g., detect the letter A in bait vs. cat; 1–3). In addition, complex graphemes are more difficult to read than simple ones, as shown by slower naming latencies for real words or pseudowords comprising complex graphemes (e.g., FOOCE /fus/ vs. FRULS /fruls/, 4–6). Graphemic complexity also impacts word writing, as subjects slow down just before a multi-letter grapheme, in proportion to its number of letters (7). In the current study, we investigated the existence of a distinct cortical representation of graphemes as orthographic units.
The extraction of orthographic information is carried out by the left-hemispheric ventral occipitotemporal (VOT) cortex, particularly in the so-called Visual Word Form Area (VWFA), a region whose lesions induce pure alexia (8–11). Over the past 15 years, brain-imaging studies in normal subjects have uncovered a host of reading-related functional features of the VWFA (for reviews, see 12–14), and have shown that it probably hosts multiple orthographic representations of letters (15, 16), bigrams (17), and short words (18). Our goal was to determine if the VOT areas involved in reading can be subdivided into subregions that care or do not care about graphemes.
We took advantage of the fact that in French complex graphemes are particularly frequent, such that most vocalic phonemes may be written as multi-letter graphemes (e.g. /o/ can be written O, but also AU, EAU, AUX, etc). This allowed us to facilitate or disrupt graphemic encoding by coloring and spacing the letters either congruently with multi-letter graphemes (ch-am-pi-gn-on), or incongruently with them (c-ha-mp-ig-no-n), a method inspired by previous studies of syllabic units (19). We assessed the impact of this manipulation of graphemic congruency on reading behavior and brain activity in various tasks.
Indeed, it has been proposed that the involvement of a graphemic representation may vary as a function of the nature of the task and of the target. Grainger and Ziegler (20) argue that an ordered list of graphemes, called a “fine-grained” orthographic code, is necessary to accurately map orthography into phonology. In contrast, accessing lexico-semantic information may rely on informative subsets of possibly non-contiguous letters (a “coarse-grained” code). According to this hypothesis, the perceptual disruption of multi-letter graphemes should have a stronger impact on performance and activations during tasks that emphasize phonological processing rather than lexico-semantic processing. Accordingly, the presence or the manipulation of multi-letter graphemes has a larger impact on pseudowords than words (6), on words of low rather than high frequency (5), and in letter detection vs. lexical decision tasks (21). Furthermore, two patients with a selective impairment of pseudoword reading also showed a disproportionate deficit with pseudowords containting complex graphemes (22). Therefore, we sought to manipulate the importance of graphemic processing by varying the phonological requirements contingent on tasks and stimuli.
Our approach is focused on orthographic perception, and is compatible with the main cognitive theories of reading. Basically, all models posit that there are distinct orthographic, phonological, and lexico-semantic representations, subserved by distinct brain areas, and that reading results from the interaction of those representations (e.g. 23–25, see 26 for a review). They also agree that variations in tasks and stimuli can place variable emphasis on phonological and lexico-semantic processes. The core differences between the prevalent Triangle, DRC, and CDP+ models concern the existence of purely lexical processes independent from semantic
representations, and the purely sublexical nature of the phonology pathway (see 26 for a discussion of these differences). Although those divergences may generate contrasted predictions on reading behavior, they are marginal when it comes to the current issue. Notably, although our experimental design examines graphemes as the main input for phonological access, it is also compatible with phonological processing at higher orthographic grain sizes. To the shared set of assumptions, we only add the proposition that distinct orthographic codes may exist, and that spelling-sound mapping should rely more on graphemic representations.
Our experimental design may be summarized as follows. In order to identify VOT regions supporting graphemic representations during reading, we manipulated several parameters that should modulate the reliance on grapheme processing (Fig. 1A). First, in the main experiment, the color of the letters within each stimulus alternated in a way that was either congruent or incongruent with the boundaries of graphemes.
Second, in this same experiment, we modulated the emphasis on phonological processing, (i) by contrasting
pseudowords vs. real words; (ii) by contrasting reading aloud, which demands the production of a phonological output, vs. lexical decision, in which the required response ultimately depends on lexico-semantic information.
Third, in a shorter localizer experiment, we manipulated two parameters which apply only to real words and
affect their reading: (i) We contrasted words with regular vs. irregular grapheme-phoneme correspondence (e.g. MINT vs. PINT). Irregular (or exception) words cannot be read by patients with a damaged lexico-semantic system (27, 28), and they activate the semantic system more than regular words (29, 30). (ii) We contrasted words with high vs. low frequency, a parameter which impacts most aspects of word reading and modulates VWFA activation (31). The localizer experiment also served for the identification of the VWFA independently from the main experiment, by contrasting words vs. low-level control stimuli.
Fig. 1: A. Example stimuli of the main experiment. Words and pseudowords were split into colored fragments whose coloring either
matched the grapheme boundaries (congruent chunking) or was incongruent with them (incongruent chunking). B. Effects of graphemic congruency on error rates (left panel) and reaction times (RTs, right panel). Histograms show the mean (± SEM) of the beta estimates of the graphemic congruency effet, after regressing out stimulus-level variables such as word length. *: p<0.05; **: p<0.01. Incongruent trials induced more errors and slower responses only during reading aloud, and especially when reading aloud pseudowords, i.e., the conditions that relied most on phonological processing.
Figure 1
** *Error rates
** *Response Times
Lexical decision Reading aloud
Standard coefficient of congruency (ß) Standard coefficient of congruency (ß)
Lexical decision Reading aloud
W PW
congruent chunking incongruent chunking
words (W) ch am p i gn on c ha mp ig no n pseudo-words (PW) ch an d i ss on c ha nd is so n
A Experimental conditions
B Behavioral results
W PWWe made the following predictions. First, grapheme disruption should impair reading performance, and do so to a greater extent when task and stimuli put more emphasis on phonological processing. Thus, reading aloud pseudowords should be the most affected condition, and lexical decision with real words the least affected. Second, a subregion of the VOT cortex that encodes graphemes, if it exists, should be modulated by grapheme disruption, again mostly when task and stimulus require phonological decoding. Third, this region should be modulated by sub-lexical parameters such as word length, more than by lexical parameters such as lexicality, frequency or regularity. The opposite pattern should prevail in other parts of the VOT cortex more involved in lexico-semantic processing. Fourth, a grapheme region should show a greater functional connectivity with distant regions participating in phonological mapping, as compared to other parts of the VWFA.
R
ESULTS
Behavioral results. In the main experiment, participants had an average error rate of 5.2% and a mean reaction time (RT) of 752ms in lexical decision, and of 12.6% and 761ms for reading aloud. The effect of congruency, our main factor of interest, was assessed by computing for each participant, separately for error rates and RTs, a standard beta coefficient for the congruency factor, corrected for other variables such as word length, in each task x lexicality condition. These beta coefficients were then compared to zero (no effect of congruency) and entered in a repeated-measure ANOVA to assess the modulation of congruency by task and lexicality. Raw error rates and RTs showed qualitatively the same pattern of congruency effects. These results are reported in SI Appendix Fig. S1.
For error rates, incongruent stimuli induced overall significantly more errors than congruent stimuli (t(19)=2.84, p=0.01). This effect was modulated by task, with a marginally larger congruency effect when reading aloud than during lexical decision (interaction F(19,1)= 3.85, p=0.06). There was no effect of lexicality on congruency (p=0.17), nor an interaction of lexicality x task (p=0.10). When restricted to each of the four combinations of task x lexicality, the effect of congruency was significant only in the most phonological condition, i.e. reading aloud pseudowords (t(19)=3.69, p=0.002; Fig. 1B).
RTs showed similar patterns. There was a significant main effect of congruency (t(19)=2.86, p=0.01), with longer RTs for incongruent stimuli. The congruency effect interacted with task (F(19,1)= 6.82, p=0.017), with larger effects when reading aloud. There was no interaction of congruency x lexicality (p=0.29), nor of lexicality x task (p=0.38). Similarly to error rates, the largest effect of congruency was observed when reading pseudowords aloud (t(19)=3.50, p=0.002, Fig. 1B), although congruency was also significant when reading words aloud (t(19)=2.64, p=0.016). The difference between these two conditions did not reach significance (p=0.14).
In sum, as predicted from the hypothesis that graphemic representations contribute primarily to phonological processes, the disruption of complex graphemes yielded more errors and longer RTs mostly in the condition with highest phonological demands.
In the localizer experiment, we observed main effects of frequency and regularity, and a larger effect of regularity for low- than high-frequency words (SI Appendix, Fig. S2).
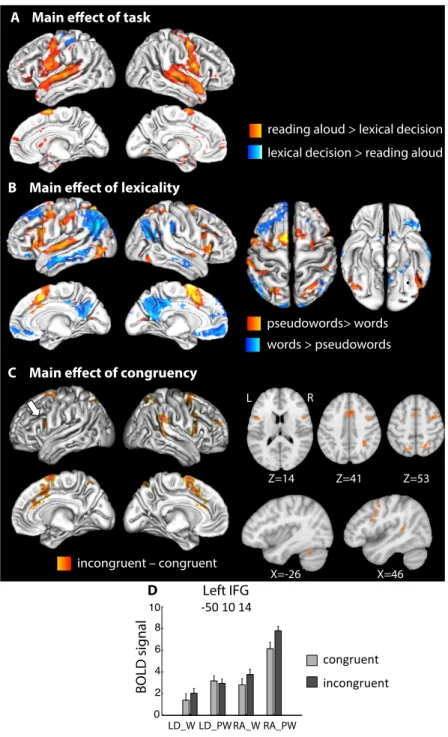
Impact of task, lexicality and grapheme disruption on whole-brain activations. First, we investigated the effects of task, lexicality and graphemic congruency at the whole-brain level. Compared to naming, lexical decision induced increased activations in left superior sensorimotor cortex, as response was given through a button press with the right hand (Fig. 2A and SI Appendix Table S2). Conversely, reading aloud recruited motor and auditory cortices to a greater extent, as well as the superior cerebellum and perisylvian language regions
including the superior temporal gyrus (STG) and the inferior frontal gyrus (IFG), consistently with the additional auditory, phonological and articulatory input/output components of this task. Fig. 2: A. Main fMRI effect of task. B. Main fMRI effect of lexicality across tasks. (Black dots indicate the group peaks of the grapheme-related area and VWFA for reference, see below.) C. Main fMRI effect of graphemic congruency averaging both tasks. Incongruent stimuli induced stronger activations in parieto-frontal regions involved in attentional control. D. Activation at the peak of the left IFG cluster (LD: lexical decision; RA: reading aloud; W: word; PW: pseudoword). The histogram represents the mean BOLD signal per condition (± SEM after subtraction of each subject’s overall mean).
The main effect of lexicality was wide-spread. Pseudowords recruited the reading network more than real words, including the bilateral occipito-temporal sulci (OTS), bilateral intra-parietal sulci (IPS), language and motor regions including the insula, the IFG, the STG with a leftward predominance, as well as the supplementary motor area (SMA) and the cerebellum (Fig. 2B and SI Appendix Table S2). Words on the opposite induced higher activations (or smaller deactivations) in regions of the semantic and default mode
LD_W LD_PW RA_W RA_PW 0 2 4 6 8 10 MNI : 50 10 14 Z=41 Z=14 R L Z=53 incongruent – congruent C X=-26 X=46
Main effect of congruency
D Left IFG
BOLD signal
-50 10 14
reading aloud > lexical decision lexical decision > reading aloud
pseudowords> words words > pseudowords
B Main effect of lexicality A Main effect of task
congruent incongruent
networks, including the bilateral middle temporal gyri, precuneus, angular gyri and ventro-medial prefrontal cortex, as well as the right supra-marginal gyrus (SMG) and the left superior frontal gyrus.
The effect of graphemic congruency revealed stronger activations in the incongruent than the congruent condition in a right-predominant parieto-frontal network (Fig. 2C and SI Appendix Table S2). Activated clusters included bilaterally the frontal eye field (FEF), the IPS, the IFG pars opercularis, the anterior cingulate cortex (ACC), the SMA, plus the right SMG, and the left cerebellum. No region showed stronger activations for congruent strings. This set of regions shows a partial overlap with regions more activated for pseudoword than word reading (Fig. 2B), and for strings of increasing letter length (SI Appendix, Fig. S3). The topography of the congruency effect was very similar to attentional networks (32), consistent with an increased engagement of spatial attention to achieve grapheme binding in the incongruent condition.
We further assessed the congruency effect, restricting the analysis within the volume activated by reading compared to rest (all stimuli > rest, voxelwise p<0.01). There was a significant effect of congruency in Broca’s pars opercularis (IFGop), the right IPS, ACC and right motor cortex. Finally, we tested whether the latter regions showed the predicted modulation of the congruency effect by phonological demands. At the peak voxel, the IFGop showed a congruency x task interaction (F(1,19)=6.14, p=0.02; Fig. 2D), with an effect of congruency during reading aloud (F(1,19)=20.88, p<0.001), but not during lexical decision (p>0.1). No other cluster showed a significant interaction of congruency with task or lexicality at its peak voxel.
Effects of congruency in the left VOT. Our main goal was to identify subregions of the VOT involved in fine-grained graphemic coding. We therefore performed analyses restricted to a region of interest encompassing the left VOT between MNI Y=-70 and Y=-30.
Group-level analysis. Within this mask, no region showed a main effect of congruency. As we expected the
effect of congruency to be larger in conditions with higher phonological demands, we compared the congruency effect in the most demanding versus the least demanding conditions, i.e. during reading aloud pseudowords minus lexical decision on words. This contrast revealed a cluster around the mid-fusiform sulcus approaching statistical significance (q = 0.058; MNI -32 -58 -14, Z=4.93, Fig. 3A). Activation profiles at the peak of this cluster showed a trend in the expected direction for pseudowords (incongruent > congruent), while real words showed the opposite pattern (congruent > incongruent, Fig. 3B). Fig. 3: A. Comparison of the graphemic congruency effect between conditions involving the most vs. the least phonological demands (i.e.
reading aloud pseudowords vs. lexical decision on words). B. Activation profile at the peak of this mid-fusiform cluster. (LD: lexical decision; RA: reading aloud; W: word; PW: pseudoword). Histograms represent the mean BOLD signal across participants (± SEM after subtraction of each subject’s overall mean)
Correlation with behavior. Considering that participants may differ in their relative reliance on the
phonological and lexico-semantic pathways, and hence on graphemic encoding, we assessed the correlation between brain activations and reading behavior. Individual standard beta coefficients of the congruency factor
congruent
incongruent
B
) )
Z= -14
Y= -58
R
L
A
( incongruent – congruent ) x ( RA PW – LD W )
LD_W LD_PW RA_W RA_PW 0 1 2 3 4 BOLD signal MNI : 32 58 14BOLD signal
LD_W LD_PW RA_PW-32 -58 -14
RA_WInteraction of congruency with
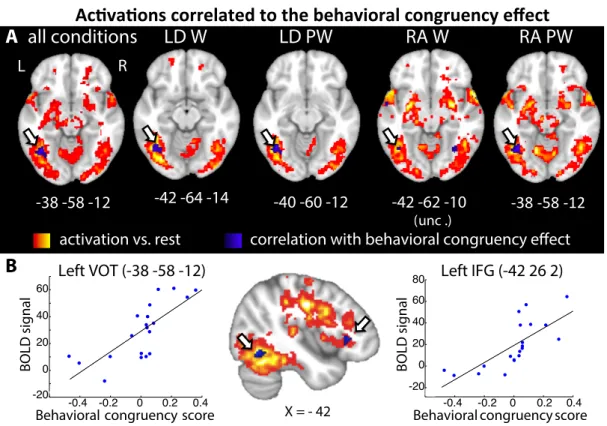
on reaction times, as computed in the condition with highest demands on the phonological, i.e. when reading aloud pseudowords, were used as an index of behavioral congruency effect. We then looked for regions whose activation versus rest would be correlated with those scores across subjects. A cluster in the left VOT was positively correlated with behavioral scores when pooling all conditions (q=0.007, corrected within the left ventral region of interest, or ROI, Fig. 4A). The same cluster was significant in three of the four combinations of lexicality x task (LD_W: q=0.022; LD_PW: q=0.006; RA_PW: q=0.009), and did not reach extent threshold when reading aloud words (q=0.24). This cluster overlapped with the cluster showing an interaction of congruency and phonological demands (Fig. 3), supporting its role in grapheme encoding. A similar correlation was also observed in Broca’s area (Fig. 4B). Fig. 4: A. Positive correlation between reading activations vs. rest and individual behavioral sensitivity to congruency, in the VOT cortex (blue), overlaid on overall activations vs. rest (hot), showing a reproducible cluster in the left mid-fusiform sulcus (arrows). B. Whole-brain analyses showed an additional area of positive correlation between behavior and average activation vs. rest in the left IFG (bottom center). Scatterplots illustrate the correlations in the left VOT and IFG peak voxels. (LD: lexical decision; RA: reading aloud; W: word; PW: pseudoword)
Two functionally distinct orthographic areas in left occipito-temporal cortex. So far, both graphemic congruency and individual sensitivity to grapheme manipulation modulated activations in a region of the left fusiform gyrus (MNI -32 -58 -14). This region is mesial and posterior to the typical peak of the VWFA as identified by contrasting words minus low-level controls, in previous reports (e.g. MNI −45, −57, −12, 33), as well in the present localizer experiment (words > checkerboards: MNI -50 -52 -22; Z=5.15). Fig. 5 shows the respective location of those two areas, which both belong to the large patch of cortex more activated by words than fixation. For simplicity, we will call them the putative grapheme-related area (GRA) versus the main VWFA. We next compared those two areas, in terms of their sensitivity to several variables that modulate the recruitment of phonological and lexico-semantic pathways (Fig. 2, 6, and SI Appendix Fig. S3-5), and of their functional connectivity to the rest of the brain (Fig. 7). Because the properties of the VWFA are best captured using individual ROIs (34), we report the properties of the main VWFA based on individually defined regions. Analyses on the properties of the GRA were carried out at its group-level peak voxel. For completeness, we also report results obtained at the group-level peak of the
! !
activation vs. rest
correlation with behavioral congruency effect
B
-38 -58 -12
B
X = - 42R
L
Activations correlated to the behavioral congruency effect
Left IFG (-42 26 2)
Behavioral congruency score
BOLD signal -0.4 -0.2 0 0.2 0.4 -20 0 20 40 60
-38 -58 -12
-42 -64 -14
-40 -60 -12
-42 -62 -10
(unc .)Behavioral congruency score
BOLD signal -0.4 -0.2 0 0.2 0.4 -20 0 20 40 60 80
Left VOT (-38 -58 -12)
RA PW
LD PW
RA W
LD W
A all conditions
VWFA in the SI Appendix (Fig. S6&7). Both analyses show a similar pattern of dissociation between the two ROIs, as described below.
Fig. 5: Localization of the proposed grapheme-related area (GRA, blue), as identified based on its modulation by graphemic congruency
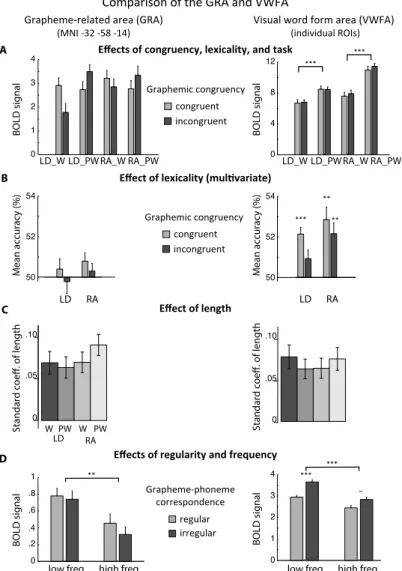
(Fig. 3), compared to the VWFA (red). The VWFA was identified based on the localizer experiment by subtracting word reading minus checkerboards. The GRA was located mesially to the VWFA identified both at the group level (surface view, left panel) and at the individual level (right panel: overlap of individual ROIs across subjects, thresholded at 20% of all participants). Both the GRA and the VWFA were more activated by words than fixation (gold on the surface view). Parameters modulating the activation of the GRA and VWFA. Under the hypothesis that the GRA is involved in phonological reading, we expected that it should be more sentitive than the VWFA to congruency and length, while the VWFA should be more sensitive to lexicality, frequency, and regularity. To anticipate on the results, this is essentially what we found, and whole-brain investigations of the same variables confirmed this lateral-to-mesial dissociation.
Effects of congruency, lexicality, and task: The mesial/grapheme region naturally showed an interaction between congruency and phonological demands, as this is how it was first identified (Fig. 3B and 6A). In contrast, the lateral VWFA was insensitive to congruency (p=0.65) and to congruency x phonological demands (congruency x (RA PW – LD W): p=0.53). Unsurprisingly given the definition of the GRA, the two regions differed significantly in the interaction of congruency by phonological demands (ROI x congruency x phonological demands: p=0.0052). The lateral VWFA showed a strong effect of lexicality, with a larger
activation to pseudowords than to words (p < 10-6), in agreement with the corresponding difference in RT and
error rate (SI Appendix, Fig. S1). This effect was further modulated by task (task x lexicality interaction; p = 0.044), with a larger influence of lexicality when reading aloud than during lexical decision, again congruent with behavior. Such a modulation was absent in the grapheme area (p=0.11). The two regions differed significantly in their sensitivity to lexicality (ROI x lexicality: p < 10-6).
In agreement with those ROI analyses, whole-brain statistics showed a significantly greater activation to pseudowords than to words laterally along the occipito-temporal sulcus (OTS), while there was no such lexicality effect in more mesial regions (Fig. 2B).
Multivariate analysis of lexicality effects: The observation a univariate lexicality effect in the VWFA but not in the GRA yet does not demonstrate that real words and pseudowords are actually processed identically in the mesial region. In order to better address this issue, we classified words from pseudowords based on multivariate activation patterns, separately for each task and congruency condition. We ran a searchlight analysis across the VOT mask, after z-scoring activation patterns to prevent univariate effects from biasing the
words - checkerboards
words - fixation
congruency x phonology
L
R
Z = -14R
L
The mesial grapheme-related area (
GRA
) and the lateral
VWFA
overlap of individual VWFAs
across subjects
classification. Accuracy around the peak voxel of the mesial region and within individual VWFAs is depicted in Fig. 6B and searchlight accuracy maps in SI Appendix Fig. S4.
In the GRA, classification was not better than chance (p=0.38), and was not modulated by task or congruency (all p>0.27). In contrast, classification accuracy was above chance in the lateral region (p<10-4), with a trend for
better classification when reading aloud compared to lexical decision (F(1,19)=3.77, p=0.067) but no modulation by congruency (p=0.12) or task x congruency (p=0.59). There was a significant difference between regions in overall classification accuracy (p < 0.001). Better lexical classification laterally than mesially was also visible on accuracy maps (SI Appendix, Fig. S4). Interestingly, analyses both at the ROI level and using the searchlight suggest that classification was better with congruent than incongruent stimuli in the lateral/main VWFA region. Those differences did not reach significance, but the trend indicates that disrupting graphemes may blur the difference between words and pseudowords in the VWFA.
Fig. 6: Comparison of the responses of the GRA and VWFA to variables modulating phonological and lexico-semantic mappings. A. Effects
of congruency, lexicality and task. The GRA showed an interaction of congruency with phonological demands, as defined, while it was insensitive to lexicality. The VWFA showed the opposite pattern. (Histograms show the mean BOLD signal ±SEM after subtraction of each subject’s overall mean.) B. Classification accuracy of words vs. pseudowords (50%=chance level; mean ±SEM after subtraction of each subject’s overall mean). Classification was above chance only in the lateral region, and significantly more accurate laterally than mesially.
C. Standard beta estimates of the length effect (mean ± SEM). The effect was present in both regions, with no significant difference
between regions. D. Effects of word regularity and frequency in the localizer experiment (mean ±SEM after subtracting each subject’s overall mean). Only the lateral region showed an effect of regularity, while both regions were sensitive to frequency. (**: p<0.01; *: p<0.05; ~: p<0.07).
Effects of regularity and frequency D
A Effects of congruency, lexicality, and task
BOLD signal 0 4 8 12 *** *** C Effect of length Mean accuracy (%)
LD_C LD_I RA_C RA_I 1 0 1 2 3 4 Mean accuracy LD RA Standard coe ff. of length ind graph LD_W LD_PW RA_W RA_PW
Standard coefficient of length
0.00 0.05 0.10 0.15 graph lat LD_W LD_PW RA_W RA_PW 0.15 Standard coe ff. of length graph lat LD_W LD_PW RA_W RA_PW
Standard coefficient of length
0.15 graph lat LD_W LD_PW RA_W RA_PW
Standard coefficient of length
0.00 0.05 0.10 0.15 0 .2 4 .6 .8 1 MNI : 32 58 14
low freq. high freq. ** BOLD signal 0 1 2 3 4 *** *** ~
low freq. high freq.
BOLD signal
LD_C LD_I RA_C RA_I 1 0 1 2 3 4 Mean accuracy Mean accuracy (%) LD RA ** ** *** 0 1 2 3 4 BOLD signal (individual ROIs)
Visual word form area (VWFA)
(MNI -32 -58 -14)
Grapheme-related area (GRA)
Comparison of the GRA and VWFA
Effect of lexicality (multivariate)
congruent incongruent regular irregular Grapheme-phoneme correspondence B W PW W PW LD RA 1 2 3 4 49 50 52 54 1 2 3 4 49 50 52 54 Graphemic congruency 0 .05 .10 0 .05 .10 LD_W LD_PW RA_W RA_PW LD_W LD_PW RA_W RA_PW .4 congruent incongruent Graphemic congruency
Effect of length: The effect of length on the activation of the two regions was assessed based on the single-trial beta maps used for MVPA. We observed a significant effect of length in both regions (p<10-4), not modulated by task or lexicality (Fig. 6C). The length effect did not differ between the GRA and the VWFA (main effect of ROI: p=0.70). Whole-brain analyses showed activations increasing with the number of letters in bilateral mesial and ventral occipital cortex (SI Appendix, Fig. S3C). In the left hemisphere, this cluster overlapped with the mesial/grapheme area and stopped mesial to the VWFA. Hence, whole-brain maps supported differences in length effects between the VWFA and GRA.
Effects of regularity and frequency: The VWFA and GRA differed in their sensitivity to regularity and frequency, two variables manipulated in the localizer experiment. The GRA showed a significant effect of frequency (low > high frequency: p=0.0017), no effect of regularity (p=0.46), and no interaction (regularity x frequency, p=0.70). In contrast, the VWFA showed significant effects of both frequency (low > high frequency, p<0.001) and of regularity (irregular > regular: p=0.005), with an interaction (larger regularity effect for low- than high-frequency words; p=0.044). The interaction of region x regularity was significant (p<0.001), while the region x frequency interaction was marginal (larger frequency effects in the VWFA than in the GRA; p=0.057). W hole-brain maps showed both frequency and regularity effects laterally along the OTS, with no significant mesial activations (SI Appendix, Fig. S5 B and D). In summary, analyses in the two VOT ROIs (Fig. 6) and at the whole-brain level (Fig. 2, S3, S4 and S5) support the interpretation of the more mesial GRA as encoding graphemes for access to phonology, while the more lateral VWFA is more sensitive to variables that modulate access to semantics. The GRA was more sensitive to graphemic congruency (as used to isolate this region). A lateral-to-mesial gradient in the effects of length also suggested higher sensitivity of the GRA to length. Instead, the lateral region was more sensitive to lexicality and regularity.
Functional connectivity. If the GRA region is implicated in grapheme encoding, it should be connected to
parietal attentional areas that were previous found to be involved in effortful reading in adults (35), in young children (36), and in letter-by-letter alexic patients (37) as well as to superior temporal regions coding for phonology (38, 39). Furthermore, the exchange of information with those areas should also be higher when the situation puts a heavier emphasis on the phonology. To address those predictions, areas showing functional connectivity with the GRA and VWFA during task were analyzed by means of correlations in single-trial beta series (40). We compared the connectivity arising from those two seeds, and their modulations by task and stimulus demands. First, we observed that the lateral VWFA was overall, during both tasks of our main experiment, more strongly connected to most of the brain than the grapheme area, with preferential connectivity notably encompassing regions of the reading and language networks (Fig. 7A). Beyond the immediate surroundings of the GRA, only the precuneus and the ACC showed stronger connectivity to the GRA than to the VWFA, supporting the idea that the VWFA is the principal input to the reading circuit of adult readers. Next, we looked for regions showing a greater connectivity with the GRA as phonological demands increased, i.e. when reading aloud pseudowords (RA PW) more than during lexical decision on words (LD W). This contrast showed VOT cortex surrounding the GRA, including the lateral VWFA peak. There was also increased connectivity with the left IPS, IFG and motor cortex, and with the bilateral ventral prefrontal cortex (and cerebellum (Fig. 7B). When the same analysis was done using individual VWFAs as seeds, by contrast, greater phonological demands increased the connectivity of the lateral VWFA region to the left postcentral and supramarginal gyri, and to bilateral superior temporal gyri, cerebellum, and insula and inferior frontal gyri, as
well as right anterior parahippocampal cortex (Fig. 7C). We then compared this modulation of connectivity for the two regions of interest. This showed that the increase in functional connectivity to the left IPS with higher phonological demands was larger for the GRA than for the VWFA (Fig. 7D). Conversely, compared to the grapheme area, the lateral VWFA had increased connectivity by phonological demands to the right motor cortex, anterior superior frontal gyrus and ACC, bilateral insula and IFG, and right superior temporal cortex.
Fig. 7: Functional connectivity of the GRA and VWFA. A. Across the main experiment, the VWFA was overall more connected to most of
the brain, while the GRA was more connected only to its surroudings, the precuneus and the ACC. B. Modulation of the connectivity of the mesial region by phonological demands (RA PW – LD W). Phonological demands notably increased the connectivity of the GRA to the VWFA and left IPS. C. Modulation of the connectivity of the lateral region by phonological demands (RA PW – LD W). D. Differences between the GRA and VWFA in the modulation of their functional connectivity by phonological demands. The GRA was more connected to the left IPS in conditions with high phonological demands compared to the VWFA. E. Meta-analytic maps of functional co-activations of the two regions. Beyond the substantial overlap of the two maps (purple), the GRA tends to co-activate more with dorsal frontoparietal and supramarginal regions (blue), while the VWFA has preferential co-activations with the IFG, lateral and anterior temporal lobe (hot colors). RA PW > LD W
Meta-analytic maps of co-activations (Neurosynth) D C E RA PW > LD W Z = 42 X = -38 X = -4 Z =42 Z = -2 Z = -12 A Z = 42 Y = -62 Z = 0 Z = 54 Z = 44 GRA > VWFA VWFA > GRA GRA & VWFA
L R
X = -52
B
Differences between the two regions in this modulation
(VWFA > GRA) x (RA PW > LD W) (GRA > VWFA) x (RA PW > LD W)
GRA connectivity: modulation by phonological demands
VWFA connectivity: modulation by phonological demands
GRA > VWFA VWFA > GRA
Difference in connectivity between ROIs (main effect)
Functional connectivity of the GRA and VWFA
Z = -16 Z = 0 Z = -12
Finally, we compared the pattern of coactivation of the two VOT regions using meta-analytic maps of co-activations obtained from the Neurosynth website (41). Note that in the absence of formal statistical testing, those comparisons should be taken with caution. The two regions share extensive coactivations (Fig. 7E). Moreover, the lateral VWFA region co-activates more than the mesial region with a set of inferior frontal and lateral temporal areas implicated in reading and language (see e.g. SI Appendix, Fig. S5A). Conversely, the mesial region co-activates more than the VWFA with bilateral dorsal occipital and frontoparietal areas, including the IPS linked to the GRA (Fig. 7B-C).
In short, the GRA had preferential interactions with the IPS compared to the lateral VWFA, especially in conditions of high phonological demands. However, we did not observe a specific connectivity of the grapheme area towards regions directly involved in phonological encoding. Instead, the lateral VWFA seemed to serve as the interface between the grapheme area and the reading network, especially in conditions of high phonological demands.
D
ISCUSSION
We investigated the neural representations of graphemes, the natural orthographic input for phonological access (20, 42). The ease of grapheme perception was modulated by segmenting strings of letters either congruently or incongruently with the boundaries of graphemes. Moreover, we modulated phonological demands, which are assumed to enhance graphemic processing, by contrasting real words vs. pseudowords, and lexical decision vs. overt naming, while varying length, frequency, and regularity. We now discuss the predictions put forward in the introduction.
Grapheme disruption impairs reading and recruits attentional processes. The visual disruption of graphemes led to slower reading, an effect that was largest in conditions maximizing the demands on phonology, i.e. when reading aloud, particularly pseudowords. Error rates, although less significant, followed exactly the same pattern. This novel behavioral finding supports our first prediction, and is the cornerstone of the whole imaging study as it demonstrates the relevance of multi-letter graphemes as perceptual units (1–7, 21). It also supports the prominent role of graphemes during phonological reading, in agreement with evidence that the effect of grapheme complexity is larger on pseudowords than words (6), on words of low rather than high frequency (5), and during letter detection rather than lexical decision (21). Those findings thus validate all the experimental factors that we used for studying grapheme perception.
In whole-brain activations, we observed larger activation for incongruent than congruent stimuli in regions involved in attentional control (32), including the dorsal (IPS and FEF), and ventral (right temporo-parietal junction and IFG) attentional networks. An effect of congruency was also observed in the ACC, a region involved in conflict monitoring (43), and in the left IFGop, probably reflecting its role in phonological processing. Noticeably, the left IFG shows intruiguing similarities to the VWFA in its sensitivity to orthography (see SI Appendix, Supplementary Discussion). Presumably, incongruency requires additional executive attention in order to overcome the improper chunking of multi-letter graphemes.
A region for grapheme encoding in left mesial VOT. In agreement with our second prediction we found that a left VOT region, which we propose to call the grapheme-related area (GRA), was modulated by graphemic congruency depending on phonological demands. This region peaks at MNI -32 -58 -14, in the mid-fusiform sulcus, which divides the fusiform gyrus longitudinally. The GRA was also more activated in participants whose reading performance was more sensitive to grapheme disruption. The GRA lies mesial to the main peak of the VWFA, which falls in the OTS, lateral to the fusiform gyrus (13). Sensitivity to graphemic congruency was absent in regions lateral to the GRA, around the main peak of the VWFA. While we used an a priori mask of left VOT because of the strong lateralization of orthographic processing, similar comparisons in the right VOT showed either absent or much weaker effects.
The location of the GRA along the postero-anterior axis (MNI y=-58) fits with the view that posterior sectors of the left VOT encode single letters, or small letter groups, while more anterior regions support the encoding of larger groups, probably including whole words (16, 18, 44, 45). Rothlein and Rapp (46), using representational similarity analysis, found a left ventral mesial region tuned to abstract letter identity and partially overlapping with our mesial/grapheme area. Different sensitivity profiles of the GRA and the VWFA. According to our third prediction, the GRA should be less affected than the VWFA by parameters that modulate lexico-semantic processing. The two regions indeed showed a meaningful pattern of dissociation. First, only the VWFA was sensitive to lexical status. Univariate analyses showed stronger activations to pseudowords than to words at this site, as previously reported during both reading aloud and lexical decision (26). This difference may be related to task-dependent top-down effects (e.g. holding the stimulus on-line for a longer time for pseudowords), as it vanishes in studies with passive viewing (45) or low-level non-linguistic tasks (47). We confirmed the mesial vs. lateral dissociation using multivariate classification of words vs. pseudowords, which performed above chance in the lateral but not the mesial region. Thus, words and pseudowords can be differentiated in the VWFA, as previously observed (18, 39, 48), but not in the GRA.
Second, only the VWFA was sensitive to spelling-to-sound regularity, with higher activations for irregular than regular words, following the same pattern as behavioral responses (SI Appendix, Fig. S2) and as previous imaging data (29, 49). This observation may be related to a preferential recruitment of the lexico-semantic pathway by irregular words (29, 30), but processing words with irregular spelling-to-sound mappings may also place additional effort on spelling-sound mapping, or increase activations in regions responsible for integrating the mistmatching information between phonological and lexico-semantic information (see e.g. 26, 49). Third, apart from its interaction with regularity, we expected that frequency per se, as a marker of lexical processing, would affect mostly the lateral, rather than the GRA. We observed that frequency affected both ROIs, with a trend of a larger effect laterally, confirmed by voxelwise analyses (SI Appendix, Fig. S5B). Sensitivity of the VOT to frequency has been reported previously (31, 49–51), in a broad expanse of VOT cortex overlapping with both our ROIs (49). Actually, both here and in (49), a frequency effect was also present in occipital cortex, suggesting that the longer processing time of low-frequency words induces stronger activation throughout the visual cortex.
We expected that stimulus length would affect the GRA more than the VWFA. Actually, an effect of length prevailed in both ROIs. Indeed, length is a major perceptual parameter which affects occipital and temporal activations extensively back to the primary visual cortex (49, 51–53). Still, in line with our prediction, voxel-based analyses revealed length effects in the mesial VOT cortex, including the GRA, but no significant effect in the more lateral VWFA (SI Appendix, Fig. S3), hence reproducing results from (49) and (53). Analyses at the VWFA group peak (SI Appendix, Fig. S6) also showed larger length effects medially in the GRA than in the VWFA.
In summary, the effects of congruency, lexicality and regularity followed the predicted dissociation between the lateral and mesial sectors of the VWFA, while frequency and length showed trends for such topographical specialization.
Functional connectivity of the VOT during phonological reading. In accord with our fourth prediction, we found that the GRA was more connected to the left IPS and to the left IFG, but also to the VWFA, when the task emphasized phonological processing as opposed to lexico-semantic reading (Fig. 7B). With the same contrast, the VWFA was more connected to left SMG and superior temporal cortex. Importantly, only the pattern of connectivity to the IPS was specific to the GRA, while connectivity to the IFG, insula and superior temporal regions were more specific of the VWFA.
The functional connectivity of the GRA with the IPS fits with previous evidence for the implication of the IPS in serial reading and spatial attention, two characteristics of the orthography-to-phonology pathway. For instance, the IPS is recruited when words are visually degraded by spacing or rotation, forcing a serial reading strategy (35). IPS lesions produce a reading impairment only under conditions of visual degradation that require accurate spatial scanning (54). The implication of parietal regions in serial reading is also supported by the observation of a length effect in the IPS (SI Appendix, Fig. S3), of letter position decoding in the left IPS (55), or that IPS activations to strings with transposed letters predict individuals’ accuracy in detecting this tranposition (56). In children, superior parietal regions are important nodes of the reading network, especially at the earliest stages of reading, when children rely most on serial grapheme-phoneme decoding (36, 57–60). In addition, Yu et al. (61) showed that greater improvements in phonological skills correlated longitudinally with increases in the functional connectivity between the IPS and posterior VOT in a population of emerging readers. Similarly, IPS activations are inversely correlated to reading proficiency in adult readers (62).
This difference in functional connectivity to the IPS may result from differences in anatomical connectivity between the VWFA and the GRA. Indeed, the location of the GRA matches the endpoints of the vertical occipital fasciculus (63), while the VWFA is more preferentially connected to perisylvian language areas through the arcuate fasciculus and its posterior segment (64, 65). These anatomical differences, together with the retinotopic sensivity of the GRA but not VWFA (66), likely predispose this mesial region to the encoding of the exact position of each grapheme, a feature required for fine-grained orthographic representations (42). Compared to the GRA, the VWFA showed preferential connectivity to an extended network including language regions, consistently with prior structural and functional resting-state studies (39, 67). When greater emphasis was put on the phonological pathway, functional connectivity increased between the two VOT ROIs, and between those ROIs and areas implicated in phonological assembly, including superior temporal cortex, the SMG and the IFG (68–70). The increased functional connectivity between the GRA and the VWFA in conditions of high phonological demands, and the increased similarity of their connectivity pattern, is compatible with the hypothesis that the GRA participates in the phonological reading pathway while the VWFA is more efficienty connected to perisylvian reading regions and probably serves as a relay between the GRA and language regions.
Conclusion. The main finding of the current study is that a region around the posterior mid-fusiform sulcus, tentatively called the grapheme-related area (GRA), lying mesial to the typical VWFA, is involved in reading when task and stimuli emphasize the recognition of graphemes and the mapping of orthography into phonology. We provided converging evidence that the VWFA and GRA exhibit different functional properties, including sensitivity to graphemic congruency, correlations with individual behavioral effects, sensitivity to sublexical and lexical variables (with both univariate and multivariate methods), and functional connectivity. The contribution of the GRA was detected by using a novel manipulation that facilitates or disrupts the perception of multi-letter graphemes. In the future, replication using other methods will be important in order to confirm the proposed role of this region. However, several studies already fit with an involvement of the GRA in orthographic encoding for phonology. For instance, the GRA may be an important region for the integration of phonological and orthographic information, as audio-visual suppression in this region was found to be higher in children with better reading skills during a cross-modal rhyming task, and correlated with children’s decision latencies (71). Furthermore, a study comparing adults with dyslexia to controls found that while both groups showed adaptation to repeated words in lateral VOT, dyslexic readers had reduced suppression in mesial fusiform cortex (72).
Our proposal also leads to predictions relevant to the development of reading. Notably, the contribution of the GRA should be more important in children during the acquisition of reading, when they rely more on phonological reading (73). Indeed, when comparing words to false fonts, Olulade et al. (74) found stronger activations in children than in adults at MNI -32 -64 -16, in the close vicinity of our GRA. The hypothesis also
fits with a recent longitudinal study of reading acquisition, in which left VOT activity was more extended during the early stages of reading, in conjunction with activation of dorsal parietal effortful reading networks, and shrank when reading became automatized (36). In adults, less fluent readers also tend to recruit fusiform regions mesial to the typical VWFA, while the latter is recruited in all readers regardless of their skills (62). Similarly, ex-illiterate individuals who learned to read as adults and remain slow readers show a sensitivity to print that extends mesially, with a peak coinciding with the GRA (75). Another prediction is that this region should be related to reading performance mostly for scripts susceptible to phonological reading. In Chinese children learning English, Li et al. (76) showed that grey matter volumes were negatively correlated with reading performance in the lateral fusiform cortex for Chinese reading, and in the mesial fusiform cortex for English reading, two regions nicely matching the GRA and VWFA studied here (see their Fig. 3B). The present proposal remains speculative, however, and emphasizes how little we currently know about the neural codes used by the VWFA and the GRA to represent written stimuli. In the future, a more direct picture of those codes could be obtained either using high-resolution fMRI decoding or representational similarity analysis, or using high-density intracranial recordings.
M
ATERIALS AND
M
ETHODS
Participants. Twenty-five right-handed native French speakers (10 women, 25.4±3.4 years old, 5.2±1.8 years of higher education) participated in the study and provided written informed consent. The experiments were approved by the institutional review board of the INSERM (protocol C13-41). Participants had no history of dyslexia or color blindness. They all had normal or corrected to normal vision. Five subjects were excluded from the analysis: 2 due to abnormal anatomical findings; 1 due to very high error rates (67%, vs. 8.9% on average in other subjects); 1 due to extremely slow RTs; and 1 because of the strong atypical rightward lateralization of his VWFA (based on words > checkerboards in the localizer experiment).
Stimuli.
Main experiment. Words consisted of 360 French nouns and adjectives containing a high proportion of multi-letter graphemes (e.g. champignon; see SI Appendix, Appendix A). Their length ranged from 1 to 4 syllables, and from 4 to 10 letters. Words were chunked either in graphemes (congruent chunking; e.g.
ch/am/p/i/gn/on) or in subunits breaking all multi-letter graphemes (e.g. c/ha/mp/ig/no/n; Fig. 1A). 360
pseudowords were obtained by shuffling the graphemes in the word list. This ensured that words and pseudowords were matched in initial phoneme, length, and consonant/vowel structure. Bigram frequencies did not differ significantly between words and pseudowords (see SI Appendix). Words and pseudowords were presented on a dark grey background, in alternating green and red subunits, separated by a space of about 70% of size of the regular one, a spacing too small to disrupt normal reading (77). The displayed multi-letter subunits consisted either in graphemes (congruent condition) or in an equal or next to equal number of letter groups of the same average size, but straddling two graphemes (incongruent condition; Fig. 1A). Localizer experiment. The material consisted in 96 regular and 96 irregular words (SI Appendix, Appendix B). Irregular words, by definition, contained at least one grapheme pronounced in a way that did not conform to its most frequent grapheme-phoneme correspondence. In each category, half of the words were classified as high frequency and the other half as low frequency (cut-off of 5.39 per million occurrences). Regular and irregular words did not differ in frequency, imageability, length, and bigram, trigram and quadrigram frequencies (SI Appendix, Table S1).
Experimental design. In the main experiment, participants performed lexical decision and reading aloud in separate blocks, using a fast event-related design for the lexicality and congruency factors. The experiment
was divided into 3 runs of about 13 minutes, each with one block of lexical decision and one block of reading aloud. Instructions were reminded visually to the participants at the beginning of each block. Task order was counterbalanced across participants (11/20 final participants started with reading aloud). Each block contained 120 trials: 30 stimuli of each congruency x lexicality condition, in pseudo-random order, randomly mixed with 24 fixation trials. A trial consisted in a pre-fixation cross for 100ms, the stimulus presented for 200ms and a post-fixation cross for 2s, corresponding to the response period. 300ms of jitter were added pseudo-randomly at the end of one third of trials. In each subject, each letter string appeared only once, and in only one congruency condition. A word and its matched pseudoword were presented in the same congruency condition and task for each subject, but not necessarily in the same block. Whether each stimulus’ first subunit appeared in red or green was randomly picked at each trial. In lexical decision blocks, participants were instructed to indicate by a button press whether the string was a pseudoword or a real word. In naming blocks, they were asked to read the string aloud while urged to reduce head movements. In the localizer experiment, participants were asked to read aloud stimuli, with exactly the same experimental settings as in the main experiment. There was a total of 184 word trials, 48 fixation trials, and 48 checkerboard trials. Words were printed in white, on a dark grey background. The checkerboard was black and white, 3 lines by 15 columns, scaled so as to cover the maximum height and width covered by words. Behavioral analyses.
Processing of vocal responses. Recordings of participants’ utterances when reading aloud were analyzed to
identify incorrect trials and word onset (defined as the response time - RT). A response was considered incorrect when differing by at least one phoneme from the expected utterance, or when participants stumbled. Voice onset was detected automatically using in-house scripts, checked, and manually corrected when necessary by an experimenter blind to whether stimuli were congruent or incongruent.
Statistical analyses. Behavioral data were analyzed at the individual level, by including all trials in order to
estimate the effect of congruency while taking into account additional stimulus-dependent variables such as string length. Standard coefficients (betas) for the effect of congruency were extracted at the single-subject level for each task x lexicality level. This was performed using the lme4 package in R software, using logistic regression for the analysis of errors and generalized linear models for the analysis of RTs in correct trials. An inverse Gaussian link function was used for generalized linear models on RTs because of their non-normal distribution (78).
Specifically, for each task x lexicality (word / pseudoword) level, a first regression was performed separately on both errors and correct RTs to regress out the effects of stimulus length (number of letters), multi-letter grapheme ratio (number of phonemes/number of letters, see 4, 5 for why this variable may matter), and – only for words – lexical frequency. The residuals of this first regression were then carried into a linear model to extract an estimate of the effect of congruency, independently from the previously regressed variable. One standard beta coefficient was thus obtained per subject for each of the four task x lexicality levels, for both errors and RTs. These standard coefficients of congruency were then carried into a second-level analysis, to test whether significant effects of congruency could be observed over all participants, and whether they differed between conditions. Repeated measures ANOVAs were performed using the ezANOVA package, and differences to zero and between conditions were tested with one-sample and paired two-sample t-tests respectively.
fMRI acquisition and analysis.
Acquisition: Participants were scanned using a 3T MRI scanner (Siemens, PRISMA) with a 64-channel head coil.
TE2=33.46ms, in plane-resolution = 2 x 2mm, matrix =102 x 92, phase encoding: posterior to anterior). The dual
echo sequence was chosen in order to decrease signal drop-out, especially in ventral regions located above the ear canals hence sensitive to susceptibility artifacts, and to increase signal-to-noise ratio (79). For each run, ten additional BOLD volumes with reverse phase encoding direction were also acquired. T1-weighted images were acquired for anatomical localization (156 axial slices, 2mm thickness, TR=2400ms, angle=8°, TE=2.07ms, in plane-resolution=2 x 2mm, matrix= 157 x 189).
Pre-processing: Analyses were performed using the SPM12 toolbox for Matlab. The first pre-processing steps
were applied separately to the images of both echo times. Functional images (including additional images with reverse phase encoding) were corrected for movement by realigning to their first volume and reslicing. FSL “topup” was then used to correct distortions due to B0 field inhomogeneity using the volumes with reverse
encoding. TE1 and TE2 corrected and realigned images were then linearly combined at each TR based on each
voxel’s contrast to noise ratio at each echo time (CNR, 79). Specifically, CNR volumes were obtained for each echo time by multiplying the temporal signal-to-noise ratio (tSNR) map by its respective echo time. These CNR maps were used as weights to average TE1 and TE2 images. Combined images were then registered to
anatomy. To do so, T1-weighted images were first corrected for inhomogeneities, segmented and normalized to the MNI template using SPM DARTEL tool. Combined functional images were then coregistered on the participant’s anatomy, normalized and smoothed using a Gaussian kernel of 4mm full width at half maximum (FWHM).
First-level GLM and second-level analyses. In the main experiment, each participant’s functional data were
separated into six blocks, high-pass filtered, and combined into one single GLM model. For each block, regressors consisted in four experimental conditions (lexicality x congruency), plus the instructions, convolved with the canonical SPM hemodynamic response function and its first temporal derivative, in addition to six motion parameters. In order to investigate the effect of string length, a second GLM was run for each participant, adding a parametric modulator to each of the regressors described above, that consisted in the number of letters in each string. The results of the length analysis are reported in SI Appendix Fig. S3. The same method was applied for the localizer experiment. The first-level GLM included four regressors for each regularity x frequency level, each of them with a parametric modulator corresponding to the number of letters of each stimulus, as well as a regressor for checkerboards, one for the initial instructions, and six movement regressors. Second-level group analyses were conducted by comparing each contrast of interest across subjects to zero using a one-sample t-test. Unless otherwise mentioned, all results reported were obtained using a voxelwise statistical threshold of p< 0.005, and cluster correction with a False Discovery Rate (FDR) q < 0.05 at the whole-brain level.
VOT mask. As the current study was specifically designed to assess graphemic coding in the left VOT, all
analyses which focused on left VOT used small volume correction within a ROI defined anatomically based on the AAL atlas (80). This ROI included the left inferior occipital, inferior temporal, fusiform, lingual and parahippocampal gyri, between y=-70 and y=-30.
Ventral regions of interest. Our first results allowed us to identify two peaks of interest, one at MNI -32 -58 -14,
for the graphemic congruency effect in the main experiment, and one at MNI -50 -52 -22, using the typical VWFA-localizing contrast of words minus checkerboards in the localizer experiment. The properties of these two regions were investigated by comparing their sensitivity to different variables, at the univariate and multivariate levels, and their differences in functional connectivity with other brain areas.
It has been previously shown that the properties of the VWFA are best captured using regions of interest defined at the individual level (34). Hence, we also identified individual VWFAs based on the contrast of words minus checkerboards in the localizer experiment (hence independently from the main experiment). For each subject, the statistical map of {words > checkerboards} were first thresholded at a level of p < 0.001 voxelwise and masked by the left VOT ROI described above. Each subject’s VWFA was then defined as the largest cluster
within this mask. Because of large variations in activation levels, this process yielded individual VWFA regions that extensively varied in size (from 8 voxels to 711). The initial p<0.001 threshold level was hence modified to adapt it to outlier participants (p<0.005 in four individuals, p < 5.10-4 in one individual, and p < 10-4 in three
participants). The final volumes of individual VWFA clusters ranged from 42 to 422 voxels in MNI space (median: 191.5). The main text reports the comparison between those individual VWFA regions and the more medial peak defined by its sensitivity to graphemes. Because the asymmetry in methods can still bias the obtained results, comparisons of the two peaks of interest at the group level are also reported in SI Appendix Fig. S6&7, with similar results. Multivariate pattern analyses (MVPA) and functional connectivity. Single-trial beta estimates: In order to conduct MVPA and functional correlation analyses, a beta estimate was extracted for each single trial of the experiment. To do so, a general linear model (GLM) was evaluated for each trial, consisting in two regressors of interest: one regressor for the given trial, and another regressor for all other trials (in addition to six movement regressors; 81). This was performed in each subject’s native space on realigned but unsmoothed data in order to maintain the most precise definition of activation patterns. MVPA: MVPA analyses were conducted using the Decoding Toolbox (82). A searchlight analysis was conducted within the ventral mask described above, denormalized into native space and restricted to the cortical grey matter of each participant. Stimuli were classified as words or pseudowords using a support vector machine classifier, after scaling each activation pattern so that univariate differences would not bias classification. A 15-fold cross-validation design was used within a spherical searchlight of 4mm radius, separately in each task and congruency level. Individual maps of accuracy were normalized into MNI space, and entered in second-level permutation tests to compare the mean accuracy across individuals to chance level (50%). Permutation tests were conducted using the randomise function in FSL, and applying threshold-free cluster enhancement. Effects of string length: Single-trial beta maps were also used to assess effects of string length on activation levels within the two ventral ROIs. For each subject and trial, a mean activation value was extracted the within GRA and VWFA ROIs. Then, for each subject and ROI, the effect of number of letters on the levels of activations was assessed, for each level of task x lexicality, in a linear model (after removing incorrect or outlier trials and regressing out the effect of congruency), and summarized as a standard coefficient of length. Those standard coefficients were then carried into a second-level repeated measure ANOVA.
Functional connectivity: Differences in connectivity between conditions and between seeds were investigated by computing correlations in single-trial beta series (40). Specifically, the beta maps for all trials of a given condition were concatenated in time to form a beta series. For each seed, a mean beta series was obtained by averaging all voxels in the seed. In each other voxel of the brain, the time course of the beta series corresponding to this condition was correlated to the mean seed series to obtain a Pearson’s r value, and a Fisher-transformed z value. Individual connectivity (z) maps were then normalized into MNI space, and carried into a second-level analyses in SPM to investigate differences in connectivity between conditions. Due to technical problems, some runs did not include enough rest at the end of the sequence, resulting in poor estimation of the beta map for the last trial (exceedingly large values). For that reason, an outlier detection step was added, such that trials with values in the seed that differed from the mean of the series by more than three times its standard deviation were excluded.
Meta-analytic maps of co-activations: In order to further compare the role of the two selected seeds across
the literature, meta-analytic maps of coactivations were downloaded from the neurosynth website (http://www.neurosynth.org, 41) for the two group-level coordinates of interest. The maps of coactivation (z-scores) for the GRA and VWFA were then overlayed, and compared. Because these maps are thresholded (p<0.01 FDR), their direct comparison only indicates trends of preferential coactivations, with no associated statistical test. In Fig. 7E, the threshold for the difference in z maps was arbitrarily set at Z = 3.