Publisher’s version / Version de l'éditeur:
Journal of the International Institute for Conservation - Canadian Group, 4, 2, pp.
3-14, 1979
READ THESE TERMS AND CONDITIONS CAREFULLY BEFORE USING THIS WEBSITE. https://nrc-publications.canada.ca/eng/copyright
Vous avez des questions? Nous pouvons vous aider. Pour communiquer directement avec un auteur, consultez la première page de la revue dans laquelle son article a été publié afin de trouver ses coordonnées. Si vous n’arrivez pas à les repérer, communiquez avec nous à PublicationsArchive-ArchivesPublications@nrc-cnrc.gc.ca.
Questions? Contact the NRC Publications Archive team at
PublicationsArchive-ArchivesPublications@nrc-cnrc.gc.ca. If you wish to email the authors directly, please see the first page of the publication for their contact information.
NRC Publications Archive
Archives des publications du CNRC
This publication could be one of several versions: author’s original, accepted manuscript or the publisher’s version. / La version de cette publication peut être l’une des suivantes : la version prépublication de l’auteur, la version acceptée du manuscrit ou la version de l’éditeur.
Access and use of this website and the material on it are subject to the Terms and Conditions set forth at
Applications of infrared thermography in locating and identifying
building faults
Burn, K. N.; Schuyler, G. D.
https://publications-cnrc.canada.ca/fra/droits
L’accès à ce site Web et l’utilisation de son contenu sont assujettis aux conditions présentées dans le site LISEZ CES CONDITIONS ATTENTIVEMENT AVANT D’UTILISER CE SITE WEB.
NRC Publications Record / Notice d'Archives des publications de CNRC:
https://nrc-publications.canada.ca/eng/view/object/?id=9179f56a-3593-484e-8150-38446d3f8ffd https://publications-cnrc.canada.ca/fra/voir/objet/?id=9179f56a-3593-484e-8150-38446d3f8ffdSer
TH1
N21d
National Research Council of Canada
0 .
964
Conseil national de recherches du Canada
cop. 2$&,=av
APPLICATIONS OF INFRARED THERMOGRAPHY
IN LOCATING AND IDENTIFYING BUILDING FAULTS
by Kenneth N. Burn and G.D. Schuyler
AP-j ALYZED
Reprinted from
Journal of the International Institute for
Conservation
-
Canadian Group
Vol. 4, No. 2, Spring 1979
p. 3
-
14
DBR Paper No. 964
Division of Building Research
This publication is being distributed by the Division of Building Research of the
National Research Council of Canada. It should not be reproduced in whole or in
part without permission of the original publisher. The Division would be glad to
be of assistance in obtaining such permission.
Publications of the Division may be obtained by mailing the appropriate
remittance (a Bank, Express, or Post Office Money Order, or a cheque, made
payable to the Receiver General of Canada, credit NRC) to the National Research
Council of Canada, Ottawa. KIA 0R6. Stamps are not acceptable.
A list of all publications of the Division is available and may be obtained from the
Publications Section, ~ i v i s i o n
of Building Research, National Research Council
of Canada, Ottawa. KIA 0R6.
Applications of Infrared Thermography in Locating and Identifying
Building Faults*
Kenneth N. Burn and G. D. Schuyler
Division of Building Research, National Research Council of Canada, Ottawa, Ontario, K I A OR6, Canada
*This paper was originally presented at a meeting of the Association for Preservation Technology, September, 1978. Manuscript received January 2, 1980
Revision received October 6, 1980
Infrared thermography is a technique that measures the thermal rudiation given off by a surface. An important application of this technique is the examination of buildings in order to detect building fault;\. An outline of the theory of infrared temperature measurement is presented and discussed with reference to the AGA 680 Thermovision System. The environmental conditions that affect a therrnographic survey are also outlined. Several common types of building fault which can be detected using thermography are discussed and illustrated. Three case histories of its use in detecting building faults are also given: a problem with a cavity wall, a problem with a highrise building that was being used as an art gallery, and another examining heat loss from a heritage building. La thermographie u l'infra-rouge est une technique qui permet d'evaluer la radiation thermique emise par une surface. Cette
technique est utilisbe surtout pour l'etude de bitiments ajin de repe'rer les vices de construction. On presente et on analyse les grandes lignes de la thPorie d'e'valuution par la temperature u I'infra-rouge au moyen de l'appareil de thermovision AGA 680. On
trouve e'galement des e.xplications au sujet des conditions de l'environnement qui affectent le resultat des sondages thermogra- phiques. Plusieurs types communs de vices de construction pouvant Ptre dktecte's grice a la thermographie sont e'tudies et illustre's au moyen d'exemples. Trois cas prPcis de l'utilisation de cette technique sont presentes: l'un traite d'un probltme relie' au mur creux, un second truite d u n Pdifice a plusieurs etages utilise' comrne galerie &art et le dernier a truit u un bitiment historique.
INTRODUCTION
Infrared thermography is a comparatively new technique that has been adapted to the inspection of building envelopes for determining the location of thermal anomalies caused by faults, either in design or in workmanship. The equipment detects infrared radiation emitted from a surface by scanning and displaying the resulting pattern on a cathode ray display screen (CRT). This may be photographed for permanent record.
The intensity of infrared radiation emanating from a body is related to its surface temperature. The equipment senses differences in thermal radiation from which certain tempera- ture information may be derived. Correct interpretation of the thermal images requires an understanding of radiation exchange and a knowledge of construction practices, thermal properties of building materials, and the physics of heat and moisture flow as well as camera operation. An AGA 680 infrared camera has been used by the staff of the Division of Building Research, National Research Council of Canada, for about ten years, and in the course of conducting various studies some interesting applications have been possible.
Following an explanation of the phenomenon of thermal radiation and a discussion of the types of building faults that produce temperature anomalies in a thermograph, examples are given together with interpretations of building faults. Although the emphasis is on modern building technology, this new tool may have some direct application to the assessment of the condition of the exterior envelopes of heritage buildings.
INFRARED TEMPERATURE MEASUREMENT Thermal Radiation
All objects, by virtue of their temperature, emit elec- tromagnetic radiation in the wavelength range of 0.1 p m to 100 p m . This is known as thermal radiation. A black body is a theoretical body that acts as a perfect absorber and perfect emitter of thermal radiation. The emissive power of a black body can be expressed by the Stefan-Boltzmann Law as follows:
Eb = u T 4 (1) where
Eb = black body emissive power [W/m2] T = absolute temperature [ O K ]
u = Stefan-Boltzmann constant = 5.6696 x l o p s [W/m2K4]
All real objects radiate less energy than the theoretical black body. The emissive power of real objects is expressed by:
E = euT4 (2)
where E is the emittance of the object and is the ratio of the
emissive power of the object to that of a black body at the same temperature. As a black body is a perfect radiator, E varies between 0 and I .
Absorptance, Reflectance and Transmittance
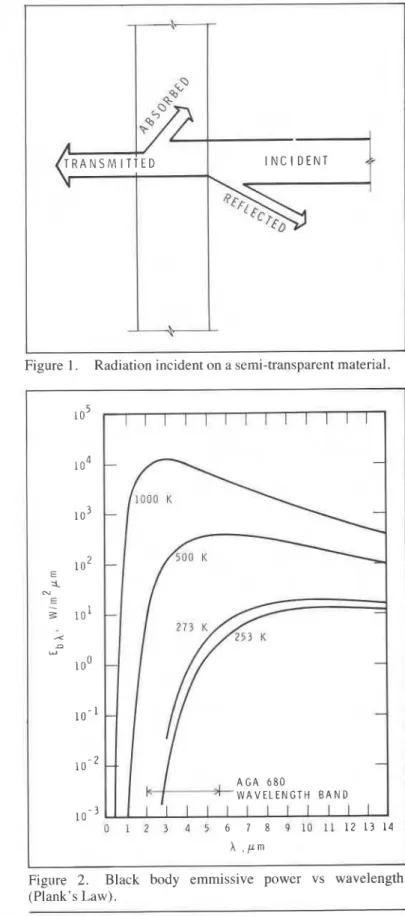
As illustrated by Figure 1, radiation incident on an object can be absorbed, transmitted and reflected. It may be seen that
I = a1
+
pI+
TI where I = incident radiationa = absorptance = absorbed enerpy
incident energy p = reflectance = reflected energy
incident energy transmitted energy
T = transmittance =
incident energy
Note that the transmittance of a sample of material may change with thickness, but that transmissivity remains constant. The suffix "ance" refers to properties of an object as a whole, taking into account the effects of shape, orientation, thickness, etc. The suffix "ivity" refers to intrinsic properties of the material or surface alone.
From equation (3)
If a material is opaque to thermal radiation, then T = 0 and
It can be shown, through Kirchoff's Law, that the emittance of Figure 1 . Radiation incident on a semi-transparent material.
an object in thermal equilibrium equals its absorptance. Thus for an opaque object in thermal equilibrium,
Relative Properties and Wavelength
To this point, the wavelength dependence of radiative properties has not been mentioned. A monochromatic property can be defined as one that is constant over a very small interval of wavelength. It is possible, therefore, to investigate the variation of the monochromatic emissive power EA, emissivity EA, transmissivity TA, etc. , with wavelength.
The black body distribution of monochromatic emissive
power E ~ A versus wavelength A is given by Planck's Law
where E b ~ = monochromatic emissive power at wavelength
A, [W/m2 p m l
e = base of natural logs = 2.7 18
A = wavelength [pm]
T = temperature [OK]
bCl = 3.741 3 x I O8 [ W ( ~ m ) ~ / m ~ ]
C2 = 1.4388
x
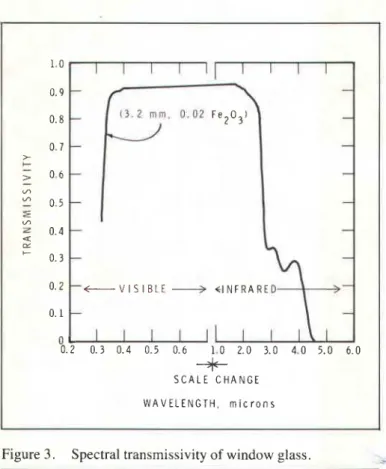
104[pm0K]An example of this distribution for a range of object
temperatures is given in Figure 2, from which it may be seen
that the wavelength at which E b ~ is at its peak increases as temperature decreases. In fact, the wavelength of the peak is inversely proportional to the temperature. This is expressed in
Wien's displacement law A,,,T = 2.90 x lo3.
From the definition of a black body, its emittance and absorptance are unity for all wavelengths. Real objects, on the other hand, have a , p , T and E that vary with wavelength.
Thus, there must be differentiation between a monochromatic value (e.g.: EA) and the integrated over-all value. An example of the variation in the transmissivity of glass TI is shown in Figure 3. This example shows the transition from a high
Figure 2. Black body emmissive power vs wavelength
(Plank's Law).
transmittance material in the visible and near infrared wavelengths (A between 0.4 and 3 p m ) to a very low transmittance in the longer infrared wavelengths. This varia- tion is the source of the well known "greenhouse effect", which allows radiant energy in the visible wavelengths to pass
into a glass enclosure but stops radiant energy from escaping at the longer wavelengths characteristic of objects at tempera- tures closer to the temperature of the earth's surface.
Temperature Measurement Using Infrared Techniques
As the emissive power of an object is a function of temperature, a measurement of the radiation intensity emitted from it can be used to determine its temperature. As stated earlier, in addition to emitting radiation due to temperature, a real object also reflects incident radiation. The apparent temperature will be dependent, therefore, on the temperature and emittance of the body as well as on the temperature of the surroundings and the reflectance of the body. Because at thermal equilibrium, for material that is opaque to thermal radiation,
objects with low emittance will reflect a large portion of the radiation incident on them from their surroundings. In this case the temperature of the object being measured should be well above the temperature of the surroundings in order to reduce error in temperature estimation due to reflection.
-
-
-
--
-
I I I I I I II
il
0.2 0.3 0.4 0.5 0.6 1 . 0 2.0 3.0 4 . 0 5.0 6.0+
S C A L E C H A N G E W A V E L E N G T H , m i c r o n sFigure 3. Spectral transmissivity of window glass.
The high degree of sensitivity needed in measuring the low radiation levels of objects around 273°K (0°C) makes it difficult to provide a sensor with a high degree of long-term stability. For this reason differential measurements are usually made between a stable reference source and the object to be measured. This technique requires a reference of known emissivity. The resulting measurement gives the equivalent black body temperature of the object. It would be the actual temperature of the object if its emissivity were unity, E = 1 .
In some cases it is possible to measure the temperature of a representative portion of a surface with a thermocouple or other surface thermometer and use this as the reference. As long as like surfaces are compared (equal emissivity), then the actual temperature of the other surface can be estimated. This method has the effect of calibrating out the emissivity effect on the surface.
Measurement of Building Surface Temperatures with the AGA 680 Thermovision System
The AGA thermovision camera consists of a rotating prism scanning system that directs sequential points of the field of view onto a photovoltaic sensor. The output from the sensor is conditioned and fed to a cathode ray display screen (CRT), giving an image similar to a television picture. The display frequency is 16 frames per second with two 105-line frames interlaced on the display.
The image on the CRT display screen shows two scales: a vertical one running on the left from 1 to 20 and on the right from 50 to 1000, indicating by a gap in the white border line the approximate range of temperature (in degrees Celsius) to which the instrument is set; and a horizontal scale in ten parts across the bottom, running from 0 to 1, giving a division of the total temperature range in tonal intensities between black and white and making it possible to see what is coldest on the image (black) and warmest (white) and to estimate some of the values in between.
This system includes a 35 mm camera mount over the CRT display screen for recording the images. Black and white thermograms provide sufficient information for most qualita- tive analyses, but where it is necessary to be precise about temperature or for difficult cases where increased detail is needed in the picture, colour thermograms can be obtained by an electronic subdivision of the temperature range into 10 parts, 8 of which are tagged with a colour.
One very important specification of an infrared system is the wavelength band in which the sensor operates. The AGA 680 is sensitive to radiation in the range 2 to 5.6 p m . The camera therefore integrates the energy received over that wavelength band. Any estimate of radiative properties made with the camera is thus an average over this bandwidth. The use of published emissivity data in estimating actual temperatures by means of a reference device is only approximate, for published data are usually derived with equipment sensitive to different
wavelength bands.
..
As mentioned earlier, a more accurate method of dGermin- ing surface temperatures is that of measuring the temperature of a representative spot on the surface in question. This cancels out any emissivity effects of the surface as well as transmit- tance effects of the atmosphere. One must make sure, how- ever, that the surface is uniform. The emissivity of a wet spot or a patch of ice will be different from that of a dry bare spot. Similarly, comparison cannot be made between two different materials unless thermocouples are placed on representative points of each.
Reflections can play an important role in the apparent temperature of a surface, as noted earlier. Most exterior wall surveys in this country are made in the winter. The lower background temperature linked with the relatively low reflec-
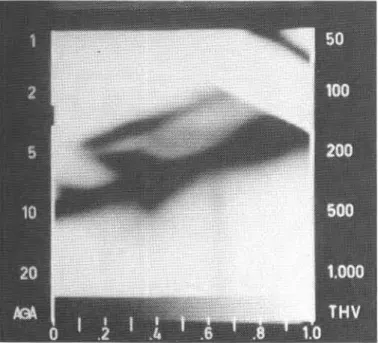
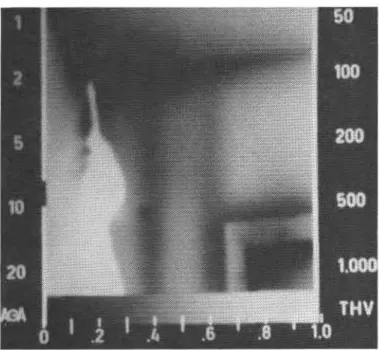
Plate 1: Thermogram of upper part of highrise building.
m
Plate 2 : Thermogram of lower part of highrise building. This was taken at the same time as Plate 1 ; the change in colour arose from changing the setting of the sensitivity scale from 2 to 1 (shown to the left of the thermograms).
tivity of many building materials makes reflection problems small. If, however, one surveys an aluminum surface and other buildings, street lights, people or automobiles are nearby, then reflections can become a problem. Direct solar reflection can be filtered out, but its heating effect on a building surface cannot be ignored.
Some surfaces, though their emissivity may be close to 1 , will reflect specularly when polished (angle of incidence equals angle of reflection). This type of reflection must be taken into consideration when surveying polished surfaces such as glass or marble.
Inside surveys are also affected by reflections. Here background temperatures are generally higher than that of the object, and this could aggravate the reflection problem. Many building materials, however, have a low reflectivity (approxi- mately 0.1) so that these problems can be ignored in many cases. Here too one must use caution, especially in dealing with metal surfaces.
Figure 4. Therogram of ceiling showing batt of insulation out of place.
INVESTIGATION CONDITIONS
It is clear that the proper conditions are important for a successful thermographic survey and that the factors influenc- ing the usefulness of this technique must be taken into consideration when conducting a survey and assessing the results. It is possible that some extreme conditions might completely mask the information sought and should therefore be avoided.
Temperature
Temperature difference across the building envelope is the motive force that produces heat flow, and it is the variation in resistance to heat flow that affects the variation of surface
I temperatures. For this reason the temperature difference
between inside and outside should be as large as possible.
Air Pressure
Where air leakage is suspected or evident, the magnitude and direction of pressure differences across the building envelope are important. For example, exfiltration surveyed from indoors and infiltration surveyed from outdoors would not cause temperature anomalies in the thermogram and would go undetected. It should be noted that internal pressurization or exhaust can sometimes be used to override natural pressures and control the direction of air leakage for analysis. High winds produce both increases and decreases in air pressure, depending upon the orientation and shape of the structure in relation to the direction of the wind. Under certain conditions an adequately constructed wall may appear to have serious air leakage faults. For these reasons a survey should not be conducted during periods of high winds.
Local Convection Effects
Besides causing abnormal pressure differences across building envelopes, winds are a source of forced convection over the outside surface of a building. Such convection affects the heat transfer from the surface and will result in variations in thermal patterns. The resultant thermograms may be difficult to interpret.
Local convection effects may also be critical inside where, for example, cold air moving downward from a window can produce a cold pattern on the surface of the wall below that completely masks any thermal pattern due to conduction through the wall or to air leakage. Fans and heaters also cause local convection currents within a building and should be shut off before surveying.
Heat Sources
Convectors, heating ducts, light bulbs and sunlight all m y cause localized heating by radiation, which must be taken into consideration and avoided if possible. As many building materials have high heat capacities, a sufficient length of time must be allowed after these sources have been active for stored heat to dissipate. This may take as long as 12 hours. In dealing with the effects of sunlight the best time to survey, except for incipient spalling, is in the early morning when the sun has been absent from the surface for at least 10 hours.
BUILDINGS AND BUILDING FAULTS
Because of the high cost of energy, efforts are being made to design and construct building envelopes that will give the best thermal performance at minimum life-cycle cost. Building codes and supplementary documents are in preparation for the enforcing of standards to govern the use of energy for heating and cooling buildings. Measures to improve thermal perfor- mance have been known for some time, but while the cost of energy was low there was little incentive to apply them. They are now being considered more carefully in the detailing of building envelopes, but where they are not adequately under- stood or where on-site construction fails to incorporate their intended purpose, energy is still wasted and building faults occur. Coincidentally, such faults do contribute to conditions potentially damaging to building materials. There are, of course, many other types of building fault not detectable by
this technique, but some of the most costly involve energy losses.
Infrared thermography, which presents images of tempera- ture variation, is useful only in identifying those building faults where temperature anomalies are the key to detecting unsatis- factory conditions. Although infrared thermal images bear some resemblance to X-ray radiographs, it must be remem- bered that the thermogram gives a pattern of temperature variation only on the surface being viewed. Any indication of what is happening behind the surface must be deduced from those surface conditions, a knowledge of the wall or roof construction supporting the surface, and an understanding of the thermal properties of materials and of heat flow.
Thermal Insulation
Resistance to heat flow through the building envelope may be increased by installing suitable thicknesses of thermal insulation in the walls and roof. If the construction allows, this may be in the form of batts or boards fitted into place between structural members. If, during installation, some areas of the envelope are missed, the effects of heat escaping to the outer surface will be detectable by this new technique. Areas where heat losses are highest are often found to be in the shape of the
batts that are missing. Figure 4 is a thermogram of the ceiling
in a single-storey bungalow. The rectangular patch with well defined outlines is a poorly installed glassfibre batt. In this case the distinct thermal pattern can be easily recognized.
If the construction does not allow the installation of boards or batts, loose insulation or expanding foams are frequently blown into cavities between the inner and outer wythes of
masonry walls, or into the space between the studs of a wood
frame building. In such cases there are often obstructions in the walls and unless care is taken with both the location of access holes and the technique of filling the spaces there may still be parts of the wall not properly insulated. The infrared thermo- graphic technique will permit the detection of such faults.
Thermal resistance of insulating material is largely attribut- able to the small dead air spaces held within it. Should some of these spaces become filled with water, a more thermally conductive medium than air, the insulation will lose much of its resistance to heat flow. Water most frequently 'soaks' insulation installed in roofs where the roof membrane has failed, but this fault also occurs in walls with certain types of insulation. This too is detectable using the thermographic technique.
Thermal Bridging
Thermal bridging is a lack of resistance to heat flow and is frequently observed in building envelopes. As the term indi- cates, thermal bridges allow relatively easy flow of heat from the inside to the outside of walls and roofs. Thermal bridges occur, for example, at wall-floor junctions in buildings where concrete floor slabs protrude to the exterior face of the building, at junctions of partitions and exterior walls and where metal fastenings for exterior cladding are in contact with the warm side of the building at one end and the cold exterior at the other. Wood and steel studs in wall constructions filled with insulation are thermal bridges in that they act as preferen- tial paths for the flow of heat through the wall because their
Figure 5. Thermogram of corner of room at ceiling.
thermal conductivities are higher than that of the insulation. The location of these studs is easily discernible from the temperature patterns that emerge in the thermograms. In heritage buildings it might be possible to identify the location of bond stones between two wythes of masonry in cavity walls because they too act as thermal bridges.
One of the most important points to consider in all ther- mographic survey work is just how an acceptable wall should appear in a thermogram. Careful examination of the building structure, recording of all pertinent atmospheric and physical conditions at the time of the survey, and a good deal of prior
experience are needed to make an accurate assessment. Figure
5 could illustrate either a normal corner where several structur-
al members converge to form a thermal bridge or one with an air leakage pattern superimposed. Only recording of the appropriate conditions can make it possible to differentiate between the two.
Air Leakage
Another major factor that must be considered when dealing with energy losses from buildings is air leakage. The propor- tion of energy lost through air leakage to total energy use in buildings is frequently in the 20 to 30 per cent range and has been measured as high as 50 per cent. If the building envelope is not tightly constructed, then heated inside air escapes through holes between the building elements and through materials or assemblies that are relatively permeable to it.
To worsen this particular building fault, escaping warm air, frequently at moisture contents far above saturation at outside temperatures, produces condensation in the colder parts of the building envelope that can sometimes lead to deterioration of materials either by corrosion or by frost action. Infrared thermography is useful in identifying such air leakage paths. It can be used inside the building to detect infiltration paths of cold air and outside to detect exfiltration of warm air.
Figure 6. Vermiculite insulation at base of window in school building.
Incipient Spalling
The technique has also been useful in detecting incipient spalling in structural concrete1 and terra cotta2. Solar energy absorbed on a surface is transmitted to the mass behind it by conduction under a temperature gradient. When the sun is no longer incident on that surface, a temperature inversion develops and heat begins to flow outward from the mass to the surface, where it is lost to the atmosphere by convection and radiation. For a given material, the larger the mass behind the surface the more slowly the temperature will change because of its higher heat capacity. Pieces about to fall are separated from the larger mass by the width of cracks, which resist the flow of heat. As a result, they are heated and cooled faster than the mass from which they have spalled. The heating and cooling cycles are in phase with those of the larger mass, but the temperature peaks and troughs are greater, producing detectable temperature anomalies. There are, of course, two periods each day when the temperatures in the mass and the fragment are the same, and thermographic observations made at such times would not detect any spalling. To select the best time of day for such observations the orientation of the surface to be studied should be considered. The method also has potential in assessing the soundness of masonry walls in heritage buildings.
EXAMPLES
noticed that large quantities of vermiculite accumulated on the floor in areas that were not swept regularly (Figure 6). For some years, no connection was made between the vermiculite on the floor and the insulation of the walls. Eventually, however, it was realized that the two were related and that the thermal resistance of the building envelope was diminishing.
In some instances, it was possible to find openings between metal window frames and brick through which the vermiculite could escape. No one knew, however, where all the holes were. Vermiculite appeared in small quantities in unexpected places and it was highly probable that some was being lost to the outside. It was assumed that it was flowing under its own weight, like wheat in a storage bin, and emptying through a hole at the bottom. A thermographic survey was therefore conducted.
The photograph shown in Figure 7 is of part of the east wall of the main wing, behind which there is a stairwell. At ground floor level a hot water convector is recessed into the inner wythe of the brick. The thermogram of the upper section of this wall (Figure 8) shows a number of sloping boundaries between the warm upper part of the wall and the lower cold section. The low points on this boundary line are directly above both ends of the convector, where the pipe connections pass through the frame into which the convector is recessed. At this close range it is possible to discern lighter zones running downward from the low points, indicating lower thermal resistance caused by the lower density of vermiculite in the flow paths.
Other areas were also located, showing the drainage of vermiculite through holes in the wall. In some places the insulation had settled leaving top portions of the wall uninsu- lated.
Air Leakage from Highrise Buildings
The second example is a seven-storey building surmounted by a three-storey penthouse. Designed as an office building, it was pressed into service to house an art gallery and was therefore maintained at a constant relative humidity of 50 per cent at 20°C.
These requirements imposed conditions upon the building envelope that, because of lack of air tightness, led to serious deterioration of the building materials in the walls. After 17 years it was considered essential for public safety to remove the original masonry cladding and replace it with an envelope of much tighter construction3.
The structural frame of the building is of steel and the original cladding was of gray limestone and brown granite. These finish materials were replaced by precast concrete and porcelain enamel panels simulating the original texture and colour. Construction details of the new envelope vary from place to place throughout, but the general design approach is represented by a sketch of the wall section shown in Figure 9.
Cavity Wall Concrete block was used as the main structural element
The first example is a 15 year old school building where the filling the spaces between the floors. A material fairly porous walls consist of two wythes of brick separated by a space to the movement of air under a pressure difference, the blocks infilled with expanded mica known as vermiculite to provide were coated on the exterior with a suitable thickness of cement I insulation. Almost from the beginning of occupancy it was parging to render the wall relatively impermeable to air. In
addition, foam plastic insulation was adhered to the exterior surface, and was, in turn, protected by a rainscreen of precast concrete panels with an air space between. The precast concrete panels, spanning a distance of 7.5 m between columns and three per floor, are large and heavy and are supported by brackets built of steel wide flange sections welded directly to the structure. These brackets penetrate the block wall supporting the air barrier and the blanket of insulation wrapped round the outside of the building.
S T E E L C O L U M N C O N C R E T E B L O C C E M E N T P A R G l N G ( A I R V A P O U R B A R R l F O A M P L A S T I C I N S U L A T I O N P R E C A S T C O N C R E T E
.,
Figure 9. Typical wall construction used in highrise art
gallery.
building. During the first winter following renovation of the building
envelope some wetting was noted from time to time on the face
of the Drecast concrete. Some large icicles formed, and
-
occasionally fell to the street below. Wisps of vapour could also be seen escaping through joints in the cladding in the upper parts of the walls. In order to determine the cause of these problems, thermograms were taken of the parts of the building envelope where the wetting occurred.
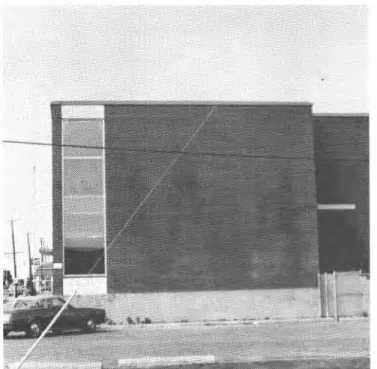
Typical of these conditions was one of the end bays on the front facing east. It was possible to set up the equipment at ground level at a distance of 60 m from the base of the wall and roughly normal to it. From this position the bay could be
covered from top to bottom in three shots (Plates 1 and 2
-
seepage 6). (A composite picture has been made of the two thermograms of the upper part of the wall because they were obtained using the same sensitivity scale and showed consider-
able overlap.) A time was chosen when the temperature was
about -28°C and the air fairly still, although, in the event,
there was a very light breeze blowing from the west.
Plate 3 (page 6) is a photograph taken from the same
vantage point showing the wetting pattern that frequently developed. (The surfaces of the precast concrete panels were dry, or at least showed a uniform colour, at the time the thermograms were taken.)
Figure 8. Thermogram of east wall of main wing of school The over-all temperature patterns that emerged are similar in I I
building. shape to the wetting patterns already observed, in that the I
i
Plate 5: Upper section of wall of high- rise building showing streams of water vapour escaping from the top of the wall.
warmer sections are found at the edges of the bay in line with the columns and extended from the roofline to about the fourth floor level. The bulge on the left side of the bay at the fifth floor appears in both the thermograms and wetting patterns of the face of the concrete. There is no indication of higher temperatures in the vicinity of the columns below this level, nor of any wetting on the panels.
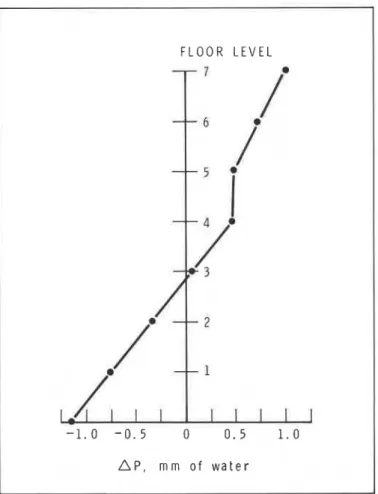
F L O O R L E V E L
I
- 1 . 0 - 0 . 5 0 0 . 5 1 . 0
A?,
rnrn o f w a t e rFigure 10. Air pressure inside building with reference to external pressure.
A better selection of temperature scales could have been made, encompassing the full range of those prevailing at the time. The selection of too narrow a temperature range resulted in a loss of resolution beyond the upper end of the scale. (The large black areas inside the white ones are those where the temperatures were highest.) Actual peaks were lost, but it is clear from the bulbous shapes of these black areas that there were "hot spots": three per floor in the vicinity of the supporting brackets.
The higher temperatures at the ends of the precast concrete panels could have been caused by heat loss from the interior of the building, by means of one or other of the heat transfer mechanisms or a combination of both.
It seemed reasonable to assume that the heavy supporting brackets of steel welded to the steel structure and kept warm inside the insulation blanket were acting as massive thermal bridges, conducting heat directly to the back of the concrete panels. If this had been the case, then the pattern of heating as
expressed by the thermogram should have shown some uniformity, inasmuch as the brackets at each column are all the same size and attached in the same manner. Examination of Plate 2, the lower part of the wall, shows no hot spots at the ends of the panels, permitting the conclusion that heat loss through the brackets by conduction was either too small to be detected or masked by something of greater consequence. In addition, the premise that heat transfer was entirely by con- duction through the thermal bridges could in no way explain the presence of moisture on the face of the panels.
A second possible explanation was that warm air was leaking through the walls, probably around the brackets, and escaping into the air space between the insulation and the back surface of the concrete. Heat escaping to the back of the panels in such a manner would not be expected to result in uniform temperature patterns because the amount of air flowing through the wall at each bracket would depend upon the quality of the work done in closing the wall around steel sections ( i . e . ,
on the size of the holes through which the air was leaking) and it would also depend upon the difference in air pressure across the wall. The pattern that generally develops in buildings under still-air conditions is one of exfiltration of warm air in the upper part of the building and infiltration of cold air at the bottom. Somewhere, usually near mid-height, the interior and exterior pressures are equal and no air flow occurs.
The pressure differences shown in Figure 10 were measured at about the same time as the thermograms were taken. The maximum positive and negative pressures, equivalent to about
1.0 mm of water, had occurred at top and bottom, and the point at which the pressure difference was zero occurred at the third floor level. The fact that the slope of the curve is not constant indicates that there is some variation in air tightness from floor to floor.
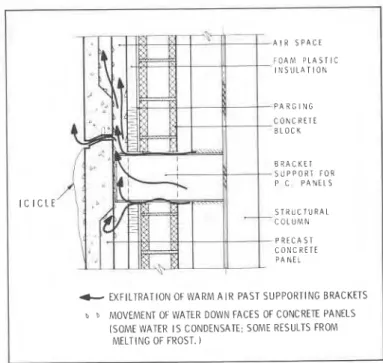
Although there were other indications of what was happen- ing, the entire pattern of air movement could have been deduced directly from the thermograms: infiltration of cold dry air occurred below the third floor and as the internal air pressures increasingly exceeded ambient in the floors above this level, larger quantities of warm humid air were forced out round the brackets into the air space to impinge on the back of the precast concrete panels. Depending upon the temperature of the panels, the moisture condensed as water or frost (Figure
11). Some of the warm humid air not impinging on any cold
surface escaped to the outside through horizontal joints between the panels. Under the right conditions this condensa- tion or melting frost ran down the back of the concrete panels to the nearest horizontal joint where it was directed outward and simply wetted the face of the panel, or formed icicles if the external air temperature was sufficiently low (Figure 12). - Plate
4 is a colour thermogram taken two or three weeks after the first when temperature and pressure differences were smaller and the air was still. A sensitivity scale was selected that encompassed the full range of temperatures. Thermal patterns were similar, but the actual temperature peaks were more clearly defined and it was possible to confirm that the worst air leakage was occurring at the left side of the bay at the fifth floor.
One factor had changed; to reduce condensation behind the uppermost slab, holes had been cut through the coping at the
. I A I R S P A C E F O A M P L A S T I C I N S U L A T I O N P A R G I N G C O N C R E T E B L O C K B R A C K E T S U P P O R T F O R P . C . P A N E L S S T R U C T U R A L C O L U M N P R E C A S T C O N C R E T E P A N E L
-
EXFILTRATION OF W A R M A I R PAST SUPPORTING BRACKET ?k ACCUMULATION OF FROST ON COLD SURFACESA I R S P A C E F O A M P L A S T I C I N S U L A T I O N P A R G I N G C O N C R E T E B L O C K B R A C K E T S U P P O R T F O R P C P A N E L S I C I C L E S T R U C T U R A L C O L U M N P R E C A S T C O N C R E T E P A N E L
-
EXFILTRATION OF W A R M A I R PAST SUPPORTING BRACKETSb b MOVEMENT OF WATER DOWN FACES OF CONCRETE PANELS
(SOME WATER I S CONDENSATE; SOME RESULTS FROM MELTING OF FROST. 1
parapet. This allowed warm moist air to escape directly to the
outside air (Plate 5) and appears to have lessened the heat loss
from the upper right side of the bay. Consequently the ,
ternperature of this upper panel was generally lower than that of the panels immediately below, and it exhibits a slightly
different thermal pattern from that in Plate 1 .
Figure 13. Photograph of East Block, Parliament Buildings.
Heritage Buildings
The thermogram for this last example has been supplied by Public Works Canada, the department that has responsibility for a great number of public buildings of all sizes, including modern and heritage buildings. They have developed a high degree of expertise in thermographic techniques for building evaluation. In considering retrofitting programs for heritage buildings three factors are important. The first is the preserva-
Figure 1 1. Air leakage past brackets supporting precast tion of the outer surface in its original condition, and in many
concrete panels. cases the inside surface as well, limiting retrofitting of insula-
tion to the filling of cavity walls. The second consideration is the conservation of energy, making some insulation desirable. The third is the improvement of comfort conditions inside the building, and this usually entails operating at higher relative humidities than in the past.
The difficulty of providing a proper air seal, the colder operating temperature of the outside masonry when the wall is insulated, and the high relative humidity of the air leaking out of the building can unfortunately cause wetting and an increased rate of deterioration of building materials.
Infrared thermography can be useful in identifying air leakage paths both before and after a retrofit.
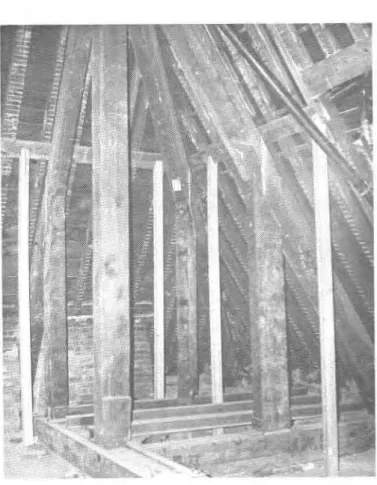
Figure 13 is a photograph of the East Block of the Canadian Parliament Buildings in Ottawa, which has now been retrofit- ted. The stone structure is surmounted by a complex mansard roof with dormers protruding through the lower, steeper
section. Figure 14 shows part of the roof framing and timber
supports in the attic space and illustrates the extreme difficulty of installing a continuous air barrier under such conditions.
Figure 15 is a thermogram of the East Block, showing a
relatively hot area at the open junction of the two slopes of the
1 roof. It is due to leakage of large quantities of warm air. This
thermogram was taken with a device called a "Super Vie-
Figure 12. Formation of wetting patterns and icicles on wer", which superimposes the thermal image on a visual
SUMMARY AND CONCLUSIONS
Infrared thermography provides a very usefuI tool for investigating building faults that produce temperature anomalies on the surface of a building envelope. Many extraneous factors such as wind and wetting, not directly related to the fault, may greatly influence the temperature patterns obtained. Such influences must be avoided whenever possible; but if this is impossible, the effect each might have must be taken into consideration in interpreting the results of a thermographic survey.
The infrared camera system is being developed and refined constantly. With this development comes new applications and better, more useful results from thermographic investigations. Many of the shortcomings in the past which were due to inexperience are now being overcome by the large number of experienced thermographic specialists practicing in the field. References
I . Holt, F.B., and D.G. Manning, "Infrared Thermography for the
Detection of Delaminations in Concrete Bridge Decks," in: Proc,redings
of the fourth biennial lnfrured I n f i ~ r ~ n u t i o ~ ~ Erc,hrr~ige (IRIE), 22-24
August 1978, ed. Roben A. Miller (Secaucus, New Jersey: AGA Corporation, 1979), pp. A61-A71.
2. Stockbridge, J.G., "Evaluation of Terra Cotta on In-Service Struc-
tures," in: 1st lnrernutiorztrl Cof$>~urrc,e on B~lilding Mu/erinI.s t ~ n d
Componrizts, 21 -23 August 1978, A S W Sprc,itrl Pnblit~ution #6Yl , eds. P . J . Sereda and G.G. Litvan (Philadelphia, PA: American Society for Testing Materials, c. 1980), pp. 218-230.
3. Brand, R.G.. "High Humidity Buildings in Cold Climates - A Case
History," ASTM Spcciul Public~ution #69/ (see Ref. 2). eds. P.J. Sereda and G.G. Litvan (Philadelphia: American Society for Testing and Materials, c. 1980). pp. 23 1-238.
Figure 14. Framing in the roof space of the East Block, Parliament Buildings.
Bibliography
Siegel, Robert and John R . Howell, Thrrmul Rudicition Heot Trurlsfer (New
York: McGraw-Hill, 1972).
Kreith, Frank, Print ip1c.s of Htwt Trun.sfc,r (New York: Intext Educational Publisher, 1973).
Figure 15. Thermogram of East Block, Parliament Build- ings.
Procredi~~gs of rh~, filurrh hienniol Infrurrd Infor~~iution E.rthu~lgr (IRIE),
22-24 August 1978, ed. Robert A. Miller (Secaucus, New Jersey: AGA Corporation, 1979).
Proc,eedings of rhr 1st Nutionul Corzfermcr on the Cupuhi1itie.s urld Limitu- tion.\ of' Thc~rmcll Infrurrd Srnsing Tc,c,hnology in Energy Conservtrtion Progrrrms, Thermosense I, 20-21 September 1978 (Falls Church, Virginia:
American Society of Photogrammetry, 1979).
Proc,redings oJ the Second Narionul Confi.rrnc,r on Thermul Infi-ured Sensing G c h ~ i o l o g y for Etlrrgy Con.sc.rvcrtio~z Progru~ns , Thermosense 11, November 1979 (Falls Church, Virginia: American Society of Photogrammetry, 1980). "Thermal Infrared Sensing Applied to Energy Conservation in Building Envelopes, Thermosense 111, 1980," Proc. Soc. Photo-Opt. Instr. Eng., Vol. 254, 1981.