Effect of Ga doping on magneto-transport properties in colossal
magnetoresistive La
0.7Ca
0.3Mn
1-xGaxO
3(0<x<0.1)
Marek P kałaa, Jan Muchab, Benedicte Vertruyenc, Rudi Clootsc, Marcel Ausloosd
aDepartment of Chemistry, University of Warsaw, Al. Zwirki i Wigury 101, PL-02-089 Warsaw, Poland bInstitute of Low Temperature and Structural Research, Polish Academy of Sciences, PL-50-950 Wroclaw, Poland cSUPRATECS, University of Liege, Institute of Chemistry B6, Sart Tilman, B-4000 LIEGE Belgium
dSUPRATECS, University of Liege, Institute of Physics B5, Sart Tilman, B-4000 LIEGE Belgium
Abstract
Samples of La0.7Ca0.3Mn1-xGaxO3 with x = 0, 0.025, 0.05 and 0.10 were prepared by standard solid-state reaction.
They were first characterized chemically, including the microstructure. The magnetic properties and various transport properties, i.e. the electrical resistivity, magnetoresistivity (for a field below 8 T), thermoelectric power and thermal conductivity measured each time on the same sample, are reported. The markedly different
behaviour of the x = 0.1 sample from those with a smaller Ga content, is discussed. The dilution of the Mn3+ /Mn4+ interactions with Ga doping considerably reduces the ferromagnetic double exchange interaction within the manganese lattice leading to a decrease of the Curie temperature. The polaron binding energy varies from 224 to 243 meV with increased Ga doping.
Keywords: Ga doped manganites; Colossal magnetoresistance; Thermoelectric power; Thermal conductivity
1. Introduction
Since the early nineties, there has been a renewed interest for the mixed-valence manganites Ln1-xAxMnO3
(where Ln is a lanthanide cation and A is usually an alkaline earth ion), due to the colossal magnetoresistance (CMR) properties displayed by some compounds of that family [1, 2]. On one hand, films [3] of these materials have potential applications, e.g. as magnetic sensors or in computer memory systems [4]. On the other hand, it is expected that the understanding of the underlying physical mechanisms could lead to substantial advances in the field of strongly correlated electron physics.
CMR compounds such as La0.7Ca0.3MnO3 are characterized by a maximum in magneto-resistance coupled to a transition involving electrical and magnetic properties, i.e. the system goes from a ferromagnetic/metallic-like phase at low temperature to a paramagnetic/insulating phase at higher temperature. Since many different cations can be substituted either on the Ln or on the Mn site, a large amount of experimental data is now available [5]. It turns out that the various exchange interactions in the three-dimensional manganese oxygen network imply considerable variability of structures. E.g. recently [6,7] we have substituted a small amount of Y on the Ln site and discovered a rich phenomenology in the specific heat and electrical resistivity of La0.6Y0.1Ca0.3MnO3 in zero magnetic field due to short-range magnetic ordering in disordered clusters, in particular due to the Mn-O-Mn bond environment. Magnon-polaron and spin-polaron signatures were revealed together with charge localisation mechanisms. Introducing foreign nonmagnetic cations on the Mn site of mixed-valency manganites Ln1-xAxMnO3 is also known to lead to severe modifications of the magnetic and electrical properties, as well in
conductive ferromagnetic manganites [8-10] as in insulating charge-ordered compounds [11,12]. In the ferromagnetic region due to Mn ions replacement with such metals there are sometimes features ascribed to a weakening of the Zener double-exchange interaction between two unlike ions [13]. It seems that more data, and on different properties other than the electrical resistivity could bring some further information on the
microscopic mechanisms.
In the present work we have studied the substitution of a small amount of gallium ions onto the manganese site of La0.7Ca0.3MnO3. The Ga3+ ion has the same charge and a similar ionic size as Mn3+, but has no magnetic moment (d10 configuration). Thus Ga doping does not cause lattice distortions. Due to these specific
characteristics, Ga-substituted manganites have often been used as a model system for studying super-exchange interactions in LaMnO3 (see Refs. [14-22]). Meera et al. [18] and Yusuf et al. [19] studied the magnetic properties of La0.67Ca0.33Mn1-yGayO3 samples with y = 0.1. Cao et al. [20] reported X-ray absorption results for
La0.7Ca0.3Mn1-yGayO3 compounds with y 0.1. Sun et al. [21] published a paper focused on the paramagnetic
regime of La0.67Ca0.33Mn1-yGayO3 samples with y 0.1. An additional interest in the gallium doped manganites
flows from a possible quantum critical point predicted for such a material [22].
This paper was intended to obtain the comprehensive experimental characterization of the La0.7Ca0.3Mn1-yGayO3
systems, including the novel results of thermal conductivity measurements. The systematic investigations of all the magnetic and transport properties were performed on the same and well defined samples. Here below the results of magneto-transport investigations, i.e. of the electrical resistivity, thermoelectric power and thermal conductivity, are presented and discussed. In Section 2, we briefly outline the experimental techniques. In Section 3 the samples are characterized with respect to their chemical content and microstructure. In Section 4 the magnetic properties are given. Sections 5-9 contain results and comments on the various transport properties, measured on the same sample in magnetic field up to 8T. A brief discussion and a conclusion are found in Section 10.
2. Experimental
Samples of La0.7Ca0.3Mn1-xGaxO3 with x = 0, 0.025, 0.05 and 0.10 were prepared by standard solid-state reaction.
Stoichiometric amounts of pre-calcined lanthanum oxide (La2O3), calcium carbonate (CaCO3), manganese oxalate (MnC2O4 • 2H2O) and gallium oxide (Ga2O3) were thoroughly ground in petroleum ether and heated up to 1200 °C with intermediate grindings. Pellets were pressed uniaxially and sintered at 1250 °C during 48 h (samples with x = 0 and 0.025) or 96 h (samples with x = 0.05 and 0.10).
X-ray diffraction patterns were collected with a Siemens D5000 diffractometer (CuK radiation). The
microstructural properties were characterised by scanning electron microscopy (Philips XL30 ESEM) and optical microscopy with polarized light (Olympus AH3-UMA). The cationic composition was checked by energy dispersive X-ray analysis (EDX) coupled to the electron microscope.
The magnetic characterization was performed in a physical property measurement system (PPMS) from Quantum Design. The m(H) curves were collected at 10 K. The AC susceptibility was measured as a function of temperature for a 1 mT and 1053 Hz applied AC magnetic field.
The electrical resistivity was measured by the four probe technique using currents at most 10 mA.
Thermoelectric power and thermal conductivity were simultaneously measured at zero field and under a 8 T field on the same sample using the differential and steady flow methods with a temperature gradient about 1K created by a mW heater. In order to minimise radiation effects on thermal conductivity the radiation shield around samples was kept at the sample temperature. Moreover, thermal conductivity was checked to be independent of applied temperature gradient. Inaccuracy of thermal conductivity due to radiation losses and wire thermal conductivity is about 1%, whereas absolute values are determined with 3% error mainly due to irregular sample geometry. The magneto-transport measurements were basically similar to those described previously [23, 24]. 3. Sample characterisation
The X-ray diffraction patterns of all samples were seen to display the characteristic peaks of a single-phase perovskite manganite structure and were indexed in the Pnma space group. The EDX analysis showed no deviation from the nominal cationic composition within the limit of the technique accuracy. In the case of the sample with x = 0.10, a few grains of some oxide of gallium and manganese were detected.
From polarized light microscopy on sample cuts we observed that the grain cross sections are irregular, varying between 4 and 16 µm2. Grains are relatively smaller for the samples with x = 0 and 0.025, and larger for the samples with x = 0.05 and 0.10, which were sintered during a longer time, as recalled in Section 2.
4. Magnetic properties
Fig. 1 shows the curves of the DC magnetisation at 10 K as a function of the magnetic field up to µ0H = 3T. All
samples display a ferromagnetic behaviour, with coercive fields less than 10mT. In the inset of Fig. 1, the experimental values of the saturation magnetic moment per formula unit at 3T and 10K (black symbols) are compared to the theoretical "spin-only" magnetic moments (dashed line). The theoretical "spin-only" magnetic moments are calculated assuming that magnetic moments per Mn3+ and Mn4+ ions equal to 4 and 3µB,
respectively. When fractions of the Mn3+ and Mn4+ ions are taken as (0.7-x) and 0.3, respectively, the calculated magnetic moment diminishes proportionally to x. Differences between the experimental and theoretical magnetic
moments do not exceed 0.01 µB. This proves that the "spin only" values are adequate at this Ga doping level. Moreover, this shows that practically all manganese ions contribute to the ferromagnetic phase. No
antiferromagnetic ordering has to be assumed.
Fig. 1: Magnetic moment per formula unit at 10K as a function of the DC magnetic field for samples with
different Ga content. The magnetic moment values are given in µB/formula unit. Inset: magnetic moment at 10K
and 3T as a function of the gallium content (x). The dashed line corresponds to the theoretical spin-only values.
Fig. 2: Temperature dependence of the in-phase component of the AC magnetic susceptibility for µ0HAC = 1mT
and f = 1053 Hz. The out-of-phase component of susceptibility for the sample with x = 0.10 is also shown (axis on the right).
The temperature dependence of the in-phase component ( ') of the AC magnetic susceptibility (for 1mT and 1053 Hz) is shown in Fig. 2. The temperature of the magnetic transition decreases when the gallium content increases. The Curie temperatures TC (at the largest slope of the '(T)) are reported in Table 1. For x between 0
and 0.05, the curves display a typical ferromagnetic behaviour, with only a very smooth decrease of the magnetic susceptibility below TC. On the contrary, for the sample with x = 0.10, the magnetic susceptibility
drops significantly below ~90K. The out-of-phase component ( ") of the AC magnetic susceptibility of this sample is also shown in Fig. 2. This curve presents two maxima, at temperatures of 116 and 86K, corresponding respectively, to the ferromagnetic transition and the decrease of magnetic moment observed in the '(T) curve. The temperature dependencies of the DC magnetization under 10 and 100mT for the sample with x = 0.10 are shown in Fig. 3. Just below the Curie temperature one may distinguish the pronounced split between the field-cooled (FC) and zero-field-field-cooled (ZFC) curves for µ0H = 10 mT. On the contrary, the transition interval is
broadened and there is only a small splitting below 40 K between the FC and ZFC curves for µ0H = 100 mT.
La0.7Ca0.3Mn0.9Ga0.1O3 sample. In the range where '(T) drops rapidly, no specific feature can be observed in magnetization below 90 K. The Curie temperatures shifting gradually from 249 K for x = 0 towards 122 K for x
= 0.1, clearly show that the Ga doping weakens the double exchange coupling among the manganese ions.
5. Electrical resistivity
Each measured electrical resistivity (Fig. 4 and 5) of the La0.7Ca0.3Mn1-xGaxO3 systems follows the characteristic
pattern of magnetoresistive materials, exhibiting the two phase behavior with the metallic and semiconducting variations separated by pronounced maximum at the TP (peak) temperature. For all compositions studied the electrical resistance maximum shifts towards high temperatures approximately proportionally to the applied magnetic field, as shown in Fig. 6. This TP shift is accompanied by a remarkable reduction of the resistance maximum magnitude.
At low temperatures the absolute values of the electrical resistivity are only weakly affected by the applied magnetic field. For the zero field case electrical resistivities at 10 K are about 2 to 10 x 10-5 m for x = 0 to 0.05 (Table 1). The electrical resistivity magnitude agrees with values reported by Sun et al. [21]. A considerably higher electrical resistivity value, i.e. about 0.2 m, is found for the x = 0.1 sample. The relatively high values of the ratio of the electrical resistivities at room and at low temperature (RRT/R(10K))reach up to 57, proving a
very good intergrain connectivity and more generally the high quality of the samples.
In the metallic phase the measured electrical resistivity between 10K and TP was fitted to the power type expression [25,26]
where 0 is the resistivity at 10K, value given in Table 1. The values of the N exponent are plotted in Fig. 7. They increase from about 3 to 6 when passing from x = 0 to x = 0.1. Values of N diminish gradually with increasing magnetic field.
Table 1: Magneto-transport parameters for La07Ca03Mn1-xGaxO3 manganites
Sample X Curie temperature (K) Magnetic moment/f.u. (µB) Electrical resistivity at 10 K ( m) RRT/R(10K) TEP break temperature TB (K) Temperature of TEP minimum (K) La0.7Ca0.3MnO3 0 249 3.71 2xl0-5 18 — 189 La0.7Ca0.3Mn0.975Ga0.025O3 0.025 219 3.58 9 x 10⁻⁵ 22 210 227 La0.7Ca0.3Mn0.95Ga0.05O3 0.05 168 3.49 1 x 10⁻⁴ 57 158 188 La0.7Ca0.3Mn0.90Ga0.10O3 0.1 122 3.29 3 x 10⁻¹ 16 70 143
In the semi-conducting phase, between TP and room temperature, thermally activated transport processes
described by
are observed from semi-log plots. The derived activation energy ER increases from 117 to 151 meV when x
varies from 0 to 0.1 (Fig. 8). For x below 0.1, the values of ER diminish with the magnetic field. This proves that the external magnetic field suppresses the transport energy barriers. In other words, similar to the effects of an applied magnetic field [6], this metal-ion doping is again found [13] to decrease the polaron tunneling energy barrier (thus increasing the correlation length).
A different behavior is observed for the sample with x = 0.1, which has relatively higher electrical resistivity. This higher electrical resistivity for x = 0.1 conforms to the tendency, which would consist in enhancing the electron localization with increased Ga doping [20-22], as discussed later. Values of EA attain a minimum at 4T
Fig. 3: Temperature dependence of the DC magnetization of the sample with x = 0.10, for µ0HDC = 10mT (left
axis) and 100mT (right axis) under ZFC and FC conditions.
Fig. 4: Temperature dependence of normalized electrical resistance in zero magnetic field of samples
La0.7Ca0.3Mn1-xGaxO3, x = 0, 0.025, 0.05, 0.1.
6. Magnetoresistance
All the samples studied exhibit a strong negative magneto-resistance (MR) effect (Fig. 9). The most abrupt increase of MR is observed at low magnetic fields, when the MR sensitivity reaches even 11% per 1T for x = 0.1. At the highest applied (8T) magnetic field the MR peak exceeds 92% for all the samples studied. The magnitude of MR only weakly depends on Ga doping, in contrast to the reports by Cao et al. [20]. The
temperature position of the (relatively sharp) magnetoresistance maximum is located close to the TP temperature and seems to be only weakly affected by the magnetic field.
In order to evaluate an influence of magnetic field on magneto-resistance, the area over the MR curves of Fig. 9, was integrated in the same temperature interval for various magnetic fields. It is found for all the samples studied that the MR area varies in proportion to Hn with n equal to 0.58 ± 0.03.
The correlation coefficients R of the electrical resistivity was fitted to Eq. (2), listed in Table 2, show that for 0 x 0.05 the agreement between the experimental results and the adiabatic polaron model weakens with
exhibits the high resistivity. The reason might be due to an increasing short range ordering in the latter compound.
Fig. 5: Temperature dependence of electrical resistance of samples La0.7Ca0.3Mn1-xGaxO3, A. x = 0, B. x = 0.025,
C. x = 0.05, D. x = 0.1.
7. Thermoelectric power
Thermoelectric power of La0.7Ca0.3Mn1-yGayO3 samples is negative in the whole temperature range studied
between 30 and 300K (Fig. 10). For the La0.7Ca0.3MnO3 manganite the thermoelectric power is a smooth function of temperature exhibiting a broad minimum of -30µV/K around 200 K. The sign and temperature variation of TEP agree with those reported for the La0.7Ca0.3MnO3 systems in [27, 28]. The present measurement shows no trace of the TEP minimum around 25 K reported in earlier studies [29]. The Ga doping on Mn sites remarkably affects the temperature variation and the magnitude of TEP. There is much similarity between the behaviours of the TEP as a function of temperature at different Ga doping. The TEP is negative and decreases smoothly up to a
TB break point (Table 1). For x<0.1 the TEP break point is located about 10 to 20K below the electrical
resistivity maximum in zero magnetic field (Fig. 5). It can be observed for the Ga-doped samples that after the break the variation of TEP is quasi-linear with a slope ca. 5/3 µV/K2 (practically the same for all Ga-doped samples) and attains a field dependent minimum (Table 1). The TEP minimum shifts towards lower temperatures
and lower values with higher Ga content (Fig. 10). Then TEP rises smoothly and all TEP curves seem to merge at a -20 µV/K value at a temperature ca. 340K, as indicated by a smooth extrapolation. The present results reveal the high sensitivity of TEP to the Ga doping in the lanthanium-calcium manganites. It is worth noticing that the negative TEP of the manganites studied is in contrast to the low and positive TEP found for the manganites with very close composition La0.67 Ca0.33Mn1-yGayO3 (y = 0.02, 0.05, 0.1) [21]. On the other hand, one may remind
that the manganites studied have a composition very close to this one (0.25 < x < 0.33 ) corresponding to the TEP sign change reported by Ref. [30]. According to the formula as Eq. (2), the activation energy EQ derived from TEP vs temperature variation in the vicinity of the room temperature lies in a range from 5 to 40 meV, when passing from 0 to 0.1 Ga content.
Fig. 6: Temperature position of resistivity maximum v. magnetic field for samples La0.7Ca0.3Mn1-xGaxO3, x = 0,
0.025, 0.05, 0.1.
Fig. 7: Magnetic field dependence of exponent N derived from electrical resistance for samples La0.7Ca0.3Mn 1-xGaxO3, x = 0, 0.025, 0.05, 0.1.
Fig. 8: Magnetic field dependence of activation energy ER derived from electrical resistance for samples
La0.7Ca0.3Mn1-xGaxO3, x = 0, 0.025, 0.05, 0.1.
Fig. 9: Temperature dependence of magneto-resistance for samples La0.7Ca0.3Mn1-xGaxO3, A. x = 0, B. x =
8. Thermal conductivity
The thermal conductivity k(T) of the La0.7Ca0.3MnO3 and La0.7Ca0.3Mn0.95Ga0.05O3 samples are of the same order of magnitude (Fig. 11). The magnitude and temperature variation for La0.7Ca0.3MnO3 are very close to previous reports for La0.7Ca0.3MnO3 [31]. In zero magnetic field both the undoped sample and the one containing 5% of Ga exhibit a maximum k(T) around 30K, i.e. a usual characteristic for metals and dielectrics. The applied magnetic field shifts these maxima towards somewhat higher temperatures temperatures than in the case of the electrical resistivity. The causes are thought to arise from a competition between the anharmonic scattering of heat carriers (predominant at high temperature) and the elastic scattering on defects (predominant at low temperature), grain boundaries and sample boundaries. A very similar thermal conductivity maximum was also reported for La0.7Ca0.3MnO3 in Ref. [32, 33].
Table 2: Correlation coefficient R for electrical resistivity fitted to adiabatic polaron model in temperature
intervals between TP and340K for La0.7Ca0.3Mn1-xGaxO3 manganites
Magnetic field x = 0 x = 0.025 x = 0.05 x = 0.1 (T) R TP(K) R TP(K) R TP(K) R TP(K) 0 0.99987 267 0.99982 233 0.99983 189 0.99847 143 0.2 0.99997 272 0.99985 238 0.99978 192 0.99964 168 0.5 0.99978 271 0.99981 238 0.99965 204 0.99950 167 1 0.99972 277 0.99968 244 0.99954 200 0.99924 167 2 0.99941 298 0.99979 260 0.9998 223 0.99971 201 4 0.99803 308 0.99959 287 0.99979 250 0.99965 222 6 0.99646 312 0.99947 300 0.99829 251 0.99968 227 8 0.99156 322 0.99879 312 0.99982 280 0.99973 233
Fig.10: Temperature variation of thermoelectric power of samples La0.7Ca0.3Mn1-xGaxO3, x = 0, 0.025, 0.05, 0.1.
Above its maximum the thermal conductivity of La0.7Ca0.3MnO3 can be approximated by k(T)~T-0.37 up to 100K. For the La0.7Ca0.3Mn0.95Ga0.05O3 sample a similar formula applies only up to 70 K. Since the exponent is lower than 1, a value expected for purely anharmonic effects, we may conclude that some additional mechanisms, beyond those listed here above, play a role in such materials. In zero magnetic field the thermal conductivity of La0.7Ca0.3Mn0.95Ga0.05O3 samples diminishes monotonically down to a minimum at 240K—about 20 K below the
electrical resistivity maximum. Above this minimum k(T) varies almost proportionally to temperature. This removes any noticeably spurious effect of radiation, which should be proportional to T3. Unfortunately now it is impossible to distinguish a specific mechanism responsible or dominating in this temperature range before performing further studies.
The temperature variation of the thermal conductivity of La0.7Ca0.3Mn0.95Ga0.05O3 is more complicated exhibiting a maximum around 150K. The mechanism leading to this second maximum is not yet fully understood. The electronic contribution to k(T) estimated from electrical resistivity by a Wiedemann-Franz relation, does not exceed 1 % of measured k(T) and proves that heat is transported overwhelmingly by phonons. The phonon contribution to k(T) varies as T-1 due to anharmonic mechanism [34]. On the other hand, the magnon one depends on temperature as T2, as shown by Hess et al. [32, 33] for La2CuO4 . Thus, the second k(T) maximum can be thought to result from a superposition of the phonon and magnon conductivities, exhibiting opposite temperature dependencies. Notice however that the electronic scattering by magnetic impurities can also lead to a peak in k(T) at moderate temperature [35]. For the La0.7Ca0.3Mn0.95Ga0.05O3 sample the k(T) minimum is located at 170K for zero magnetic field. Also for this sample the k(T) minimum coincides with a resistivity maximum for zero magnetic field. The radiation effects are not seen in the roughly linear variation of k(T) above the minimum.
Fig. 11: Temperature variation of thermal conductivity for La0.7Ca0.3MnO3 at 0 and 8T fields and for
9. Magnetothermal conductivity
An application of a magnetic field of 4 T, removes the k(T) minimum found in zero magnetic field for the thermal conductivity of La0.7Ca0.3MnO3 samples (Fig. 11 A) around 240K—about 20K below the electrical resistivity maximum. When applying a 4T magnetic field, the residual k(T) minimum is shifted up to 280K, only 10K below the electrical resistivity maximum (Fig. 5A). An influence of external magnetic field on heat transport is further confirmed for La0.7Ca0.3Mn0.95Ga0.05O3 system by a comparison of k(T) in zero and 8T fields (Fig. 11B). In the 8T magnetic field k(T) minimum shifts to 200K— about 40K below the electrical resistivity maximum (Fig. 5C).
The role of an external magnetic field is additionally demonstrated in Fig. 12 showing the difference in thermal conductivity D(T) = k(T, H) - k(T, H = 0). For La0.7 Ca0.3MnO3 sample the D(T) curve has a broad maximum around 240 K, which coincides with the electrical resistivity maximum. For a sample containing 5% of Ga the
D(T) maximum appears at 150K and the values of D(T) rise abruptly to above 220K.
Fig. 12: Temperature variation of a difference in thermal conductivity measured in the zero and high magnetic
fields for La07Ca03MnO3 and for La0.7Ca0.3Mn0.95Ga0.05O3.
10. Discussion
The Ga3+ ion has a complete d-shell, which does not have any magnetic moment. The very good agreement demonstrated between the experimental values for the saturation magnetisation and the theoretical spin-only values shows that gallium substitution up to x = 0.10 does not prevent the long range ferromagnetic alignment of the Mn3+ and Mn4+ ions. The neutron diffraction studies have shown that replacement of Mn by Ga induces a continuous decrease of the tetragonal distortion of the (Mn/Ga)O6 octahedra, which become practically regular for x = 0.6 [36]. On the other hand, the dilution of the Mn3+ /Mn4+ interactions by the gallium ions do not contribute to ferromagnetic exchange leading to a decrease of the Curie temperature.
For x up to 0.05, there is a good agreement between TC and the temperature of the resistance maximum in the
R(T) curves. On the contrary, for x = 0.10 there is a difference of ~50 K between TC (129 K) and the resistance maximum (82 K). However, the MR(T) curves for the sample with x = 0.10 display a shoulder in the temperature range near TC. The Ga dopping affects also the transport processes in manganites. The lattice sites occupied by
the Ga3+ ions constitute the barriers for the conduction carriers, which in turn reduces a number of the active conduction paths. The EDX analysis did not reveal any noticeable diferences in Ga density at grain boundaries and in grain cores of manganites studied. Such an homegeneous distribution og Ga is in contrast to this compounds doped with Ru transtion metal. It was observed for the Ru doped manganites that the enhanced
dopant density at grain boundaries leads to the additional electron scattering processes at grain boundaries [37, 38].
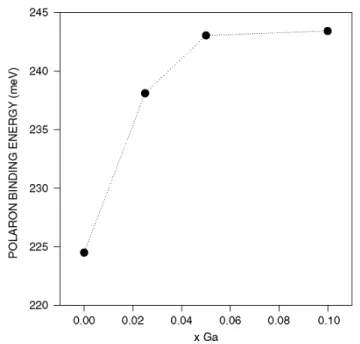
Applying the polaron model and combining the activation energies ERand EQ determined from the electrical
resistivity and thermoelectric power data, respectively, the polaron binding energy EB was determined for
manganite samples with various Ga content according to a formula [21]
Values of EB plotted in Fig. 13 show that an increase from 224 to 243 meV when the Ga content increases from
0 to 0.1. The same type of variation of EB with Ga doping was also reported by Sun et al. [21], however their
values of EB are about 70 meV lower for x = 0 and almost coincide for x = 0.1. Such a difference may be at least
partially due to a different microstructure following a somewhat different heat treatment during the sample preparation.
Fig. 13: Variation of polaron binding energy on Ga content x for samples La0.7Ca0.3Mn1-xGaxO3, x = 0, 0.025,
0.05, 0.1.
In conclusion, the adiabatic polaron model seems to be of interest for explaining features seen in electrical transport properties. It takes a step to decide that the features observed on thermal transport do reveal the same mechanisms. The additional perspective of assisted tunnelling due to the disordered environment imposed by Ga substitution seems to smoothen any apparent disagreement, if any occurs. This is particularly the case for "large" Ga content substitution. Indeed (and in fact) Ga doping on Mn sites remarkably affects the temperature variation of TEP and a systematic set of behaviours—confirming a role played by Ga doping in localization phenomena. However TEP is a complex quantity to analyse, since it mixes entropy and scattering effects. A theory of TEP in substituted CMR materials seems regrettably lacking. The merging of TEP curves at high temperature might be of interest in order to understand the interplay between electronic density of states variation and spin scattering mechanisms by various excitations. It might be a crucial theoretical test. The same can be said of the thermal conductivity, which we recall shows a multipeak structure, and its subsequent magnetic field dependence. Beyond the lowest temperatures the applied magnetic field enhances thermal conductivity in the manganites studied. One could also expect that the thermal conductivity should diminish with raising Ga doping, which destroys the double exchange paths. Moreover the Ga point defects act as additional scattering centres. Unfortunately the 10% inaccuracy in geometrical dimensions of samples does not allow to directly compare a magnitude of thermal conductivity for both samples and to answer this question. The magnetoresistance effect is found to increase both with raising Ga doping and magnetic field strength. It is worth noticing that the higher Ga doping broadens the temperature interval and also enhances the magnetoresistance magnitude (Fig. 9).
Acknowledgements
Work supported in parts by PST.MEM.CLG.980654, Polish-Belgian Scientific Exchange Program, Scientific Net "Oxide materials with highly correlated electrons" and FNRS (Belgium) fellowship (BV). The help by Ph. Vanderbemden and J.F. Fagnard is kindly acknowledged.
References
[1] K. Chahara, T. Ohno, M. Kasai, Y. Kozono, Appl. Phys. Lett. 63 (1993) 1990.
[2] Y. Tokura, A. Urushibara, Y. Morimoto, T. Arima, A. Asamitsu, G. Kidu, N. Furukawa, J. Phys. Soc. Jap. 63 (1994) 3931. [3] S. Jin, T.H. Tiefel, M. McCormack, R.A. Fastnacht, R. Ramesh, L.H. Chen, Science 264 (1994) 413.
[4] G.A. Prinz, Phys. Today 4 (1995) 58.
[5] J.M.D. Coey, M. Viret, S. von Molnar, Adv. Phys. 48 (1999) 167.
[6] S. Sergeenkov, H. Bougrine, M. Ausloos, A. Gilabert, JETP Lett 70 (1999) 141.
[7] M. Ausloos, L. Hubert, S. Dorbolo, A. Gilabert, R. Cloots, Phys. Rev. B 66 (2002) 174436.
[8] K. Ghosh, S.B. Ogale, R. Ramesh, R.L. Greene, T. Venkatesan, K.M. Gapchup, R. Bathe, S.I. Patil, Phys. Rev. B 59 (1999) 533. [9] R. Ganguly, I.K. Gopalakrishnan, J.V. Yakhmi, Physica B 275 (2000) 308.
[10] S.L. Yuan, ZY. Li, XY. Zeng, GQ. Zhang, F. Tu, G. Peng, J. Liu, Y. Jiang, Y.P. Yang, C.Q. Tang, Eur. Phys. J. B 20 (2001) 177. [11] C.N.R. Rao, A. Arulraj, P.N. Santhosh, A.K. Cheetham, Chem. Mater. 10 (1998) 2714.
[12] B. Raveau, A. Maignan, C. Martin, M. Hervieu, Chem. Mater. 10 (1999) 2641. [13] M. Rubinstein, D.J. Gillespie, J.E. Snyder, T.M. Tritt, Phys. Rev. B 56 (1997) 5412. [14] J.S. Zhou, H.Q. Yin, J.B. Goodenough, Phys. Rev. B 63 (2001) 184423.
[15] J. Töpfer, J.B. Goodenough, Eur. J. Solid State Inorg. Chem. 34 (1997) 467.
[16] J. Blasco, J. Garcia, J. Campo, M.C. Sanchez, G. Subias, Phys. Rev. B 66 (2002) 174431.
[17] B. Vertruyen, S. Hebert, A. Maignan, C. Martin, M. Hervieu, B. Raveau, Cryst. Eng. 5 (2002) 299. [18] K.V.K. Meera, V. Ravindranath, M.S.R. Rao, J. Alloys Compounds 326 (2001) 98.
[19] S.M. Yusuf, M. Sahana, K. Dörr, U.K. Rössler, K.H. Müller, Phys. Rev. B 66 (2002) 064414.
[20] D. Cao, F. Bridges, M. Anderson, A.P. Ramirez, M. Olapinski, MA. Subramanian, C.H. Booth, GH. Kwei, Phys. Rev. B 64 (2001) 184409.
[21] Y. Sun, X. Xu, L. Zheng, Y. Zhang, Phys. Rev. B 60 (1999) 12317.
[22] J.M. De Teresa, PA. Algarabel, C. Ritter, J. Blasco, M.R. Ibarra, L. Morellon, J.I. Espeso, J.C. Gomez-Sal, Phys. Rev. Lett. 94 (2005) 207205.
[23] M. P kała, V. Drozd, J. Mucha, J. Mag. Mag. Mater. 290-291 (2005) 928.
[24] M. P kała, J. Mucha, M. Baran, I. Troyanchuk, B. Krzyma ska, H. Szymczak, J. Mag. Mag. Mater. 292 (2005) 385.
[25] V. Ravindranath, M.S. Ramachandra Rao, G Rangarajan, Y. Lu, J. Klein, R. Klingeler, S. Uhlenbruck, B. Buchner, R. Gross, Phys. Rev. B 63 (2001) 174434.
[26] G. Venkataiah, P. Venugopal Reddy, J. Mag. Mag. Mater. 285 (2005) 343.
[27] R. Mahendiran, S.K. Tiwary, A.K. Raychaudhuri, T.V. Ramakrishnan, R. Mahesh, N. Rangavittal, C.N.R. Rao, Phys. Rev. B 53 (1996) 3348.
[28] M.F. Hundley, J.J. Neumeier, Phys. Rev. B 55 (1997) 11511.
[29] R. Mahendiran, S.K. Tiwary, A.K. Raychaudhuri, Solid State Commun 98 (1996) 701.
[30] T.T.M. Palstra, A.P. Ramirez, S.-W. Cheong, B.R. Zegarski, P. Schiffer, J. Zaanen, Phys. Rev. B 56 (1997) 5104. [31] J.L. Cohn, J.J. Neumeier, C.P. Popoviciu, K.J. McClellan, Th. Leventouri, Phys. Rev. B 56 (1997) R8495. [32] C. Hess, U. Ammerahl, C. Baumann, B. Büchner, A. Revcolevschi, Physica B 312-313 (2002) 612.
[33] C. Hess, B. Bûchner, U. Ammerahl, L. Colonescu, F. Heidrich-Meisner, W. Brenig, A. Revcolevschi, Phys. Rev. Lett. 90 (2003) 197002.
[34] R. Berman, Thermal Conductivity in Solids, Clarendon Press, Oxford, 1976. [35] A. Rassili, M. Ausloos, J. Magn. Magn. Mater. 163 (1996) 153.
[36] M.C. Sanchez, G. Subias, J. Garcia, J. Blasco, Phys. Rev. B 69 (2004) 184415.
[37] L. Seetha Lakshmi, V. Sridharan, D.V. Natarajan, S. Chandra, V. Sankara Sastry, T.S. Radhakrishnan, P. Pandian, R. Justine Joseyphus, A. Narayanasamy, J. Mag. Mag. Mater. 257 (2003) 195.