Publisher’s version / Version de l'éditeur:
Energy and Buildings, 2, pp. 259-270, 1979
READ THESE TERMS AND CONDITIONS CAREFULLY BEFORE USING THIS WEBSITE. https://nrc-publications.canada.ca/eng/copyright
Vous avez des questions? Nous pouvons vous aider. Pour communiquer directement avec un auteur, consultez la première page de la revue dans laquelle son article a été publié afin de trouver ses coordonnées. Si vous n’arrivez pas à les repérer, communiquez avec nous à [email protected].
Questions? Contact the NRC Publications Archive team at
[email protected]. If you wish to email the authors directly, please see the first page of the publication for their contact information.
NRC Publications Archive
Archives des publications du CNRC
This publication could be one of several versions: author’s original, accepted manuscript or the publisher’s version. / La version de cette publication peut être l’une des suivantes : la version prépublication de l’auteur, la version acceptée du manuscrit ou la version de l’éditeur.
Access and use of this website and the material on it are subject to the Terms and Conditions set forth at
An appraisal of task-ambient lighting systems
Levy, A. W.; Wotton, E.
https://publications-cnrc.canada.ca/fra/droits
L’accès à ce site Web et l’utilisation de son contenu sont assujettis aux conditions présentées dans le site LISEZ CES CONDITIONS ATTENTIVEMENT AVANT D’UTILISER CE SITE WEB.
NRC Publications Record / Notice d'Archives des publications de CNRC:
https://nrc-publications.canada.ca/eng/view/object/?id=ba43ad28-ae14-4d54-b1f8-1a816cd02bcc https://publications-cnrc.canada.ca/fra/voir/objet/?id=ba43ad28-ae14-4d54-b1f8-1a816cd02bcce r
~1
National Research
Conseil
national
V21d
Council Canada
de
recherches Canada
AN APPRAISAL OF
TASK-AMBIENT LIGHTING SYSTEMS
by
A.W.
Levyand
E,
Wotton
Reprinted from
Energy and Buildings
NRC
-
BLDG.
RES.
L I B R A R Y
DBR
Paper No. 904Division of Building Research
L e s auteurs d6crivent quatre modes dlbclairage travail/d1ambianca: luminaires auplafond s e u l e - ment, torch'eres indirectes pour 116clairage tra- vail seulement, luminaires d16clairage travail incorporgs au mobilier et torch'eres indirectes pour llCclairage travail e t d'ambiance.
Energy and Buildings, 2 (1979) 259
-
270@ Elsevier Sequoia S.A., Lausanne - Printed in the Netherlands
An Appraisal of Task-Ambient Lighting Systems
A. W . LEVYEnergy and Services; Section, Division o f Building Research, National Research Council o f Canada, Ottawa, Canada. K I A O R 6
and E. WOTTON
Lighting Consultant, 6 3 High Park Blvd., T o r o n t o , Canada. M 6 R 1 M 9
(Received February 1 5 , 1 9 7 9 ; revised May 1 8 , 1 9 7 9 )
Four task-am bient lighting schemes are categorized: luminaires in the ceiling only, in- direct torcheres for task lighting alone, task lighting luminaires built into furniture, and task and ambient lighting both provided by indirect torcheres. A photometric appraisal o f each o f these cqtegories was performed on installations in Canada and the U.S.A. Photo- metric measurements included horizontal illu- minance, equivalent sphere illuminance, contrast renderieg factor, luminance and reflectance. Data were also collected on the total power loaging per unit area o f work space as found in the offices containing the various systems. The results are evaluated in terms o f currenlt North American recom- mended practice with a detailed discussion o f each system appraised. It was concluded that none o f the systems measured met North American recom~ended IES lighting levels and the quantity and quality o f illumination varied enormousiy amongst the sample o f task-ambient systems investigated. Low ambient lighting devels can significantly affect
the ovemll quality o f light and may also
I require the surfaces o f surrounding vertical
walls and partitions to be separately illumi- nated. Nevertheless, it is the opinion o f the authors that, if properly designed, task- ambient lighting systems offer significant
i potential for power savings in office lighting
I systems.
INTRODUCTION '
Like many otfier building services lighting has recently come under close scrutiny with respect to its energy efficiency and energy
consumption in buildings. One of the most common methods of regulating consumption is by setting an upper limit to the installed power loading in terms of watts per square metre of floor area.
A convenient method of complying with the new power loads is to use the concept of task-ambient lighting. The idea is not new but the current methods of achieving it are.
In simple terms task-ambient lighting schemes concentrate most of the light on the work station and reduce light levels elsewhere. The traditional office lighting scheme of high uniform illuminance throughout an entire office is therefore being challenged as an energy-inefficient method of illumination. Power loadings to achieve a typical uniform illuminance of 750
lx
can be anywhere be- tween 30 and 70 w/m2. In order to achieve lower power loadings the exploitation of the task-ambient lighting concept has become popular, in particular, task-luminaires built into office furniture and desks. It has been estimated that task-ambient lighting systems will constitute a $10 to $14 million invest- ment in the U.S.A. alone, for the 1979 fiscal Year[ l l .
For the purpose of this paper, task lighting can be defined as, illumination purposely installed and directed so as to provide the necessary illuminance for the execution of typical office tasks on a horizontal surface, e.g. reading and/or writing. Ambient lighting depotes the illumination provided in an office space as general lighting for access, circulation and for viewing non-critical visual tasks from the work station.
Task-ambient lighting schemes can be categorized into four approaches.
260
1.
Luminaires in the ceiling only. The lumi- PHOTOMETRIC MEASUREMENTSnaires provide light everywhere in the office
but are located so as t o direct most of their Horizontal illuminance (the light flux inci- light to the work surface. This form of illumi- dent per unit area) serves as a measure of nation is sometimes termed localized lighting. lighting quantity; it can be measured and
2. Indirect torcheres, that is, an indirect expressed in lux (lumens/m2).
floor lamp sending all or nearly all of its light Lighting quality can be pursued through upward to be reflected from the ceiling t o the to two separate factors: luminance, the objec- working plane. The torcheres are placed close tive brightness of a surface, and in particular, to the work station so that most of the in- the luminance ratio of important surfaces; direct light falls on the work surface. and "equivalent sphere illumination" (ESI). 3. Task lighting at each individual work sta- Luminance (in candelas/m2) is the photomet- tion with ceiling mounted luminaires to ric brightness of a surface. With the use of a provide ambient light. standard of known reflectance, luminance 4. Task lighting as in NO. 3 but ambient measurements enable the reflectances of lighting provided by indirect torcheres or by important surfaces at the work Station to be indirect luminaires built into the furniture. calculated. ESI* is a measure of how well a A photometric appraisal of each of the four lighting system renders contrast, and is there- approaches is presented in this paper. An fore related to the level of visibility given by appraisal at this time is most appropriate in that system. The ESI concept is most impor- Canada because of the recent publication of tant to the conclusions drawn from this work, federal energy conservation measures [ 2 ] . A therefore ESI and its measurement are dis- lighting load of 22 w/m2 is recommended for cussed separately.
office spaces at current North American A Hagner Universal Photometer Model 2
Illuminating Engineering Society (IES) light- was employed for all measurements, illumi- ing levels. Task-ambient lighting would appear nance, luminance and ESI. For the ESI to be a practical means of complying with this measurements specially constructed cylinders lower power loading which may be difficult [ 3 ] were placed over the photocell and the t o achieve adopting traditional office lighting results fed into a programmed desk calculator. design principles. The calculation also produced values of the
The purpose of this present study was to "contrast rendering factor" (CRF). perform the appropriate photometric
measurements in order to compare lighting
quantity and quality between systems, and EQUIVALENT SPHERE ILLUMINATION
with recommended practice; to invesgitate the
energy saving potential of the systems using For an achromatic object to be perceived available statistics on the use of office space; there must be a difference in luminance be- to formulate a competent appraisal method; tween the task detail and its immediate back- and to aid potential users and designers in ground. Contrast can be measured as the assessing the type of information required t o "luminance difference ratio", between detail usefully evaluate task-ambient lighting and background. Equally important for vision systems. is the sensitivity of the eye to contrast which This study of commercially available task- is largely dependent on the observer's state of ambient lighting systems was carried out with adaptation, that is the level of light the eye is the understanding that the researchers would adapted to. Substantial evidence exists [4] keep the source of their data strictly confi- that contrast and the eye's sensitivity to it dential. The systems appraised and reported (contrast sensitivity) is one of the most here cannot, therefore, be described in important factors in determining visibility, i.e.
complete detail. how well one can see the object of interest. Furthermore, it is possible t o trade-off illu- minance for contrast and retain the same level
*ESI takes the same units as illuminance, namely,
lux. However, to distinguish the two, numerical of visibility. Quite simply, within certain
~
values of the former are expressed in ESI units and limits, lighting levels can be reduced withthe
increased and
vice versa. This important prin-
ciple leads directly to energy-effective lighting design where the contrast of visual task is of paramount importance. Less light is required and therefore fewer fixtures if a lighting system can be designed such that the light flux incident on the visual task enhances its contrast.Many factors that have a significant effect on visibility such as size, exposure time, dis- ability glare, transient adaptation and observer age may be expressed in terms of a contrast multiplier. The importance of contrast for the visibility of common two- dimensional tasks requires the illuminating engineer to develop procedures to measure the effect on luminance contrast of different lighting installations. This has been accom- plished through measurements of the "contrast rendering factor" (CRF) and "equivalent sphere illumination" (ESI).
An installation producing significant veiling reflection in a task will seriously reduce the visibility of that task. Veiling reflections are the minute specular reflections superimposed on diffuse reflections from an object, that partially or totally obscure details by reducing contrast. Reflected glare is an extreme and noticeable example of this condition where a luminaire itself can be seen by specular reflec- tion in the surface of a visual task. However, veiling reflections occur to a greater or lesser extent in all real surfaces due t o the combina- tion of the reflecting properties of the visual task and the magnitude and direction of the incident light flux. Veiling reflections are quantified by the "contrast rendering factor" (CRF) which, for most practical purposes, can be measured as the ratio of the luminance contrast of a task in a given lighting system to its contrast under reference sphere lighting conditions.
"Equivalent sphere illumination" (ESI) quantifies the effects of veiling reflections (CRF) and the level of light adaptation that pertains. It provides a relative measure of visibility [ 5 ] for a given lighting installation and given visual task, and is the level of sphere illuminance that produces the same task visibility as the particular lighting installation of interest. Sphere illumination is that pro- duced in a photometric sphere giving a perfectly diffuse illuminance and for which luminances are equal from point t o point. It
was chosen as a reference lighting system be- cause it is a convenient and easily reproduc- ible reference lighting condition with very few veiling reflections possible. By definition, CRF must equal unity in the sphere. Values of the CRF close to and greater than unity indicate an installation producing very few veiling reflections and consequently poten- tially good visibility whilst the converse is true when the CRF is much less than unity. More complete and detailed discussions of ESI and related factors can be found else- where [ 4
-
61.MEASUREMENTPROCEDURE
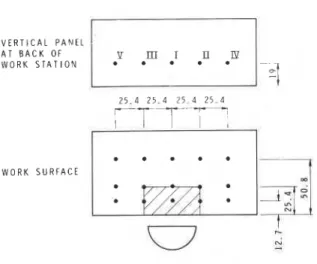
The distribution of test points for the measurement of illuminance, luminance and ESI (and CRF) are shown in Figs. 1 to 7.
Illuminance and luminance were measured without body shadow. The ESI cylinders incorporate a head and body shadow mask so that all readings taken with them automatical- ly account for body shadow effects. The cyl- inders were positioned such that the body shadow was that which would be cast by a person sitting squarely behind a desk with their line of sight perpendicular to the front edge of the desk. For some readings, however, the cylinders were turned through 45" to simulate the effect created by a person bodily shifting his or her torso and line of sight to
45" either side of the desk-centre line, (see
V E R T I C A L P A N E L A T B A C K OF W O R K S T A T I O N 2 5 . 4 2 5 . 4 2 5 4 2 5 . 4 r T T - - - W O R K S U R F A C E
.
N rw D I M E N S I O N S I N c mV E R T I C A L P A N E L A T B A C K O F W O R K S T A T I O N W O R K S U R F A C E D I M E N S I O N S I N c m Fig. 2. Location of test points.
WORK S U R F A C E %
gb
*
- -
Fig. 3. Location of test points.
V E R T I C A L P A N E L
A T B A C K O F
I
W O R K S T A T I O N
W O R K rn
D I M E N S I O N S I N ' t m
Fig. 4. Location of test points.
Fig.
7).
In this way the sensitivity of the CRF and ESI results t o observer orientation would be investigated.W O R K S U R F R C E
D I M E N S I O N S I N c r n
Fig. 5. Location of test points.
V E R T I C A L P A N E L A T B A C K OF W O R K S T A T I O N ? .I=
2
.=
.IPI
-
W O R K S U R F A C E-
D I M E N S I O N S I N c mFig. 6 . Location o f test points.
I
W O R K
I
S U R F A C E w Q u r n " N D I M E N S I O N S I N c m Fig. 7 . Location of test points.DESCRIPTION OF SYSTEMS APPRAISED (See Table 1 )
Systems A to E all incorporated task light- ing luminaires built under a shelf on the vertical panel at the back of each work station. In system F two luminaires were mounted in line under a shelf to one side of the work sta-
tion. Both systems G and H had movable
luminaires on a swivel arrangement. For E and F, measurements were also taken for horizon-
tal
surfaces a t right angles to the main horizontal desk area (marked with an asteriskFigure 1 0.86 Figure 1 0.92 Figure 1 0.87 Figure 1 0.47 Figure 1 0.68 Figure 1 0.77 Flgure 7 0 . 5 6 Figure 7 0.79 Figure 7 0.70 Figure 7 0.84 Figure 1 0.84 Flgure 1 0.84 Figure 1 0.82 Figure 7 0.85 Figure 2 0.82 Figure 2 Figure 2 0.78 Figure 2 Figure 3 0.98 Figure 3 1 . 0 0 Figure 3 0.98 Figure 3 0.81 Figure 7 0.97 Figure 5 0.61 Figure 4 0.79 Figure 6 0.88 Figure 6 0.74 Figure 6 0 . 8 5 Figure 6 0.74 Figure 6 0.79 Figure 1 0 . 9 1 Figure 1 0.96 2 j . 5 Figure 1 0.99 M I 4 032 N l Localized/ 588 General N 2 L o c a l i z e d / 185 ( ~ e n e r a l 550 0.1139 33.9 Figure 1 0 . 9 5 0 . 9 0 153 fl.811 21.5 Figure 1 0.95 0 . 9 1 Z i Z 0.800 17.2 Figure 1 0 . 9 3 0.90
in Table 1). For appraisal A to H ambient Systems J and K each incorporated a single
lighting was provided by ceiling-mounted luminaire in the work station itself which
ambient illumination; L and M free-standing indirect torcheres and N ceiling-mounted localized-general luminaires.
RESULTS
The main body of the results obtained from the appraisal are given in Table 1.
The number following the letter assigned to each appraisal indicates a modification to the basic system, for example, a change in lens, or simply t o distinguish between measurement of task illumination alone compared to task plus ambient lighting.
The second column in Table 1 indicates whether measurements were made on the combined task-ambient system or task or am- bient lighting alone with the corresponding illuminance given in column 3. By simple sub- traction, values for task illuminance can be calculated (column 4).
Values of ESI are tabulated for each appraisal but it is not possible to simply sub- tract to obtain data on task illumination alone because of the non-linear transformations in the derivation of ESI. Similarly, values of the CRF can only be listed as measured and no further calculations performed.
Column 7 contains the lamp wattage (excluding extra ballast wattage loss) for the task lighting alone; the higher values for J and
K are a result of the additional indirect light- ing function of these luminaires. However, the ballast wattage lost was taken into account when calculating the approximate power load- ings given in column 8. Interpretation of these loadings requires some caution. The values given are for power loadings as found "on- site" where the systems were appraised. A number of the lighting systems appraised were small sample systems making it difficult to de- termine an accurate representative figure for the power loading expected in an actual office space. The power loadings given must be considered therefore as indicative only.
The uniformity ratio (columns 1 0 and 11) is defined as the ratio of the minimum illumi- nance to the average illuminance within a given area. Two areas were considered; the task area is the shaded area in Figs. 1 t o 6 and the work surface the entire area of the horizontal desk surface. The ratio is employed to indicate the variation in illuminance within
these given areas. The British IES Code (1977) recommends that the ratio should normally be not less than 0.8 and this value is also used here as a criteria for acceptable uniformity.
The values given in Table 1 for illuminance, ESI and CRF refer to averaged data for each appraisal over the shaded area indicated in the figures. This corresponds to an area approx- imately 50 cm X 25 cm and is arbitrarily judged as the area most likely t o contain visual tasks demanding the most critical visual attention. Those measurements obtained at the six positions shown in Fig. 7 are all averaged to give the values shown in the table. The measurement area in this case is a triangle with apex at the observer with base length 78 cm and height 39 cm.
The measurements of luminance and reflec- tance are given in Table 2. The ratio of the surround luminance of the desk surface to that of the task (a "standard" white reflec- tance card) are calculated for comparison with recommended practice.
DISCUSSION OF RESULTS
Unlike illuminance measurements, it is not possible t o quantitatively separate task ESI and CRF values from the combined values for task plus ambient light by subtraction. Separate measurements must be performed for the two lighting systems. It is informative however to examine relative changes in these values within each appraisal and between dif- ferent appraisals. In addition, one learns how useful this particular appraisal procedure of "on-site" survey can be. The changes in the CRF indicate the effect on contrast whereas the changes in ESI the combined effect of contrast and light level.
Appraisals A, B
For appraisal By the ambient light
accounted for over 43% of the total illumi- nance on the work surface. The addition of task light to ambient light more than doubled the ESI (from 116 ESI t o 253 ESI) without improving the CRF. In A the addition of task light increased the ESI nearly eight times (from 53 ESI t o 405 ESI) and also improved the CRF by 13% (from 0.848 to 0.962). Thus for A, ambient lighting makes a small contri-
TABLE 2
Luminance and Reflectance
(cd/m2) (cd/m2)
Average Average Average Average
Reflectance of Reflectance of Luminance of Luminance of Surround Luminance Appraisal Horizontal Work Rear Vertical Horizontal Rear Vertical
Surface Panel Work Surface Work Surface Task Luminance
bution to ESI whilst for B the contribution is
C5
differ from Cl and C3 respectively in thatmore significant. for the former, appraisal measurements were
taken at the positions illustrated in Fig.
7,
Appraisal
C
whereasC1
andC3
followed the pattern of Table 3 gives more details of appraisalC.
Fig. 1.Lenses a! and
0
refer to acrylic lenses with dif- Referring to the values of illuminance, ESITABLE 3
Details of appraisal C
Appraisal Task lighting Ambient lighting
C1 Lens (Y 1 X 4 0 W lamp C2 Lens (Y 2 x 40 Wlamp 1 X 4 0 W lamp C3 Lens (Y 4 x 4 0 W lamp 1 X 4 0 W lamp C4 Lens (Y 1 X 4 0 W lamp C5 Lens (Y 4 x 40 W lamp 1 X 4 0 W lamp C6 Lens
/3
1 X 4 0 W lamp C7 Lens/3
4 X 4 0 W lamp 1 X 4 0 W lampeach of the C appraisals can be explored. The CRF altered very little from C1 through C7; the mean CRF equals 0.879 with a standard
deviation of o = T0.009. The uniformity ratio
is generally poor amongst the C appraisals (less than 0.8 and as low as 0.31) and explains the large apparent difference in task illumi- nance alone between C1 (528 lx) and C4 (960 lx) where only the measurement loca- tions were changed (see Table 3). Since the CRF is almost constant the changes in ESI are due solely t o the changes in illuminance level. Perhaps these measurements could be used by a designer t o lead him t o re-design the lumi- naires and their location t o improve the CRF as an energy effective method of improv- ing ESI. Note that under the lighting systems common to many offices a 1% increase in the CRF results in a 7% increase in ESI at the same illuminance level. The alternative method of increasing ESI, as is clearly appar- ent from appraisal C, is to raise the illumi- nance level. This, of course, could be achieved in an energy effective fashion if it were pos- sible to bring the lamps closer t o the task area without introducing excessive glare or lumi- nance ratios or detracting from the aesthetic appearance of the furniture.
Appraisal D
The ambient lighting in appraisal D was
a
combination of semi-indirect and indirect lighting producing a relatively high CRF
(0.941) but low light level (179
Ix).
Tasklighting was provided by mounting a bare fluorescent lamp under a shelf on the vertical panel at the rear of each work station. Refer-
ring to Table 1, it can be seen that the CRF
actually decreases upon the addition of task lighting. This is not surprising since the lamp is placed close to, or at, the specular reflec- tion angle, an apparently popular location for many of the systems studied. In 0 3 a prismat- ic lens was placed over the bare fluorescent tube which reduced the task illumination and did not improve the CRF; consequently the ESI was lower than for 0 2 (162 ESI com- pared to 215 ESI). 0 4 measurements are on the same system as 0 3 , but taken at different measurement locations. The D system showed good illuminance uniformity over the task area but a poorer distribution over the entire work surface.
Appraisal E
Uniformity improved when task lighting was added to the ambient lighting for apprais- al E (from 0.41 to 0.71). Here ambient light- ing was supplied by semi-indirect torcheres with task lighting at the rear vertical surface of the work station mounted under a shelf. Like D this task lighting location produces rather poor CRF and ESI (maximum CRF and ESI, 0.891 and 312 ESI respectively). Appraisal F
For appraisal F the task lighting came from one side of the work station with ambient lighting provided from an indirect luminaire built into the work station. Uniformity is excellent and the CRF values are close to 0.90. Comparing F2 and F1 it is immediately apparent that the main contribution of task illumination is to run off areas at positions 16-20 (see Fig. 3). The task light does little to illuminate the task area.
Appraisal G
Task lighting in G was from louvred movable luminaires clamped to the work sta- tion with ambient lighting provided by in- direct luminaires. The optimum position for the task light is left to the judgement of the
user. The measurements given in Table
1
showthat although there was poor uniformity of illuminance (less than 0.5 over the work sur- face) the CRF was high but ESI low because of insufficient illumination.
Appraisal H
In a similar operation t o G, system H allowed the user t o control the position of the task lighting luminaires. One task lamp was fixed a t the back of the work station with two others re-locatable on a horizontal axis at right angles t o the observer's viewing direc- tion. Incandescent lamps in the ceiling provided the ambient lighting which did not contribute significantly t o the illuminance on the work surface (80 lx) but on the other hand had no deleterious effect on the CRF (CRF = 0.955 for ambient lighting alone).
Appraisals H2 t o H 5 all have the same am- bient lighting conditions but differ in task lighting details. H 2 refers t o the entire task lighting system of one "back" lamp and two relocatable lamps; for H3 the back lamp only was lit; for H4 only the relocatable lamps were on and H 5 is similar to H4 except that the lens was removed from the two movable luminaires. The results in Table 1 demonstrate that the back lamp provided poor CRF (0.873) but good uniformity (with low ESI) on the task area. The movable lamps by them- selves, H4, have excellent CRF (0.989) with moderate uniformity. The combination, H2, retains the moderate uniformity of H4 but also gains improved CRF over H3 (0.948 t o 0.873). The removal of the lens in H 5 (com- pared with H4) shows a substantial improve- ment in ESI (619 ESI compared t o 486 ESI) and in uniformity (0.60 compared t o 0.53). Appraisals J, K
Appraisal J is an example of a combined task-ambient luminaire built into the work station. The excellent uniformity is accom- panied by moderate CRF and low ESJ. K is a similar system with ESI, CRF and uniformity close in value t o that of J.
Appraisals L, M
L and M are both examples of free-standing indirect luminaires. Both show excellent uni- formity with M exhibiting the superior CRF and ESI.
Appraisal N
N is the only appraisal of ceiling-mounted localized luminaires. As may be expected from a ceiling system, the uniformity is good. However, the CRF is poor for N1 (0.813). The conditions for N2 were similar t o those
for N1 except that a luminaire immediately in front of the desk and parallel to its centre- line was removed. Notice the lower power loading but higher CRC (0.890) and ESI (234 ESI compared with 154 ESI for N1) for appraisal N2.
Summary of results
The results in Table 2 can be evaluated in terms of current recommended practice in North America. The recommended surface reflectances of furniture and office machines and equipment is in the range 0.25 t o 0.44. Only appraisals A and J fall strictly within this range, with C, D, E, G, H, L and M all having higher reflectances and F and N values which are too low. The reflectance of walls should be in the range 0.40 t o 0.60. If the vertical surfaces of the furniture are regarded as walls then C, G and J are correct, A, B, D and E are too low and H just a little too high. The recommended luminance ratio be- tween the task and adjacent surroundings is in the range of
111 t o 113. Apart from F and N
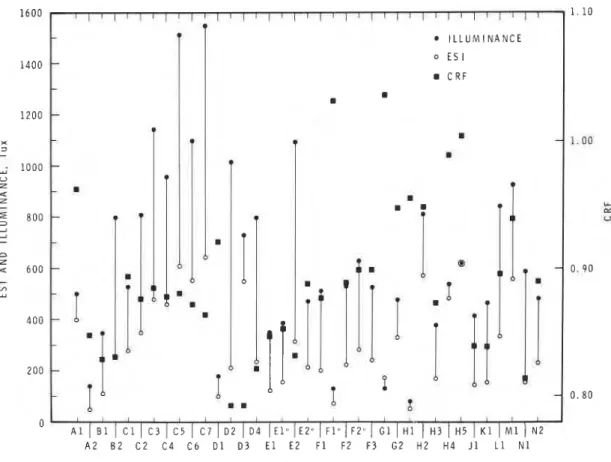
all the systems measured fell within this range. The task luminance is taken as the luminance of the standard white reflectance card (reflectance 0.80).Figure 8 summarizes the results for all of the 37 appraisals (13 basic systems). The large scatter in illuminance, ESI and CRF values is immediately apparent. No system achieved the IES recommended value of 750 ESI and of the 37 appraisals, only 1 3 had illuminance values equal t o or greater than 750 lx. CRF values varied from a maximum of 1.036 t o a minimum of 0.793. It is noticeable that the appraisals exhibiting high CRF generally gave illuminance values less than 750 lx (e.g. F l , GI, H4 and H5).
A common practice of using the ratio of ESI t o illuminance level (sometimes referred t o as the "lighting effectiveness factor") has been avoided as a figure of merit for the dif- ferent systems appraised. The ratio can be misleading, for instance when the CRF is greater than unity but ESI less than horizon-
tal illuminance. This situation arises from the method of calculation of ESI which uses a reflectance factor (range 0 t o 1 ) to convert an effective reference sphere luminance t o equivalent sphere illuminance but a luminance factor (range 0 t o infinity) to originally convert the illuminance t o luminance.
268 1 1 0 1 . 0 0 Y E U - 0 . 9 0 0 . 8 0 1 6 0 0 1 4 0 0 1 2 0 0 X 2 - ; 1 0 0 0 0 Z 4 Z
-
% 8 0 0 3 2 2-
n Z 4 6 0 0-
m Y 4 0 0 2 0 0 A 2 B 2 C Z C 4 C 6 D l D 3 E l E 2 F 1 F2 F 3 G 2 H 2 H 4 J 1 L 1 N 1 A P P R A I S A LFig. 8. Distribution of illuminance, ESI and CRF values.
Power loadings everywhere in the space a power loading for Column 7 of Table 1 lists the wattage for ambient lighting using general diffuse fluores- the task lighting alone. The majority of cent luminaires could be of the order of systems where the task lighting is built into 13.4 W/m2. If the office space is divided up the furniture require a single 40 W fluorescent such that there is one work station every lamp. Assuming such a lamp can provide the 8 . 4 m2 then the power loading for task light- correct quality and sufficient quantity of task ing alone would be (40 + 8*)/8.4 = 5 - 7 0 W/
'
illumination when combined with an ambient m2. The total power loading is then projected lighting system, providing 300 lx of illumina- a t 13.4 + 5.7 = 19.1 w(m2. This figure is 1tion for circulation and access, it is interesting within current Canadian guidelines [2] and is t o speculate on the power loadings that could deemed potentially energy-efficient when
1
be achieved in conventional offices. However, compared t o contemporary office lighting an accurate speculation along these lines relies power loadings. Of course the above values on good data on the use of space in modem will vary depending on the actual work sta- offices. tion area and the design of the ambient light- A recent Canadian survey [7] of one mil- ing system. However, compared with other lion square feet of office space containing ap- recent estimates [8] the values given tend t o proximately five thousand work stations be on the high side.reveals an average area for a work station of The use of power loadings in the evaluation 8 - 4 m2. The work station area is defined as of task-ambient lighting systems requires the space occupied by the office furniture some caution. Many manufacturers of task- plus the space required for access t o it.
Assuming that 300 lx is provided uniformly *8 W accounts for the ballast consumption.
I I I I T I ~ I I I I I I ~ ~ V I I O ~
-
~ ~ I ~ ~ ~ I ~ I I D I L L U M I N A N C E 0 ES I C R F m 1.
-
-
-
-
-
?-
. .
.I
: [
-.I
1
m ~ m = ~I
. .
;ll:[l
~ g1
I l l * ~
X
j1
]lo
-
o . ' ' ' ' l " ' I I I I t I A 1 I B 1/
C 1I
C 3I
C 5I
C 7I
D 2I
D 4I E ~
I E ~ " ]
F1' 1 ~ 2j
G 1I
H 11
H 3I
H 5I
K 1I
M 1I
N 2I
-
-
-.
J
1
'
t
.
- -,,1*
ambient lighting quite correctly promote their systems on the basis of low w/m2. It is also true that the power loading is invariant to the position of the furniture in a given space. However, if furniture containing task lumi- naires is relocated, its effectiveness in terms of the CRF and ESI in the task area can alter dramatically because of the non-linear addi- tion of the CRF and ESI of the ambient light- ing. Where no ambient lighting is installed in the ceiling the relocation of furniture is less
apt to result in large changes in ESI and the
CRF since it is only the proximity of differ- ent reflecting surfaces that will affect their final magnitudes.
A number of suppliers of task-ambient
lighting systems provide a template by which the luminaires for ambient light may be laid out in the ceiling to provide a uniform horizontal illuminance on the working plane. It is then assumed that the furniture, and its incumbent task lighting, can be installed any- where and still result in good ESI in the task
area. A basic understanding of the principles
of ESI leads one to conclude that this is an erroneous assumption. Perusal of Table 1 and
Fig. 8 illustrates quite dramatically the
separate qualities of task and ambient lighting and the significant changes in ESI and the CRF that can occur when they are combined. The use of task-ambient lighting systems in office spaces requires the lighting designer to reconsider the importance of the reflectances of vertical surfaces and their illumination. Wall reflectances recommended by the IES (North America) are based on a ceiling system giving an illuminance of approximately 1000 lx. If, in task-ambient installations, the ceiling system provides only 300 lx then large areas
of vertical surface (e.g. walls) will appear
quite dull resulting in a gloomy impression of the entire interior. Perhaps up t o 3w/m2
i
should be included in the total power loadingin task-ambient systems for wall lighting. In any event, some provisions for improving the brightness of vertical surfaces should be in- cluded in final loading figure.
1
CONCLUSIONSThe quantity and quality of the illumina- tion from the sample of task-ambient systems
investigated varied enormously. No system met North American recommended IES light- ing levels [9] in terms of ESI and only a small minority met the levels in terms of horizontal illuminance.
Although appraisals could not be per- formed under controlled photometric condi- tions, it was possible to observe how task and ambient lighting interact to produce the resul- tant values of illuminance, CRF and ESI. The photometric appraisal procedure employed was found to be convenient, reasonably quick and provided data producing consistent, sen- sible results.
The type of data collected in Tables 1 and
2 could provide a suitable basis for both users
and designers of task-ambient lighting systems to assess lighting quality. Illuminance, CRF, ESI, power loading, uniformity ratio and sur- face reflectances are all required to properly evaluate task-ambient lighting systems.
It is incorrect to assume that low ambient lighting levels have an insignificant effect in the quality of light at the work station. In addition, the low ambient light levels require that the reflectances of major vertical surfaces are well above the minimum recommended values. These surfaces should be separately illuminated and the resulting power loading included in the total w/m2.
The "contrast rendering factor" has recent- ly been evaluated as a figure of merit for dif- ferent lighting systems [ l o ] . The present results show the danger in using the CRF for this purpose since the light adaptation level is so important to visibility as can be examined through the separate effects of the CRF and illuminance on the final ESI value. The authors are therefore not surprised at the negative conclusion regarding the use of the CRF as a figure of merit found in this recent study [ l o ] .
It is the opinion of the authors that task- ambient lighting systems offer significant potential for power savings for lighting energy consumption and that there is ample room for better designed systems to improve the quali- ty and quantity of illumination in an energy- efficient manner. Furthermore, it is believed that with these improved systems it will be possible to comply both with the recent Canadian government recommendation of a
rent North American IES recommended illu- minance levels.
The paper has not considered the relative economic benefits or otherwise for the differ- ent task-ambient lighting systems nor inves- tigated the difficulties and cost in getting power t o the systems; these aspects have been discussed elsewhere [ 8 , 1 1 ]
.
ACKNOWLEDGMENTS
This paper is a contribution from the Divi- sion of Building Research, National Research Council of Canada, and is published with the approval of the Director of the Division.
REFERENCES
1 Building Operating Management, 25 ( 5 ) (1978) 36.
2 Measures for Energy Conservation in New Build- ings, Associate Committee of the National Build-
ing Code, NRC, Ottawa, Canada, 1978.
3 D. DiLaura and S. M. Stannard, J. Illum. Eng. Soc., 7 ( 3 ) (1978) 183.
4 CIE Publication No. 1 9 (TC 3.1).
5 P. Ngai, J. Illum. Eng. Soc., 7 ( 3 ) (1978) 177. 6 A . W. Levy, Light, Res. Technol., 10 ( 1 ) (1978)
19.
7 Public Works Canada, 1978, personal communica- tion.
8 H. B. Zackrison, Light. Des. A p p l . , 8 ( 4 ) (1978) 31.
9 ZES (North America) Lighting Handbook, 5th edn., 1972.
10 P. Boyce, Light. Res. Technol., 10 ( 2 ) (1978) 94. 11 Task lighting considerations, NECA Electrical
This publication is being d i s t r i b u t e d by the Division of Building R e s e a r c h of the National R e s e a r c h Council of Canada. I t should not be reproduced in whole o r in p a r t without p e r m i e s i o n of the original publisher. The Di- vision would b e glad to b e of a s s i s t a n c e in obtaining s u c h p e r m i s s i o n .
Publications of the Division m a y be obtained by m a i l -
ing the a p p r o p r i a t e r e m i t t a n c e ( a Bank, E x p r e s s , o r P o s t Office Money O r d e r , o r a cheque, m a d e payable t o the R e c e i v e r G e n e r a l of Canada. c r e d i t NRC) t o t h e N a t i o n a l R e e e a r c h Council of Canada, Ottawa. K1A OR6. S t a m p s a r e not acceptable.
A l i s t of all publication^ of the Division i s available and m a y be obtained f r o m the Publications Section, Division of Building R e s e a r c h , National R e s e a r c h Council of Canada. Ottawa. KIA OR6.

![[DOC] Cours Merise : le MCT avec exercices d’application | Cours merise](data:image/gif;base64,R0lGODlhAQABAIAAAP///wAAACH5BAEAAAAALAAAAAABAAEAAAICRAEAOw==)