HAL Id: hal-02879691
https://hal.archives-ouvertes.fr/hal-02879691
Submitted on 24 Jun 2020
HAL is a multi-disciplinary open access
archive for the deposit and dissemination of
sci-entific research documents, whether they are
pub-lished or not. The documents may come from
teaching and research institutions in France or
abroad, or from public or private research centers.
L’archive ouverte pluridisciplinaire HAL, est
destinée au dépôt et à la diffusion de documents
scientifiques de niveau recherche, publiés ou non,
émanant des établissements d’enseignement et de
recherche français ou étrangers, des laboratoires
publics ou privés.
Correlation between the physical structure of a
commercially formulated epoxy paint and its
electrochemical impedance response
Aurélien Roggero, Laura Villareal, Nicolas Caussé, Audrey Santos, Nadine
Pébère
To cite this version:
Aurélien Roggero, Laura Villareal, Nicolas Caussé, Audrey Santos, Nadine Pébère.
Correla-tion between the physical structure of a commercially formulated epoxy paint and its
electro-chemical impedance response.
Progress in Organic Coatings, Elsevier, 2020, 146, pp.105729.
OATAO is an open access repository that collects the work of Toulouse
researchers and makes it freely available over the web where possible
Any correspondence concerning this service should be sent
to the repository administrator:
tech-oatao@listes-diff.inp-toulouse.fr
This is an author’s version published in:
http://oatao.univ-toulouse.fr/26123
To cite this version:
Roggero, Aurélien
and Villareal, Laura
and Caussé, Nicolas
and
Santos, Audrey and Pébère, Nadine
Correlation between the physical
structure of a commercially formulated epoxy paint and its electrochemical
impedance response. (2020) Progress in Organic Coatings, 146. 105729.
ISSN 0300-9440
Correlation between the physical structure of a commercially formulated
epoxy paint and its electrochemical impedance response
Aurélien Roggero
a, Laura Villareal
a,b, Nicolas Caussé
a,*
, Audrey Santos
b, Nadine Pébère
aaCIRIMAT, Université de Toulouse, CNRS, France bPeintures Maestria, Pamiers, France
A R T I C L E I N F O
Keywords: Organic coating
Electrochemical impedance spectroscopy Glass transition
Barrier properties Molecular mobility
A B S T R A C T
In the present work, a commercial high solids epoxy-based paint used for the corrosion protection of steel was characterized by electrochemical impedance spectroscopy (EIS). The aim was to analyze the influence of water absorption on the physical structure of the paint, through the impedance data analysis. First, the water uptake was followed by gravimetric measurements on free-standing films as a function of the exposure time to a 0.5 M NaCl solution. Gravimetric measurements indicated a mass loss, linked to a release of a plasticizer from the formulation. This compound was dosed in the NaCl solution. The water volume fraction was also determined from the high-frequency part of the impedance diagrams, employing a linear rule of mixtures. The water fraction values obtained from the two methods were in acceptable agreement. The glass transition temperature (Tg) was
determined by differential scanning calorimetry for the dry coating as well as for the coating after different immersion times in the NaCl solution. The use of the dielectric permittivity formalism allowed the mean re-laxation times to be obtained from the impedance data analysis. The real part of the electrical conductivity was also considered. The variation of these parameters values as a function of the exposure time to the NaCl solution, was correlated with the Tgvariation. They accounted for plasticization at the beginning of immersion (water
uptake) and antiplasticization for longer exposure times (plasticizer release). For the studied system, it was possible to extract parameters representative of the molecular mobility from the impedance spectra analysis and to link them to the modification of the coating’s physical structure.
1. Introduction
Organic coatings are commonly used to protect metal surfaces against corrosion because they act as an efficient barrier by slowing down the diffusion of aggressive species (particularly water) towards the metal/paint interface. Their barrier properties are linked to various “intrinsic” parameters such as the polymer matrix, the fillers, the pig-ments and additives, the solvent and the coating thickness. It is ac-knowledged that the water absorption into coatings is an important topic [1], because water penetration is an initial step in their de-gradation process. The water uptake is often assessed by gravimetric measurements [2,3], made either on metal-supported coatings or on free-standing films [4], and/or by electrochemical impedance spectro-scopy (EIS) [5–10]. Even if several papers have underlined disagree-ment between the water uptake values obtained from these two methods, they are still commonly used to compare the water uptake into organic coatings [11]. The water uptake generally leads to a plasticization effect of the polymeric network, which results in a
decrease in the glass transition temperature (Tg) with increasing water
content [12]. However, the coating physical structure modifications induced by the water absorption are rarely discussed in the literature, with regard to the electrochemical impedance response. Recently, by performing EIS at different temperatures, Roggero et al. [13,14] have evidenced the signature of the molecular mobility on the impedance response of an epoxy varnish. They showed that water uptake was re-sponsible for both an important shift of the manifestation of the mo-lecular mobility towards lower temperature and an increase of the dc conductivity by three orders of magnitude compared to the dry varnish. These previous studies pointed out the importance to take into account the molecular mobility of a polymer-based paint when assessing their barrier properties.
The aim of the present work was to investigate the effect of the water absorption on the physical structure of a commercial high solids epoxy-based paint deposited on a carbon steel substrate using EIS. This paint corresponds to the complete formulation of the epoxy varnish previously studied [13,14]. First, the evolution of the impedance
https://doi.org/10.1016/j.porgcoat.2020.105729 ⁎Corresponding author.
= × m m m m m 100 0 1 0 0 (1)
2.3. Differential scanning calorimetry
Differential scanning calorimetry (DSC) measurements were carried out with a DSC 204 Netzsch apparatus under inert atmosphere (N2).
The coating sample (approximately 15 mg) was deposited on pierced aluminium crucibles. Two heating ramps from −40 °C to 190 °C were successively performed with a heating rate of 10 °C/min. The cooling ramps were ran at the same heating rate but were not considered in the present work. The glass transition temperature (Tg) was measured at
the maximum of the derivative of the thermograms. The uncertainty on the Tg determination, including repeatability on three samples, was
evaluated for different ageing conditions at ± 2 °C. The Tgvalues of the
dry coating as well as those of the coating after different immersion times in the NaCl solution were compared.
2.4. Electrochemical impedance spectroscopy
Impedance measurements were performed with a conventional three-electrode cell, in which the coated sample served as the working electrode. A saturated calomel electrode and a graphite rod were used as reference and counter electrode, respectively. The working electrode surface area was 36.3 cm². All tests were performed in a 0.5 M NaCl solution. The electrochemical cell was open to air and was kept at room temperature. Electrochemical impedance measurements were carried out using a Gamry REF600 apparatus. The impedance diagrams were obtained, for exposure times ranging from 2 h to 24 weeks, under po-tentiostatic conditions, at the open circuit potential, over a frequency range of 100 kHz to 0.01 Hz with eight points per decade, using a 30 mV peak-to-peak sinusoidal voltage perturbation. The electrochemical cell was placed in a Faraday cage. The impedance diagrams were shown for a single coating but they were typical of the studied system. The error bars reported in the figures accounted for at least three different trials. 3. Results and discussion
3.1. Impedance measurements and water uptake
The coated steel was immersed in a 0.5 M NaCl solution and the impedance spectra were recorded for increasing immersion times. Some examples of the impedance spectra, in Bode coordinates, are shown in
Fig. 1. First, it should be pointed out that for the entire duration of the
measurements, there is no evidence of corrosion on the coating surface. The impedance diagrams are characterized by a single time constant. A transition from a resistive behaviour at low frequency (constant
Fig. 1. EIS diagrams (Bode coordinates) obtained on the epoxy coating after
2 h, 24 h, 4 and 24 weeks of immersion in a 0.5 M NaCl solution.
response of the coating, immersed in a 0.5 M NaCl solution, was fol-lowed over immersion time (up to 24 weeks). In parallel, gravimetric measurements on free-standing films were performed. Then, from dif-ferential scanning calorimetry (DSC) measurements, the glass transition temperature (Tg) was determined for the dry coating as well as for the
coating after various immersion times in the NaCl solution. The EIS data were analyzed through the use of the dielectric permittivity and elec-trical conductivity formalisms to investigate the influence of the water uptake on the molecular mobility and on the charge transport processes of the epoxy network.
2. Experimental
2.1. Coated samples
S235JR steel plates (200 mm × 100 mm × 3 mm) were used as substrates. The steel has the following chemical composition: C = 0.17; Mn = 1.4; P = 0.035; S = 0.035; N = 0.012; Cu = 0.55 and Fe to the balance. Before the coating application, the samples were sand-blasted presenting an average roughness (Ra) of 8 ± 1 μm.
A two-component high-solids (90 wt% solid) paint was manu-factured by Peintures Maestria (Pamiers, France). It consisted of an epoxide as base and a mixture of polyamidoamines as hardener, along with fillers (talc, barium sulphate, silica) and pigments (titanium di-oxide) adding up to a total pigment volume concentration (PVC) of 20%. The ratio of the pigment volume concentration to critical pigment volume concentration (PVC/CPVC) was 0.55. Additives and diluents were also added, to confer proper rheological properties to the fabri-cation. The coating was deposited by air spraying onto the steel surface. After curing at room temperature for 21 days, the coating thickness was measured at 200 ± 10 μm by an ultrasonic probe.
2.2. Gravimetric experiments
The mass variation was measured at room temperature (20 ± 2 °C) on free-standing films. The films have the same composition and curing conditions than the attached coating. They were deposited on a non-adherent substrate to be easily removed. Each coating sample was weighed on a Sartorius balance with a precision of 10−5 g before
im-mersion in a 0.5 M NaCl solution. Samples were periodically removed from the NaCl solution. Water excess from the coating surface was re-moved with a filter paper. The samples were weighted and immediately re-immersed in the NaCl solution. The sample mass before and after immersion are noted m0 and m1, respectively. For each immersion time,
at least eight samples were weighed to obtain an average value and a statistical uncertainty was estimated by means of the Student’s law. The mass variation was calculated for each exposure time as:
impedance modulus) to a capacitive behaviour at high frequency (de-creasing power law of frequency) can be observed. This time constant is classically associated to the electrical response of the wet coating, modelled by a non-ideal RC circuit [15].
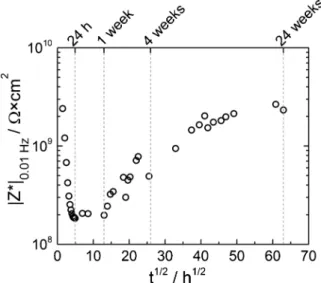
The low-frequency impedance modulus (at 10 mHz) was extracted from the resistive plateaus and plotted as a function of immersion time
inFig. 2. At the beginning of immersion, the low-frequency impedance
modulus is about 2 × 10⁹Ω cm2. This value decreases by about 1
decade during the first 24 h of immersion, then, it stabilizes between 24 h and 1 week. After that, an unusual continuous increase of the impedance modulus is observed for increasing immersion times. This unexpected behaviour has been previously observed in the case of waterborne systems and attributed to a complementary process occur-ring in the film formation (coalescence of the polymer particles acti-vated by the immersion in an electrolytic solution [16–18]).
To further analyze this anomalous behaviour, gravimetric tests were performed to follow the mass variation ( m m/ 0as in Eq.1) of the
free-standing films during immersion. The data are reported in Fig. 3. During the first 24 h of immersion, the coating mass increases of about 1.2 wt% which is attributed to the water penetration into the film.
Contrary to classical water uptake profiles [1] there is no stabilization or further increase for longer immersion times. Indeed, after 24 h, the sample mass decreases linearly with the square root of the immersion time. The decrease is faster between 24 h and 4 weeks (–0.055 wt% h−0.5) than between 4 and 24 weeks (–0.026 wt% h−0.5). Fredj et al.
[19,20] have observed similar features with gravimetric measurements. They attributed the mass decrease to a lixiviation process of an organic component of the coating.
The electrolytic solution was analyzed to quantify a possible leaching or release of coating components due to the water penetration into the coating. Benzyl alcohol, an aromatic alcohol present in the hardener composition as a compatibilizer with the epoxy resin, was identified and dosed by headspace gas chromatography/mass spectro-scopy. Other components, such as retained solvent, might also leach out from the coating during immersion, but their concentrations in the electrolytic solution were considered as negligible. In the rest of this study, the term plasticizer will be used to refer to benzyl alcohol for the sake of simplicity and to emphasize its effect on the coating’s proper-ties. The data, converted in a release mass percentage referring to the initial mass, m0, of the dry coating, are reported inTable 1. The amount
of released plasticizer continuously increases with immersion time, except for 8 weeks for which a decrease is observed. The lower amount of released plasticizer in the NaCl solution after 8 weeks could be ex-plained by a loss of the plasticizer due to volatilization, degradation or adsorption on the cell wall.
Thus, the total mass variation (Fig. 3) is the combination of water uptake (mass increase) and plasticizer release (mass decrease). The water uptake ( mwater) was calculated as
= +
mwater mtotal mplasticizer (2)
where mtotalis the measured mass variation of the immersed coating
(Fig. 3) and mplasticizeris the mass of released plasticizer (Table 1). The
water mass fraction, determined from gravimetric measurements, cor-rected from the plasticizer release, is shown inFig. 4, related to the mass of the coating (weight percent, wt%).
The water fraction increases up to 2.0 wt% during the first week of immersion, with a rapid increase (1.5 wt%) during the first 24 h. This value is in agreement with other studies on epoxy coatings [3,21–23]. After 1 week, the water fraction stabilizes due to the coating saturation. It is also worth noting that after 1 week, even if the plasticizer release continued, the water fraction was relatively stable. This would mean that water and plasticizer do not occupy the same sites in the polymer network and water does not replace the plasticizer.
The water volume fraction was also determined from the high-fre-quency part of the EIS spectra. For that, the complex impedance data were converted in term of complex dielectric permittivity
= + i
*( ) ( ) ( )thanks to Eqs.(3),(4)and(5).
= + Z C Z Z '( ) ( ) ( ( ) ( ) ) v '' ' 2 '' 2 (3)
Fig. 2. Impedance modulus at 10 mHz as a function of immersion time in a
0.5 M NaCl solution.
Fig. 3. Mass variation of the coating as a function of immersion time in a 0.5 M
NaCl solution. The error bars corresponding to the statistical uncertainty are smaller than the symbol size.
Table 1
Plasticizer amount released from non-supported films immersed in a 0.5 M NaCl solution, normalized to the initial weight of the dry film.
Immersion time Normalized amount of
released plasticizer (wt% of dry paint) 0 h 0.00 10 h 0.16 24 h 0.28 48 h 0.38 1 week 1.37 2 weeks 1.53 4 weeks 1.96 8 weeks 1.27
= + Z C Z Z ''( ) ( ) ( ( ) ( ) ) v ' ' 2 '' 2 (4) = C A l with v v (5)
where ( ) is the real (or capacitive) and ( ) the imaginary (or dissipative) parts of permittivity, is the angular frequency of the applied voltage andCvthe capacitance of the equivalent vacuum-filled
(vis the vacuum permittivity) parallel plate capacitor formed by two
electrodes of area A (here, the area of the EIS cell) separated by the distance l (here, the coating thickness). For each immersion time, a rule of mixtures between the water and the coating can then be applied using ( )to determine the water volume fraction. Assuming that the high-frequency response is associated to the immersed coating, the permittivity value at the highest measured frequency coating(100 kHz)is used for the calculation. It is equivalent to a vertical extrapolation on the complex-capacitance diagrams in the graphical method previously described [11].
First, a simple linear 2-phase rule of mixtures [8,11] taking into account the coating (including polymer matrix, fillers and additives) and absorbed water was applied to the high-frequency EIS data to calculate the water volume fractions, waterv ( )t, as in Eq. 6. A volume to
mass fraction conversion was then applied to waterv ( )t by means of Eq.
7. The obtained water mass fraction, mwater( )t, is reported inFig. 4.
= +
t t t
( ) ( ). ( ).
immersed coating waterv water dry coatingv dry coating
' ' ' (6) = + t t t t ( ) ( ) . ( ) . (1 ( )) . water m waterv water water v
water waterv dry coating (7)
where waterv ( )t and dry coatingv ( )t are the volume fractions of water and
dry coating, water and dry coatingtheir respective relative permittivities, water and dry coating their respective densities. The water permittivity, water, was taken as a constant value of 80 [24]. The dry coating
per-mittivity dry coating 4.6was determined at timmersion= 0, using a linear extrapolation during the first immersion times (typically the first 12 h). The values of waterm ( )t derived from the 2-phase rule of mixtures
reach a saturation plateau in the vicinity of 1 wt%. While they share the same order of magnitude with the gravimetric measurements, they are approximately two times smaller. As the plasticizer release was taken into account to correct the gravimetric measurements, but neglected in Eq. 6, a 3-phase rule of mixtures was derived (Eq. 9). This makes sense
because the plasticizer has a higher permittivity than the dry coating, and its volume fraction decreases due to its release. Therefore, the 3-phase rule of mixtures involves the dry coating, the plasticizer release and the water uptake. For the sake of simplicity, this 3-phase rule of mixtures can be split in two 2-phase rules of mixtures. The first one focuses on the plasticizer release and leads to the evaluation of the dry permittivity of the coating minus the released plasticizer (Eq. 8), and allows estimating the dry coating permittivity, dry coating ( )t, which now
depends on immersion time (as opposed to Eq. 6 where it is constant).
= +
t t t
( ) ( ). ( ).
dry coating vpolymer polymer plasticizerv plasticizer
' ' '
(8) where vpolymer( )t and polymer are respectively the volume fraction and
relative permittivity of the dry coating taking into account the released amount of plasticizer.
Inserting Eq. 8 into Eq. 6 leads to the determination of waterv ( )t by a
3-phase rule of mixtures by means of Eq. 9, which is then converted to
t ( ) water m using Eq. 7. = t t t t ( ) ( ) ( ) ( ) water
v immersed coating dry coating water dry coating
' '
' ' (9)
where immersed coating( )t is the permittivity measured by EIS at a given
immersion time, water is a constant and dry coating( )t is calculated by
means of Eq. 8.
The water mass fraction obtained with the 3-phase rule of mixtures by using Eq. 9 is reported inFig. 4. When the plasticizer release was taken into account in the rule of mixtures, a better agreement between EIS and gravimetric measurements was observed, but the water mass fraction remained lower than that obtained from gravimetry. Given the fact that behind any rule of mixtures lies the (rarely confirmed) as-sumption that there is no interaction between the two phases, a perfect agreement between EIS and gravimetry would be incidental. In this context, the agreement between EIS and gravimetry observed inFig. 4
is satisfactory. The present study confirms that applying linear rules of mixtures to EIS data, although being an imperfect approach, can lead to acceptable estimations of the water fraction, and that these rules can be refined to account for additional phenomena that influence the water fraction (plasticizer release, in the present case).
3.2. Physical structure evolution
The coating was characterized by DSC measurements to investigate the modification of the physical structure of the polymeric network (i.e. glass transition that is related to macromolecular chains mobility) ac-cording to the immersion time in a 0.5 M NaCl solution. Thermograms obtained during the first heating ramp are shown in Fig. 5a for in-creasing immersion times. The so-called “dry sample” corresponds to the non-immersed coating. InFig. 5b, for comparison, the first and the second ramps are shown for the dry coating and for an immersed sample (24 weeks in the NaCl solution).
The dry sample exhibits an endothermic baseline change (inflection at 53 °C). It corresponds to the glass transition temperature of the polymeric network. The endothermic peak superimposed to the Tgis
due to the “recovery” of the physical ageing enthalpy [25,26]. Physical ageing is associated with the instability of amorphous materials in the glassy state (non-equilibrium state) and was observed in various epoxy systems [27,28]. In the present case, physical ageing occurs during the end of the curing step, when the Tgbecomes higher than the storage
temperature (room temperature). In this temperature region, the loca-lized molecular mobility in the polymer network allows it to reach configurations of low enthalpy with less excess volume from inefficient packing. Above Tg(Fig. 5b), the baseline is not perfectly flat, probably
due to different low intensity thermal events, such as residual cross-linking and release of residual solvents or volatile substances. The second ramp (Fig. 5b) exhibits a baseline change (inflection at 56 °C), attributed to the Tgwith no physical ageing due to the first heating
Fig. 4. Water mass fraction calculated from gravimetric measurements, 2- and
ramp above Tg(rubbery state). A small intensity peak can be noticed in
the [120; 160] °C temperature region: it shows that the first heating ramp up to 190 °C is not enough to evaporate all the solvents or vola-tiles substances from the coating.
Immersion in water significantly modifies the thermogram of the coating. From 2 h, a large endothermic peak centred around 80–100 °C can be noticed, characteristic of the evaporation of absorbed water. As the water evaporated during the first heating ramp, this peak is no longer observed on the second ramp. During the first hours, the pene-tration of water in the coating induces an increase of the water eva-poration peak area and a decrease of the Tg. The water plasticizes the
polymer network and increases the molecular mobility [29]. The in-tensity of the physical ageing also decreases rapidly and disappears after 24 h (Fig. 5a). For longer immersion times, the peak area of the water evaporation stabilizes but Tgincreases again, and the physical
ageing peak, superimposed on the Tg, reappears and grows up.
From 1 week of immersion in the NaCl solution, an endothermic peak at 150 °C can be seen on the first DSC ramp and its area increases
with the immersion time (Fig. 5a). It is interesting to note that the baseline changes before and after the peak, characteristic of a change in the sample weight and/or the specific heat of the sample. This peak can reasonably be attributed to the evaporation of the plasticizer during heating. For the dry system or for short immersion times, this eva-poration peak was difficult to detect on the first ramp because the evaporated plasticizer quantity is low and it is convoluted with other thermal events (residual cross-linking and release of residual solvents or volatile substances). As previously mentioned for the dry system
(Fig. 5b), the peak is detected on the second ramp for short immersion
times (up to 96 h) because of the evaporation of remaining plasticizer during the second heating. The water penetration into the coating probably induced partial plasticizer solubilization which increases the evaporation peak area during the first heating (the plasticizer evapo-rates more easily). After 8 weeks, it is no more detected on the second heating ramp, indicating that all the plasticizer has left the coating. This can be seen inFig. 5b for 24 weeks of immersion.
The Tgvalue, determined at the inflection point of the DSC
ther-mogram, is reported onFig. 6as a function of immersion time. It was considered that the low extent of physical ageing did not affect sig-nificantly the Tgvalue.
After 24 h of immersion, Tgdecreased by around 20 °C and reached
a minimum of 37 °C. From that time onwards, Tgslowly increased back
towards its initial value of 54 °C, which was reached after approxi-mately 20 weeks of immersion in the NaCl solution. This behaviour is quite similar to that of the gravimetric measurements (Fig. 3), and can be understood under the light of polymer plasticization. Over the first 24 h of immersion, water sorption is responsible for both the mass uptake (Fig. 3) and the decrease in Tg(Fig. 6). The second, much slower
stage, characterized by a mass loss and an increase in Tg, can also be
accounted for in terms of polymer antiplasticization. As the plasticizer leaches out of the coating, and does not seem to be replaced by water
(Fig. 4), inter and intramolecular physical bonds are therefore allowed
to form. Such bonds, at the core of the glass transition in polymers, restrict the molecular mobility and macroscopically lead to an increase in Tg. It should be noted that the initial enhancement of molecular
mobility as a result of water plasticization could allow the poly-merization reaction to a further extent (residual crosslinking that was not achieved in the drying step). However, the absence of a significant exothermic peak on the first DSC heating ramp for the dry sample
(Fig. 5b) and the limited (< 10 °C) increase in Tg observed in the
second heating ramp both suggest that the residual crosslinking is negligible.
Fig. 5. (a) DSC thermograms obtained on the coating after various immersion
times in a 0.5 M NaCl solution (1st ramp at 10 °C/min), (b) two consecutive heating DSC thermograms (10 °C/min) for the dry coating and after 24 weeks of immersion in a 0.5 M NaCl solution.
Fig. 6. Glass transition temperature (first heating ramp) of the coating as a
3.3. Analysis of the EIS results in light of the physical structure evolution and correlation with charge transport
In the previous two sections, the effect of immersion on the coating’s physical structure was established by referring to the plasticization phenomenon in polymers. From that perspective, the EIS results were analyzed, with an approach previously described [13,14]. This meth-odology consists in converting the raw impedance data to intensive, material intrinsic properties: namely the dielectric permittivity (Eqs.3
to 5) and the electrical conductivity formalisms (Eq. 10) [30]. Such data representations exacerbate the coating’s response, provided that the measured impedance does not have any contribution of electrochemical nature. In the present work, the impedance spectra (Fig. 1) display the characteristic signature of a defect-free coating: no Faradaic contribu-tion can be detected in the spectra. For the sake of clarity, the con-ductivity formalism will be analyzed first, prior to the permittivity formalism. The purpose of using Eq. 10 was to emphasize charge transport processes at low frequencies, which generally take the form of frequency-independent plateaus. The obtained conductivity spectra are reported inFig. 7, at the same four immersion times as inFig. 1.
=
( ) v ''( )
' (10)
The conductivity spectra (Fig. 7) look like a symmetrical image of the impedance modulus spectra (Fig. 1), but they are normalized to the sample thickness and studied area. They display frequency-independent plateaus at low frequencies and power laws (with exponents close to 1) at higher frequencies. Such a shape corresponds to the “universal” re-sponse of disordered dielectric materials [31]. From the frequency-in-dependent plateaus, the direct-current conductivity, σ′dc taken at 10 mHz, was determined and plotted as a function of immersion time in
Fig. 10c and will be discussed later.
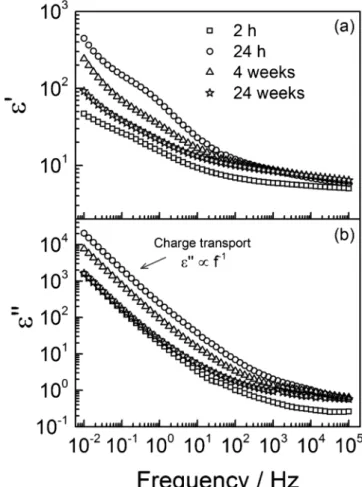
The impedance spectra inFig. 1converted to the complex dielectric permittivity formalism (thanks to Eqs.3to 5) are reported inFig. 8. The real part of the permittivity (Fig. 8a) features recognizable steps in the [0.1–10] Hz range. Such a step could be the signature of a dielectric relaxation involving the mobility of specific molecular units found in the polymer. It is generally accompanied by a peak in the imaginary part, as a consequence of the energy losses due to the mobility. At a given temperature, a dielectric relaxation happens around a (mean) relaxation time, τ, representative of the relaxing unit size. The latter are involved in the dielectric manifestation of the glass transition (α-mode). As detailed previously [14], in the case of EIS spectra, this peak is deeply buried in the contribution of water uptake to the charge trans-port phenomena, as can be seen inFig. 8b. There are several experi-mental ways to overcome this kind of problems to resolve the ε″ peak
(by using insulated electrodes [32], not applicable in EIS) as well as analytical methodology, through the use of the Kramers–Kronig rela-tions, for instance. Applying these relations to ε′ theoretically leads to a
conduction-free ε″. Numerical methods are available to compute the
integral forms of the Kramers–Kronig relations [33], but in the present work, a convenient yet accurate approximation [34] was used (Eq. 11). As an example, the ε″derivspectrum after 1 week of immersion is pro-vided inFig. 9. = ( ) 2 ' ln( ) deriv'' (11)
After applying the Kramers–Kronig relations approximation, the loss peaks associated with the real permittivity steps become visible (Fig. 9). They are still convoluted with some conductivity contribution origi-nating from the increase of ε′ at low frequencies (Fig. 8a) which is most likely due to the ionic nature of charge transport in this system and the associated electrode polarization effect [35]. Nevertheless, the spectra are sufficiently resolved to be fitted, hence allowing the determination of relaxation times. A combination of an Havriliak–Negami relaxation [36] and a conductivity term [37] (Eq. 12) was used to fit the spectra. As an example, the result of the imaginary permittivity spectrum after 1 week of immersion with Eq. 12 is displayed inFig. 9.
= + + i i ( ) (1 ( ) ) s H N dc v n * H N H N (12)
where αH–Nand βH–Nare shape parameters, τH–Nthe mean relaxation time, σdcthe direct-current conductivity and n the exponent for the low-frequency dispersive character of conductivity. It is worth noting that in Eq. 12, σdc is seen as an adjustable parameter only related to the Fig. 7. Real part of the electrical conductivity spectra obtained from the EIS
measurements after various immersion times in a 0.5 M NaCl solution.
Fig. 8. (a) Real part and (b) imaginary part of the coating’s dielectric
permit-tivity after various immersion times in the 0.5 M NaCl solution. The original data are the EIS measurements displayed inFig. 1.
residual conductivity contribution that was not “removed” by applying the Kramers–Kronig relations (as opposed to the conductivity displayed
inFig. 10c, obtained from the unmodified ε″ instead of ε″deriv).
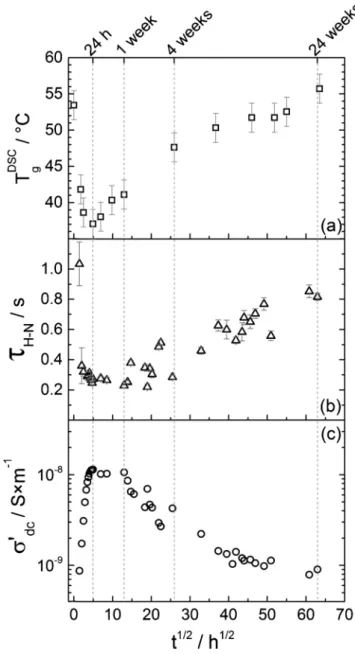
The relaxation time, τH–N, is the main parameter looked after in the present work, as it is a marker of the coating’s glass transition from a dielectric perspective. The Havriliak–Negami function (Eq. 12) involves two shape parameters, αH–Nand βH–N, that respectively broadens and asymmetrizes the peak, as compared to an ideal Debye relaxation. A Debye relaxation, often found with small glass forming molecules, in-volves a unique relaxation time associated with a single relaxing unit, while a broadened relaxation is generally ascribed to a distribution of relaxation times. Such a distribution is associated with multiple en-vironments surrounding the relaxing unit (polymer chain segments in the case of an α-mode), leading to a mean relaxation time. The re-laxation times obtained from the permittivity-converted EIS data at various immersion times in the NaCl solution are reported inFig. 10b, as well as the calorimetric glass transition temperature (Fig. 10a) with a common immersion time axis. The real part of the electrical con-ductivity, σ′dctaken at 10 mHz, is also represented inFig. 10c.
The dielectric relaxation times, τH−N, and calorimetric Tgshare a
very similar trend with respect to immersion time. The short-term water uptake-induced plasticization explanation is consistent with the initial decrease in relaxation times. As these are a marker of the molecular mobility, they are sensitive to any process that influences. In other words, if the relaxation of polymer sequences is made easier, by a plasticization process or by increasing the temperature, it happens more quickly (τH−Ndecreases). At longer immersion times, when the plasti-cizer slowly leaches out of the coating, the reduced mobility leads to a slower dielectric relaxation, hence the increase in relaxation times. In
Fig. 10b, the relaxation time points are more scattered than the
ca-lorimetric Tgones (Fig. 10a). This is very likely due to temperature
variations of up to several Celsius degrees observed in the lab where the EIS measurements were performed. They originate from morning vs afternoon cycles, seasonal changes over the course of the study, air conditioner starting or stopping. Because the molecular mobility of polymers highly depends on temperature, the relaxation times are very sensitive to small temperature changes. As an example, with that par-ticular polymer network an approximately 40% decrease in the re-laxation times was reported when raising the temperature from 20 to 25 °C [14]. This is a matter that does not attract a lot of attention in EIS studies of polymer-based coatings, but it can significantly influence the outcome of room temperature studies over long immersion times. On the other hand, the temperature is controlled in a DSC oven by a dry nitrogen flux, so that the outcome of the measurement is not
significantly affected by the external ambient conditions.
Similarly to the τH−Npoints (Fig. 10b), the σ′dcones (Fig. 10c) are scattered, most likely due to room temperature fluctuations. The charge transport processes are enhanced during the first day of immersion and
σdcreaches a maximum around 10−8S/m, one decade above the first value measured around 10–9S/m after 2 h of immersion, and two
dec-ades above the extrapolated value at zero time (∼1.5 × 10⁻¹⁰S/m).
After one week of immersion, σ′dcstarts decreasing back to its initial value (reached after approximately 20 weeks). This behaviour can once again be accounted for by the structural evolution that the coating undergoes upon immersion, because the low-frequency charge trans-port processes in epoxy networks are generally governed by the mole-cular mobility associated with the glass transition [38–40] (that was confirmed in the case of the isolated epoxy matrix of the presently studied coating [13]). The increase in molecular mobility associated with the glass transition due to the water-induced plasticization process results in an enhancement of charge transport processes. Conversely, the molecular mobility hindrance caused by the plasticizer leaching process at longer immersion times results in a decrease in the low-Fig. 9. Havriliak–Negami (with a conductivity term) fit of the derivative
ima-ginary part of the dielectric permittivity after 1 week of immersion in a 0.5 M NaCl solution. The relaxation associated with the glass transition is represented in dotted lines and the conductivity contribution in dashed lines.
Fig. 10. Evolution of (a) the calorimetric Tgas measured by DSC, (b) the
re-laxation time of the dielectric manifestation of the glass transition as measured by EIS and (c) the low-frequency electrical conductivity from EIS measure-ments, as a function of immersion time in a 0.5 M NaCl solution.
4. Conclusions
A commercial high solids epoxy-based paint used for the corrosion protection of steel was characterized by electrochemical impedance spectroscopy (EIS). First, the water uptake was studied for the coating immersed in a 0.5 M NaCl solution using EIS (supported films) and gravimetry (free-standing films). Gravimetric measurements revealed a mass loss attributed to the leaching of a plasticizer. The plasticizer concentration in the NaCl 0.5 M solution was determined as a function of the exposure time. The mass fraction of water uptake was corrected by taking into account the plasticizer release. The water volume frac-tion was also calculated from the dielectric permittivity values, ex-tracted from the impedance data. A linear 3-phase rule of mixtures was used which involved the dry coating, the absorption of water and the plasticizer release. The water volume fraction profiles obtained from these two methods were in qualitatively good agreement. The slight difference observed could reasonably be attributed, in the one hand, to the simplifying assumptions in the equations to calculate the water volume fraction from the EIS results and, in the other hand, to the fact that EIS was performed on supported films and gravimetry on free-standing films.
From differential scanning calorimetry (DSC) measurements, a de-crease and then an inde-crease of the glass transition temperature (Tg) was
observed with the immersion time in the NaCl 0.5 M solution, attrib-uted to the water uptake (plasticization) and to the plasticizer leaching process for longer immersion time (antiplasticization). The use of the dielectric permittivity formalism allowed the impedance data to be analyzed from the molecular mobility standpoint. Mean relaxation times associated with the dielectric manifestation of the glass transition (in other words, markers of the molecular mobility) were obtained from EIS data. A very good agreement was found between the evolutions of i) Tg, ii) the mean relaxation times and iii) the dc conductivity values,
with respect to immersion time in the NaCl solution. This lead to the conclusion that the water uptake and plasticizer leaching processes significantly influence the physical structure which, in these epoxy systems, governs the barrier properties.
Data availability
The raw/processed data required to reproduce these findings cannot be shared at this time as the data also forms part of an ongoing study. CRediT authorship contribution statement
Aurélien Roggero: Writing - original draft, Investigation, Conceptualization, Methodology, Formal analysis, Visualization. Laura Villareal: Investigation, Conceptualization, Visualization, Formal ana-lysis. Nicolas Caussé: Writing - original draft, Conceptualization, Methodology, Validation, Supervision. Audrey Santos: Conceptualization, Resources, Validation, Writing - review & editing, Supervision. Nadine Pébère: Conceptualization, Methodology, Validation, Writing - review & editing, Supervision, Project adminis-tration.
Declaration of Competing Interest
The authors declare that they have no known competing financial interests or personal relationships that could have appeared to influ-ence the work reported in this paper.
References
[1] G.K. Van Der Wel, O.C.G. Adan, Moisture in organic coatings - a review, Prog. Org. Coat. 37 (1999) 1–14,https://doi.org/10.1016/S0300-9440(99)00058-2. [2] P. Nogueira, C. Ramírez, A. Torres, M.J. Abad, J. Cano, J. López, I. López-Bueno,
L. Barral, Effect of water sorption on the structure and mechanical properties of an epoxy resin system, J. Appl. Polym. Sci. 80 (2001) 71–80,https://doi.org/10.1002/ 1097-4628(20010404)80:1<71::AID-APP1077>3.0.CO;2-H.
[3] M. Fernández-García, M.Y.M. Chiang, Effect of hygrothermal aging history on sorption process, swelling, and glass transition temperature in a particle-filled epoxy-based adhesive, J. Appl. Polym. Sci. 84 (2002) 1581–1591,https://doi.org/ 10.1002/app.10447.
[4] G. Lendvay-Gyorik, T. Pajkossy, B. Lengyel, Corrosion-protection properties of water-borne paint coatings as studied by electrochemical impedance spectroscopy and gravimetry, Prog. Org. Coat. 56 (2006) 304–310,https://doi.org/10.1016/j. porgcoat.2006.05.012.
[5] D.M. Brasher, A.H. Kingsbury, Electrical measurements in the study of immersed paint coatings on metal. I. Comparison between capacitance and gravimetric methods of estimating water-uptake, J. Appl. Chem. 4 (1954) 62–72,https://doi. org/10.1002/jctb.5010040202.
[6] V.B. Mišković-Stanković, D.M. Dražić, M.J. Teodorović, Electrolyte penetration through epoxy coatings electrodeposited on steel, Corros. Sci. 37 (1995) 241–252,
https://doi.org/10.1016/0010-938X(94)00130-X.
[7] E.P.M. van Westing, G.M. Ferrari, J.H.W. de Wit, The determination of coating performance with impedance measurements - II. Water uptake of coatings, Corros. Sci. 36 (1994) 957–977,https://doi.org/10.1016/0010-938X(94)90197-X. [8] A.S. Castela, A.M. Simoes, An impedance model for the estimation of water
ab-sorption in organic coatings. Part I: a linear dielectric mixture equation, Corros. Sci. 45 (2003) 1631–1646,https://doi.org/10.1016/S0010-938X(03)00014-3. [9] A.S. Castela, A.M. Simões, Water sorption in freestanding PVC films by capacitance
measurements, Prog. Org. Coat. 46 (2003) 130–134,https://doi.org/10.1016/ S0300-9440(02)00220-5.
[10] A. Cao-Paz, A. Covelo, J. Fariña, X.R. Nóvoa, C. Pérez, L. Rodríguez-Pardo, Ingress of water into organic coatings: real-time monitoring of the capacitance and increase in mass, Prog. Org. Coat. 69 (2010) 150–157,https://doi.org/10.1016/j.porgcoat. 2010.04.004.
[11] A.S. Nguyen, N. Causse, M. Musiani, M.E. Orazem, N. Pébère, B. Tribollet, V. Vivier, Determination of water uptake in organic coatings deposited on 2024 aluminium alloy: comparison between impedance measurements and gravimetry, Prog. Org. Coat. 112 (2017) 93–100,https://doi.org/10.1016/j.porgcoat.2017.07.004. [12] T.S. Ellis, F.E. Karasz, Interaction of epoxy resins with water: the depression of glass
transition temperature, Polymer 25 (1984) 664–669,https://doi.org/10.1016/ 0032-3861(84)90034-X.
[13] A. Roggero, N. Caussé, E. Dantras, L. Villareal, A. Santos, N. Pébère, Thermal ac-tivation of impedance measurements on an epoxy coating for the corrosion pro-tection: 1. Dielectric spectroscopy response in the dry state, Electrochim. Acta 303 (2019) 239–245,https://doi.org/10.1016/j.electacta.2019.02.035.
[14] A. Roggero, N. Caussé, E. Dantras, L. Villareal, A. Santos, N. Pébère, Thermal ac-tivation of impedance measurements on an epoxy coating for the corrosion pro-tection: 2. Electrochemical impedance spectroscopy study, Electrochim. Acta 305 (2019) 116–124,https://doi.org/10.1016/j.electacta.2019.03.007.
[15] E.P.M. van Westing, G.M. Ferrari, J.H.W. de Wit, The determination of coating performance with impedance measurements - I. Coating polymer properties, Corros. Sci. 34 (1993) 1511–1530,https://doi.org/10.1016/0010-938X(93)90245-C. [16] E. Spengler, F.L. Fragata, I.C.P. Margarit, O.R. Mattos, Corrosion protection of low
toxicity paints, Prog. Org. Coat. 30 (1997) 51–57, https://doi.org/10.1016/S0300-9440(96)00668-6.
[17] C. Le Pen, C. Lacabanne, N. Pébère, Structure of waterborne coatings by electro-chemical impedance spectroscopy and a thermostimulated current method: influ-ence of fillers, Prog. Org. Coat. 39 (2000) 167–175,https://doi.org/10.1016/ S0300-9440(00)00148-X.
[18] C. Le Pen, C. Lacabanne, N. Pébère, Characterisation of water-based coatings by electrochemical impedance spectroscopy, Prog. Org. Coat. 46 (2003) 77–83,
https://doi.org/10.1016/S0300-9440(02)00213-8.
[19] N. Fredj, S. Cohendoz, S. Mallarino, X. Feaugas, S. Touzain, Evidencing antagonist effects of water uptake and leaching processes in marine organic coatings by gravimetry and EIS, Prog. Org. Coat. 67 (2010) 287–295,https://doi.org/10.1016/ j.porgcoat.2009.11.001.
[20] N. Fredj, S. Cohendoz, X. Feaugas, S. Touzain, Some consequences of saline solution immersion on mechanical behavior of two marine epoxy-based coatings, Prog. Org. Coat. 69 (2010) 82–91,https://doi.org/10.1016/j.porgcoat.2010.05.009. [21] G.C. Papanicolaou, T.V. Kosmidou, A.S. Vatalis, C.G. Delides, Water absorption
mechanism and some anomalous effects on the mechanical and viscoelastic beha-vior of an epoxy system, J. Appl. Polym. Sci. 99 (2006) 1328–1339,https://doi.org/ 10.1002/app.22095.
[22] O. Starkova, S.T. Buschhorn, E. Mannov, K. Schulte, A. Aniskevich, Water transport in epoxy/MWCNT composites, Eur. Polym. J. 49 (2013) 2138–2148,https://doi. frequency electrical conductivity. Additionally, both the absorption of
water and plasticizer release very likely participate to the conductivity through charge carrier density variations. To summarize, Fig. 10 fea-tures three physical parameters – two of which were obtained through the EIS spectra analysis – that are markers of the molecular mobility in the studied polymer-based coating. When immersed in an aqueous NaCl solution, the polymer network undergoes physical structure evolutions that can be monitored thanks to these three markers: plasticization in the first stage of immersion and antiplasticization at longer times.
org/10.1016/j.eurpolymj.2013.05.010.
[23] F.X. Perrin, M.H. Nguyen, J.L. Vernet, Water transport in epoxy-aliphatic amine networks - influence of curing cycles, Eur. Polym. J. 45 (2009) 1524–1534,https:// doi.org/10.1016/j.eurpolymj.2009.01.023.
[24] U. Kaatze, V. Uhlendorf, The dielectric properties of water at microwave fre-quencies, Z. Phys. Chem. 126 (1981) 151–165,https://doi.org/10.1524/zpch.1981. 126.2.151.
[25] L.C.E. Struik, Physical aging in plastics and other glassy materials, Polym. Eng. Sci. 17 (1977) 165–173,https://doi.org/10.1002/pen.760170305.
[26] I.M. Hodge, Enthalpy relaxation and recovery in amorphous materials, J. Non Cryst. Solids 169 (1994) 211–266,https://doi.org/10.1016/0022-3093(94)90321-2. [27] S. Montserrat, Physical aging studies in epoxy resins. I. Kinetics of the enthalpy
relaxation process in a fully cured epoxy resin, J. Polym. Sci. Part B: Polym. Phys. 32 (1994) 509–522,https://doi.org/10.1002/polb.1994.090320312.
[28] N. Causse, E. Dantras, C. Tonon, M. Chevalier, H. Combes, P. Guigue, C. Lacabanne, Enthalpy relaxation phenomena of epoxy adhesive in operational configuration: thermal, mechanical and dielectric analyses, J. Non Cryst. Solids 387 (2014) 57–61,
https://doi.org/10.1016/j.jnoncrysol.2013.12.028.
[29] E.H. Immergut, H.F. Mark, Principles of plasticization, in: N.A.J. Platzer (Ed.), Plasticization and Plasticizer Processes, ACS Publications, Washington, D.C, 1965, pp. 1–26, ,https://doi.org/10.1021/ba-1965-0048ch001..
[30] A. Schönhals, F. Kremer, 1 Theory of dielectric relaxation, in: F. Kremer, A. Schönhals (Eds.), Broadband Dielectric Spectroscopy, Springer-Verlag, Berlin, 2003, pp. 1–33, ,https://doi.org/10.1007/978-3-642-56120-7_1.
[31] A.K. Jonscher, The “universal” dielectric response, Nature 267 (1977) 673–679,
https://doi.org/10.1038/267673a0.
[32] R. Richert, Insulated electrodes for eliminating conductivity in dielectric relaxation experiments, Eur. Phys. J. B 68 (2009) 197–200,https://doi.org/10.1140/epjb/
e2009-00084-8.
[33] J. van Turnhout, Better resolved low frequency dispersions by the apt use of Kramers-Kronig relations, differential operators, and all-in-1 modeling, Front. Chem. 4 (2016) 1–19,https://doi.org/10.3389/fchem.2016.00022. [34] M. Wübbenhorst, J. van Turnhout, “Conduction-free” dielectric loss de/dlnf - a
powerful tool for the analysis of strong (ion) conducting dielectric materials, Dielectr. Newsl. 68 (2000) 1614.
[35] D.L. Sidebottom, B. Roling, K. Funke, Ionic conduction in solids: comparing con-ductivity and modulus representations with regard to scaling properties, Phys. Rev. B 63 (2000) 024301, ,https://doi.org/10.1103/PhysRevB.63.024301.
[36] S. Havriliak, S. Negami, A complex plane representation of dielectric and me-chanical relaxation processes in some polymers, Polymer 8 (1967) 161–210,
https://doi.org/10.1016/0032-3861(67)90021-3.
[37] E. Schlosser, A. Schoenhals, H.E. Carius, H. Goering, Evaluation method of tem-perature-dependent relaxation behavior of polymers, Macromolecules 26 (1993) 6027–6032,https://doi.org/10.1021/ma00074a027.
[38] D. Pisignano, S. Capaccioli, R. Casalini, M. Lucchesi, P.A. Rolla, A. Justl, E. Rössler, Study of the relaxation behaviour of a tri-epoxy compound in the supercooled and glassy state by broadband dielectric spectroscopy, J. Phys. Condens. Matter 13 (2001) 4405–4419,https://doi.org/10.1088/0953-8984/13/20/303.
[39] H. Smaoui, M. Arous, H. Guermazi, S. Agnel, A. Toureille, Study of relaxations in epoxy polymer by thermally stimulated depolarization current (TSDC) and di-electric relaxation spectroscopy (DRS), J. Alloys Compd. 489 (2010) 429–436,
https://doi.org/10.1016/j.jallcom.2009.09.116.
[40] W. Jilani, N. Mzabi, N. Fourati, C. Zerrouki, O. Gallot-Lavallée, R. Zerrouki, H. Guermazi, Effects of curing agent on conductivity, structural and dielectric properties of an epoxy polymer, Polymer 79 (2015) 73–81,https://doi.org/10. 1016/j.polymer.2015.09.078.