Publisher’s version / Version de l'éditeur:
Vous avez des questions? Nous pouvons vous aider. Pour communiquer directement avec un auteur, consultez la première page de la revue dans laquelle son article a été publié afin de trouver ses coordonnées. Si vous n’arrivez pas à les repérer, communiquez avec nous à [email protected].
Questions? Contact the NRC Publications Archive team at
[email protected]. If you wish to email the authors directly, please see the first page of the publication for their contact information.
https://publications-cnrc.canada.ca/fra/droits
L’accès à ce site Web et l’utilisation de son contenu sont assujettis aux conditions présentées dans le site LISEZ CES CONDITIONS ATTENTIVEMENT AVANT D’UTILISER CE SITE WEB.
Research Report (National Research Council of Canada. Institute for Research in
Construction), 2006-03-31
READ THESE TERMS AND CONDITIONS CAREFULLY BEFORE USING THIS WEBSITE. https://nrc-publications.canada.ca/eng/copyright
NRC Publications Archive Record / Notice des Archives des publications du CNRC :
https://nrc-publications.canada.ca/eng/view/object/?id=9aba0208-7e99-4056-abb4-a22799d932af https://publications-cnrc.canada.ca/fra/voir/objet/?id=9aba0208-7e99-4056-abb4-a22799d932af
NRC Publications Archive
Archives des publications du CNRC
For the publisher’s version, please access the DOI link below./ Pour consulter la version de l’éditeur, utilisez le lien DOI ci-dessous.
https://doi.org/10.4224/20377858
Access and use of this website and the material on it are subject to the Terms and Conditions set forth at
Fire Scenario Tests in Fire Performance of Houses Test Facility - Data
Compilation
Taber, B. C.; Bwalya, A. C.; McCartney, C. J.; Bénichou, N.; Bounagui, A.;
Carpenter, D. W.; Crampton, G. P.; Kanabus-Kaminska, J. M.; Kashef, A.;
Leroux, P.; Lougheed, G. D.; Su, J. Z.; Thomas, J. R.
Fire Scenario Tests in Fire
Performance of Houses Test
Facility – Data Compilation
Research Report: IRC-RR-208
Date: March 31, 2006
Authors: Bruce Taber, Alex Bwalya,
Cameron McCartney, Noureddine
Bénichou, Abderrazzaq Bounagui,
Don Carpenter, George Crampton,
Malgosia Kanabus-Kaminska,
Ahmed Kashef, Patrice Leroux,
Gary Lougheed, Joseph Su, Russ
Thomas
Institute for Research in Construction Fire Research Program
TABLE OF CONTENTS Table of Contents... i Table of Figures ... ii Preface...iii 1 Introduction ... 1 2 Test Facility ... 1
3 Test Setup, Instrumentation and Procedure... 6
3.1 Test Setup ... 6
3.2 Instrumentation... 11
3.2.1 Basement Level Fire Room ... 11
3.2.2 First Storey ... 12 3.2.3 Second Storey ... 13 3.2.4 Exterior ... 14 3.3 Test Procedure... 14 4 Results ... 14 5 Summary ... 14 6 Referances………...…….. 15
Appendix A Instrumentation List ... 16
Appendix B Test C Results ... 19
Appendix C Test FS-1 Results... 28
Appendix D Test FS-2 Results... 41
Appendix E Test FS-3 Results ... 54
Appendix F Test FS-4 Results ... 67
TABLE OF FIGURES
FIGURE 1. Test facility’s structural steel framework... 2
FIGURE 2. Completed facility with exterior steel cladding (south side shown)... 2
FIGURE 3. Basement level plan view. ... 3
FIGURE 4. First storey level plan view. ... 4
FIGURE 5. Second storey level plan view. ... 5
FIGURE 6. Test facility elevation view. ... 5
FIGURE 7. Fuel package placement for commissioning test... 9
FIGURE 8. Fuel package placement for four fire scenario tests... 9
FIGURE 9. Fuel package for Tests FS-1 and FS-4. ... 10
FIGURE 10. Fuel package for Tests FS-2 and FS-3. ... 10
FIGURE 11. Basement level fire room instrumentation. ... 11
FIGURE 12. First storey instrumentation. ... 12
PREFACE
With the introduction of technological changes and innovations to building materials, design and construction practices in housing, the challenge is to determine the potential impacts of such changes on home fire safety. To help address this challenge, the Canadian Commission on Building and Fire Codes and the Canadian Commission on Construction Materials Evaluation asked the National Research Council Canada (NRC) to undertake research that will provide information to assist in the
assessment of possible impacts.
In response, NRC’s Institute for Research in Construction (IRC) undertook to conduct research into fires in single-family dwellings with the primary objective of determining the impact of innovative residential construction products and systems on the fire safety of house occupants. This phase of the research includes two
components:
1. Full-scale experiments to address how long egress routes within the house will remain viable from the perspective of tenability for occupants and structural integrity;
2. Literature review of related aspects, including evacuation of occupants, smoke alarm activation times, and statistics related to factors affecting fire-related deaths.
This research has been planned with multiple phases. This report addresses Phase 1 (2004 to 2006) of the study which focuses on basement fires and their impacts on the structural integrity of unprotected floor assemblies above a basement. It also looks at the impact upon egress routes, as well as smoke movement and tenability conditions within a house.
This report documents and describes a fully-instrumented 3-level experimental facility. The facility is intended to represent a typical two storey single-family house with a basement. It also documents a series of full-scale fire scenario tests conducted in the test facility using a fuel package consisting of a polyurethane foam sofa mock-up and wood cribs, which was located in a room of fire origin on the basement level.
Experimental data obtained from these full-scale fire scenario tests are compiled in this report. (Data analysis is provided in a separate report).
NRC gratefully acknowledges the financial and technical support of the Special Interest Group on Fire Performance of Houses. This external advisory committee provided valuable input to the research and included representatives from the following organizations:
Canadian Automatic Sprinkler Association Canada Mortgage and Housing Corporation Canadian Wood Council
Cement Association of Canada Forintek Canada Corporation
North American Insulation Manufacturers Association Ontario Ministry of Municipal Affairs and Housing Wood I-Joist Manufacturers Association
The authors would like to acknowledge H. Cunningham (deceased), B. Di Lenardo, E. Gardin, J. Haysom (retired), I. Oleszkiewicz, G. Proulx, and M. Sultan who served in the IRC steering committee for the project, and to acknowledge Eric Gibbs, Michael Ryan and Michael Wright who contributed to the construction of the FPH test facility and assisted in conducting the tests.
FIRE SCENARIO TESTS IN FIRE PERFORMANCE OF HOUSES TEST FACILITY – DATA COMPILATION
by
Bruce Taber, Alex Bwalya, Cameron McCartney, Noureddine Bénichou, Abderrazzaq Bounagui, Don Carpenter, George Crampton, Malgosia Kanabus-Kaminska, Ahmed
Kashef, Patrice Leroux, Gary Lougheed, Joseph Su and Russ Thomas
1 INTRODUCTION
Five fire tests were conducted in NRC’s Fire Performance of Houses (FPH) facility in order to evaluate various fire scenarios for use in the FPH project. This report presents the results of these fire scenario tests along with compilations of the data collected in the studies. The analysis of these results will be addressed in a subsequent report.
The first test was conducted to commission the facility, while the other four were conducted to evaluate temperatures and tenability conditions in the test facility arising from a whole or partial fuel package ignited under various ventilation conditions. One or more of the fire scenarios evaluated during these tests will be used for future tests of floor assemblies within the FPH project.
A separate report1 documents the development of a fuel package for use in the fire scenario tests, which developed a fuel package consisting of a mock-up sofa and wood cribs. This fuel package was used in the fire scenario tests where the mock-up sofa, constructed entirely out of flexible polyurethane foam, was ignited first and, where used, the wood cribs provided additional fuel load to sustain a fully-developed fire. This mode of fire initiation is supported by fire statistics that indicate that many fatal
residential fires begin with an item of upholstered furniture2. The predominant combustible constituent of such furniture is flexible polyurethane foam.
2 TEST FACILITY
The Fire Performance of Houses test facility (Figure 1 and Figure 2) was designed to represent a typical two-storey detached single-family house with a
basement. Since the FPH test facility is constructed within a much larger fire research and testing facility, the basement is actually the first level and the ‘first’ and ‘second’ storeys are the second and third levels of the FPH test facility. The FPH test facility was constructed with non-combustible materials and designed to allow single or multiple structural elements (i.e. floors, walls, roof) to be tested using real fires. Each of the three levels has a floor area of 95.1 m2 (1024 ft2).
FIGURE 1. Test facility’s structural steel framework.
The layout of the basement level is shown in Figure 3. The basement was partitioned to create a fire room representing a 27.6 m2 basement living area with overall dimensions: 5.2 m x 5.3 m x 2.44 m high. This area represents the average size of living areas in basements identified in a prior survey3. A structural floor system, to be studied at a later stage of this project, would be constructed on the first storey directly above the fire room representing a basement living area. For this series of fire scenario tests, however, there was no real structural floor above the fire room. The floor area above the fire room was covered with 2 layers of non-combustible cement board without any
additional load. A stairwell (without a staircase) led from the fire room in the basement level to the first storey. The fire room was lined with non-combustible cement board in all of the tests.
Fire Room
Stair well
Exterior Opening
N
FIGURE 3. Basement level plan view (all dimensions in mm).
A rectangular exterior opening that was 2.0 m wide by 0.5 m high (1 m2) was located on the south wall of the fire room 1.8 m above the floor, equivalent in area to two 1.0 m wide m by 0.5 m high basement windows. This opening was covered with a removable non-combustible panel which, for designated tests, was manually-removed when a predetermined temperature condition was reached at a point near its inner surface in order to simulate the breaking of a pane of glass in a window.
A 0.81 m wide by 2.05 m high doorway was located at the top of the stairwell leading from the basement level to the first storey level. Tests were conduced with the door in this doorway either open or closed, depending on the fire scenario.
The first storey level had an open layout with no partitions, as shown in Figure 4, and a 0.89 m wide by 2.07 m high door leading to the exterior. The walls were lined with non-combustible cement board. The ceiling was lined with 2 layers of 16mm gypsum board. This was done to facilitate the replacement of the ceiling lining if required.
The ceiling height of both the first and second storey levels was 2.44 m.
Stair well
FIGURE 4. First storey level plan view (all dimensions in mm).
The layout of the second storey level is shown in Figure 5. A corridor at the top of the stairs connected two identical bedrooms. The door of the southeast bedroom remained closed and the door of the southwest bedroom was kept open for all tests. The bedroom door openings were 0.81 m wide by 2.05 m high. The walls were lined with cement board and ceiling was lined with 16mm gypsum board.
South East Bedroom 4470 X 3750 C o rr id o r 4 4 5 0 X 1 1 0 0
South West Bedroom 4470 X 3750
N
FIGURE 5. Second storey level plan view (all dimensions in mm).
An elevation view of the facility is shown in Figure 6.
Stairwell 2nd Storey
1st Storey
Basement
Fire Room
3 TEST SETUP, INSTRUMENTATION AND PROCEDURE 3.1 Test Setup
Table 1 lists the fire load and ventilation settings for each test. The same design of mock-up sofa was used in all of the tests. The mock-up sofa was constructed with 6 blocks of flexible polyurethane foam (with a density of 32.8kg/m3) on a metal frame, each block measuring 610 mm long x 610 mm wide and 100 mm or 150 mm thick. The
150 mm-thick foam blocks were used for the backrest and the 100 mm-thick foam blocks for the seat cushion. The wood cribs were made with spruce lumber pieces, each piece measuring 38 mm x 89 mm x 800 mm. The pieces were evenly spaced in rows of six and stacked to heights of 356 mm and 712 mm for the small and large wood cribs, respectively. Table 2 lists the masses of the wood cribs for each test in which wood cribs were used. Test C refers to the commissioning test and Tests FS-1 through FS-4 refer to the fire scenario tests:
Test FS-1 evaluated the impact of a fire involving the complete proposed fuel package under the maximum ventilation conditions provided by the test-setup (1 m2 basement exterior opening and open doorway from the first storey into the basement stairwell).
Test FS-2 evaluated the impact of the mock-up sofa alone under maximum ventilation conditions.
Test FS-3 evaluated the impact of the mock-up sofa alone with no ventilation (both the basement exterior opening and the doorway from first storey into the basement stairwell were closed during the test).
Test FS-4 evaluated the fire involving the whole fuel package under the limited ventilation provided through the basement exterior opening only (doorway from the first storey into the basement stairwell was closed).
The sofa mock-up was oriented in an east-west direction in Test C and was rotated to a south orientation for Test FS-1 (Figure 7 and Figure 8). The north-south orientation was used for all subsequent tests. This was done so that the sofa was oriented across the floor joists rather than parallel to them. The resulting sofa fire would then impact more joists early in the fire development. Test C used the same ventilation conditions as Test FS-1.
The placement of the fuel package in the basement level fire room is illustrated in Figure 7 (Test C) and Figure 8 (Tests FS-1 through FS-4). The sofa was located at the center of the room. Photographs of the fuel package setups for Tests FS-1 and 4 and Tests FS-2 and 3 are shown in Figure 9 and Figure 10 respectively. When used, the two small wood cribs were placed underneath the sofa mock-up and the two large wood cribs were placed beside the sofa mock-up as shown in the figures.
TABLE 1
Fire load and basement ventilation conditions
Number of wood
cribs Ventilation conditions Test Sofa mass (kg) Small Large Total wood mass (kg) Basement exterior opening1 Doorway at top of basement stairs C 8.90 2 2 136.5 Open (90 s)2 Open FS-1 8.88 2 2 148.5 Open (110 s) 2 Open FS-2 8.89 0 0 0.0 Open (80 s) 2 Open FS-3 8.87 0 0 0.0 Closed Closed FS-4 9.26 2 2 186.9 Open (105 s) 2 Closed Notes: 1. Opened at 300°C
2. Time (after ignition) at which it was opened.
TABLE 2 Mass of wood cribs
Large cribs (kg)
Small cribs (under sofa) (kg)
Test
Wood moisture
content Behind sofa Beside sofa # 1 # 2
C - 46.0 46.0 23.0 23.0 FS-1 < 6% 50.0 50.1 24.4 24.5 FS-4 < 7% 58.8 65.0 33.3 31.3
The complete fuel package (sofa and four wood cribs) results in a fire load density of 350 MJ/m2 when spread over an 8.3 m2 area, which corresponds with the results of the survey2 conducted by NRC. The fire density was not spread over the entire area of the room so as to limit the duration of the fire to suite the requirements of the project.
Table 3 lists the condition (open or closed) of the doors on the first and second storey for each test.
TABLE 3
Condition (open or closed) of doors on the first and second storey
Test Doorway at top of basement stairs SW Bedroom door SE Bedroom door
1st Storey exterior door opened
(time after ignition, s) C Open Open Closed 180 s FS-1 Open Open Closed 180 s FS-2 Open Open Closed 180 s FS-3 Closed Open Closed Closed FS-4 Closed Open Closed 180 s
Sofa
Window Opening
Stairwell Half Wood Cribs under Sofa
Wood Crib
Wood Crib
(Note: all measurements are in mm)
FIGURE 7. Fuel package placement for commissioning test.
Wood Crib Sofa
Window Opening
Stairwell Half Wood Cribs
under Sofa
Wood Crib
(Note: No wood cribs were included in the fuel package in fire scenario tests FS-2 and FS-3 - all measurements are in mm).
FIGURE 9. Fuel package for Tests FS-1 and FS-4.
3.2 Instrumentation
The following is a summary of the instrumentation installed inside and around the exterior of the test facility. Test C was not as fully instrumented as Tests FS-1, 2, 3 and 4. Appendix A contains detailed instrumentation lists for each test including their exact locations. Appendix G contains the data processing algorithm.
3.2.1 Basement Level Fire Room
The instrumentation in the basement level fire room included the following: Four vertical arrays of thermocouples located at the quarter points of the fire
room to measure temperatures.
Thermocouples located at the basement exterior opening to measure the simulated glass temperature and the temperature of the gas plume after it was opened.
Residential ionization and photoelectric smoke detectors located on the ceiling at the opening to the stairwell.
Air velocity measurements at the basement exterior opening.
Room pressure measurement located 2.0 m above the floor (Tests FS-1 to FS-4 only).
Video recording of the burning fuel package.
Thermocouples measuring temperatures on the wood cribs (Test FS-4 only).
The positioning of the instrumentation in the basement level fire room is shown in Figure 11. Thermocouples CO / CO2 / O2 Smoke Alarms Air Velocity Pressure Video Legend
3.2.2 First Storey
The instrumentation on the first storey level included the following:
Four vertical thermocouple arrays at the quarter points of the whole floor area.
One vertical thermocouple array located at the opening of the stairwell from the basement level.
Gas analysis at the southeast quarter point, including: o CO/CO2/O2 at 0.4 m and 1.5 m above the floor.
o Fourier Transform Infrared Spectroscopy (FTIR) at 1.5 m above the floor.
Smoke density measurements at the southeast quarter point at 0.4 m and 1.5 m above the floor.
Residential ionization and photoelectric smoke detectors located on the ceiling at the opening to the basement stairwell.
Air velocity measurements located at top of the basement stairs at ceiling height and at 1.5 m above the floor.
Differential pressure measurement between the fire room and the first storey level (Test FS-4 only).
Video recording from two locations.
The positioning of the instrumentation on the first storey level is shown in Figure 12. Legend Thermocouples CO / CO2 / O2 FTIR Smoke Alarms Smoke Density Air Velocity Pressure Video
3.2.3 Second Storey
The instrumentation on the second storey level included the following: One vertical thermocouple array in the corridor at the top of the stairs. One vertical thermocouple array in the center of each bedroom.
Residential ionization and photoelectric smoke detectors located on the ceiling at the top of the stairs.
Residential ionization and photoelectric smoke detectors located on the ceiling at the centre of each bedroom.
Gas analysis (CO/CO2/O2) in the corridor at the top of the stairs at 0.4 m and
1.5 m above the floor.
Smoke density measurements in the corridor at the top of the stairs at 0.4 m and 1.5 m above the floor.
Air velocity measurements located at the top of the stairs at ceiling height and at 1.5 m above the floor.
Video recording in the corridor.
The positioning of the instrumentation on the second storey is shown in Figure 13.
Thermocouples CO / CO2 / O2 FTIR Smoke Alarms Smoke Density Air Velocity Pressure Video Legend
3.2.4 Exterior
Instrumentation of the facility exterior included the following:
Air velocity measurements located at the basement exterior opening. Air velocity measurements located at the exterior door on the first storey
level.
Video recording of the fire room’s exterior opening and exterior door on the first storey level.
3.3 Test Procedure
The data acquisition system was started 60 s prior to ignition to record
background data. Data was collected at 5 s intervals throughout the test. A 250 mm by 250 mm square burner with a propane flow rate of 13 L/min (heat release rate of 19 kW) was ignited for 80 s. This burner was located on the south seat cushion, 50 mm from the backrest, 125 mm from the south edge of the seat and 25 mm above the seat (Figure 9 and Figure 10) in accordance with the ASTM 1537 test protocol3.
In tests FS-1, FS-2 and FS-4, the non-combustible panel that covered the fire room’s exterior opening during the initial stage of each test was manually removed when the temperature measured at the top-center of the opening reached 300°C. This
simulated the fire-induced breakage of a pane of glass that would occur in a window and thereby provided increased ventilation to the fire. The exterior opening was left covered in Test FS-3. To simulate occupants evacuating the house, the exterior door on the first storey was opened at 180 s after ignition, except in Test FS-3, where the door was kept closed.
The tests were terminated when a prolonged period of declining temperatures was observed in the basement level fire room.
4 RESULTS
Appendices B through F contain plots of data from Test C and Tests FS-1 through FS-4.
5 SUMMARY
Figures B.1 through F.28 present the results of a fire test conducted to
commission the FPH test facility and four tests of different fire scenarios. The analysis of these results will be addressed in a subsequent report.
6 REFERENCE
Bwalya, A.C., Carpenter, D.W., Kanabus-Kaminska, M., Lougheed, G., Su, J., Taber, C., Benichou, N., Kashef, A., McCartney, C., Bounagui, A., and Thomas, R., “Development of A Fuel Package for Use in the Fire Performance of Houses Project”, IRC-RR-207, Institute for Research in Construction, National Research Council of Canada, pp. 26, March 31, 2006.
APPENDIX A INSTRUMENTATION LIST
FS
Slot Description C
1 2 3 4 1 CO gas analyzer, 1st floor, SW, 1.5 m above floor (H&B, 4-20mA, 5%) X • • • • 2 CO2 gas analyzer, 1
st
floor, SW, 1.5 m above floor (H&B, 4-20mA,
10%) X • • • •
3 O2 gas analyzer, 1 st
floor, SW, 1.5 m above floor (H&B, 4-20mA, 25%) X • • • • 4 O2 gas analyzer, 1
st
floor, SW, 0.9 m above floor (H&B, 4-20mA, 25%) X • • • • 5 CO gas analyzer, 1st floor, SW, 0.9 m above floor (H&B, 4-20mA, 1%) X • • • • 6 CO2 gas analyzer, 1
st
floor, SW, 0.9 m above floor (H&B, 4-20mA,
10%) X • • • •
7 O2 gas analyzer, 2 nd
floor, top of stairs (H&B, 4-20mA, 25%) X • • • • 8 CO gas analyzer, 2nd floor, top of stairs (H&B, 4-20mA, 1%) X • • • • 9 CO2 gas analyzer, 2
nd
floor, top of stairs (H&B, 4-20mA, 10%) X • • • • 10 O2 gas analyzer, 2
nd
floor, top of stairs (H&B, 0-20mA, 25%) X • • • • 11 CO gas analyzer, 2nd floor, top of stairs (H&B, 4-20mA, 1%) X • • • • 12 CO2 gas analyzer, 2
nd
floor, top of stairs (H&B, 4-20mA, 10%) X • • • •
21 TC tree # 1, Basement SE quadrant, 2.4 m above floor • • • • •
22 TC tree # 1, Basement SE quadrant, 1.9 m above floor • • • • •
23 TC tree # 1, Basement SE quadrant, 1.4 m above floor • • • • •
24 TC tree # 1, Basement SE quadrant, 0.9 m above floor • • • • •
25 TC tree # 1, Basement SE quadrant, 0.4 m above floor • • • • •
26 TC tree # 2, Basement NW quadrant, 2.4 m above floor • • • • •
27 TC tree # 2, Basement NW quadrant, 1.9 m above floor • • • • •
28 TC tree # 2, Basement NW quadrant, 1.4 m above floor • • • • •
29 TC tree # 2, Basement NW quadrant, 0.9 m above floor • • • • •
30 TC tree # 2, Basement NW quadrant, 0.4 m above floor • • • • •
31 TC on crib behind sofa, east side, centre of 3rdrow X X X X •
32 TC on crib behind sofa, east side, centre of 7throw X X X X •
33 TC on crib behind sofa, centre of top side X X X X •
34 TC on crib beside sofa, north side, centre of 3rdrow X X X X •
35 TC on crib beside sofa, north side, centre of 7throw X X X X •
99 TC on crib beside sofa, centre of top side X X X X •
36 steel column, SW • • • • •
37 steel column, NW • • • • •
38 steel column, SE • • • • •
39 Basement exterior opening, top centre • • • • •
Heat Flux Meter #97435, 1.2 m high, 1.2 m behind sofa X X X X X
40
Room Pressure, basement, 2.0 m above floor (±5V, 0Pa = 2.43V) X • • • •
41 TC tree # 4, 1st floor, top of basement stairs, 2.4 m above floor • • • • • 42 TC tree # 4, 1st floor, top of basement stairs, 1.9 m above floor • • • • • 43 TC tree # 4, 1st floor, top of basement stairs, 1.4 m above floor • • • • • 44 TC tree # 4, 1st floor, top of basement stairs, 0.9 m above floor • • • • • 45 TC tree # 4, 1st floor, top of basement stairs, 0.4 m above floor • • • • •
46 TC tree # 5, 1st floor, SW quadrant, 2.4 m above floor • • • • •
47 TC tree # 5, 1st floor, SW quadrant, 1.9 m above floor • • • • •
48 TC tree # 5, 1st floor, SW quadrant, 1.4 m above floor • • • • •
49 TC tree # 5, 1st floor, SW quadrant, 0.9 m above floor • • • • •
50 TC tree # 5, 1st floor, SW quadrant, 0.4 m above floor • • • • •
52 TC tree # 6, 1st floor, SE quadrant, 1.9 m above floor • • • • •
53 TC tree # 6, 1st floor, SE quadrant, 1.4 m above floor • • • • •
54 TC tree # 6, 1st floor, SE quadrant, 0.9 m above floor • • • • •
55 TC tree # 6, 1st floor, SE quadrant, 0.4 m above floor • • • • •
56 TC tree # 7, 1st floor, NE quadrant, 2.4 m above floor • • • • •
57 TC tree # 7, 1st floor, NE quadrant, 1.9 m above floor • • • • •
58 TC tree # 7, 1st floor, NE quadrant, 1.4 m above floor • • • • •
59 TC tree # 7, 1st floor, NE quadrant, 0.9 m above floor • • • • •
60 TC tree # 7, 1st floor, NE quadrant, 0.4 m above floor • • • • •
61 TC tree # 8, 1st floor, NW quadrant, 2.4 m above floor • • • • •
62 TC tree # 8, 1st floor, NW quadrant, 1.9 m above floor • • • • •
63 TC tree # 8, 1st floor, NW quadrant, 1.4 m above floor • • • • •
64 TC tree # 8, 1st floor, NW quadrant, 0.9 m above floor • • • • •
65 TC tree # 8, 1st floor, NW quadrant, 0.4 m above floor • • • • •
66 Smoke Detector #1, Ioniz., Basement, bottom of stairs • • X X X
67 Smoke Detector #2, Photoelec., Basement, bottom of stairs • • • • •
68 Smoke Detector #3, Ioniz., 1st floor, top of stairs • • • • • 69 Smoke Detector #4, Photoelec., 1st floor, top of stairs • • • • • 70 Smoke Detector #5, Ioniz., 2nd floor, top of stairs • • • • • 71 Smoke Detector #6, Photoelec., 2nd floor, top of stairs • • • • • 72 Smoke Detector #7, Ioniz., SE bedroom, closed • • • • •
73 Smoke Detector #8, Photoelec., SE bedroom, closed • • • • •
74 Smoke Detector #9, Ioniz., SW bedroom, open • • • • •
75 Smoke Detector #10, Photoelec., SW bedroom, open • • • • •
76 TC on velocity probe at 1stfloor door X • • • •
77 Smoke meter, 1st floor, 1.5 m above floor (SMK WHT#4 , 2V) X • • • • 78 Smoke meter, 1st floor, 0.9 m above floor (SMK WHT#3 , 2V) X • • • • 79 Smoke meter, 2nd floor, 1.5 m above floor (pulsed white light #4 , 2V) X • • • • 80 Smoke meter, 2nd floor, 0.9 m above floor (pulsed white light #5 , 2V) X • • • • 81 TC tree # 9, 2nd floor, SW bedroom, open, 2.4 m above floor • • • • • 82 TC tree # 9, 2nd floor, SW bedroom, open, 1.9 m above floor • • • • • 83 TC tree # 9, 2nd floor, SW bedroom, open, 1.4 m above floor • • • • • 84 TC tree # 9, 2nd floor, SW bedroom, open, 0.9 m above floor • • • • • 85 TC tree # 9, 2nd floor, SW bedroom, open, 0.4 m above floor • • • • • 86 TC tree # 10, 2nd floor, 2nd floor, top of stairs, 2.4 m above floor • • • • • 87 TC tree # 10, 2nd floor, 2nd floor, top of stairs, 1.9 m above floor • • • • • 88 TC tree # 10, 2nd floor, 2nd floor, top of stairs, 1.4 m above floor • • • • • 89 TC tree # 10, 2nd floor, 2nd floor, top of stairs, 0.9 m above floor • • • • • 90 TC tree # 10, 2nd floor, 2nd floor, top of stairs, 0.4 m above floor • • • • • 91 TC tree # 11, 2nd floor, SE bedroom, closed, 2.4 m above floor • • • • • 92 TC tree # 11, 2nd floor, SE bedroom, closed, 1.9 m above floor • • • • • 93 TC tree # 11, 2nd floor, SE bedroom, closed, 1.4 m above floor • • • • • 94 TC tree # 11, 2nd floor, SE bedroom, closed, 0.9 m above floor • • • • • 95 TC tree # 11, 2nd floor, SE bedroom, closed, 0.4 m above floor • • • • • 96 TC on hot side of door at top of basement stairs, 1.9 m above floor X X X X • 97 TC on hot side of door at top of basement stairs, 1.4 m above floor X X X X • 98 TC on hot side of door at top of basement stairs, 0.9 m above floor X X X X • 99 Differential pressure, basement, 2m-1st floor, 0.5m (5V, 0Pa=-2.43V) X X X X • 101 Velocity Probe, top of basement stairs, at ceiling (+ is up stairs X 1000
Pa) • • • • •
102 Velocity Probe, top of basement stairs, 1.5 m above floor (+ is up stairs
X 1000 Pa) • • • • •
Pa)
104 Velocity Probe, 2
nd
floor, top of stairs, 1.5 m above floor (+ is up stairs
X 1000 Pa) • • • • •
105 Velocity Probe, 1st floor exterior door (+ is to exterior X 2000 Pa) • • • • •
106 TC tree # 12, Basement SW quadrant, 2.4 m above floor X • • • •
107 TC tree # 12, Basement SW quadrant, 1.9 m above floor X • • • •
108 TC tree # 12, Basement SW quadrant, 1.4 m above floor X • • • •
109 TC tree # 12, Basement SW quadrant, 0.9 m above floor X • • • •
110 TC tree # 12, Basement SW quadrant, 0.4 m above floor X • • • •
111 TC tree # 13, Basement NE quadrant, 2.4 m above floor X • • • •
112 TC tree # 13, Basement NE quadrant, 1.9 m above floor X • • • •
113 TC tree # 13, Basement NE quadrant, 1.4 m above floor X • • • •
114 TC tree # 13, Basement NE quadrant, 0.9 m above floor X • • • •
115 TC tree # 13, Basement NE quadrant, 0.4 m above floor X • • • •
116 TC, basement exterior opening, top, east side X X • • •
117 TC, basement exterior opening, top, west side X X • • •
39 TC, basement exterior opening, top center X • • • •
118 TC, basement exterior opening, center of opening X • • • •
119 TC, basement exterior opening, bottom center X • • • •
120 Time (s) • • • • •
Legend:
• = included
APPENDIX B TEST C RESULTS
Fire Performance of Houses
Test C Nov. 25, 2004 • one sofa at center of basement
• 46 kg wood crib located 0.20 m behind sofa
• 46 kg wood crib located 0.20 m from west side of sofa • two 23 kg wood cribs located under the sofa
• SE bedroom door closed / SW bedroom door open • 80 s ignition with 18 kW burner (13 L/min)
• basement exterior opening opened when air temperature near it reached 300°C • first floor door opened at 180 s
Figure B.1. TC Tree 1 - Basement SE quadrant. Time (s) 0 200 400 600 800 1000 1200 1400 1600 1800 2000 T e mp er at u re (ºC) 0 100 200 300 400 500 600 700 800 900 1000 2.4 m 1.9 m 1.4 m 0.9 m 0.4 m
Figure B.2. TC Tree 12 - Basement SW quadrant. Time (s) 0 200 400 600 800 1000 1200 1400 1600 1800 2000 T e mp era ture (ºC) 0 100 200 300 400 500 600 700 800 900 1000
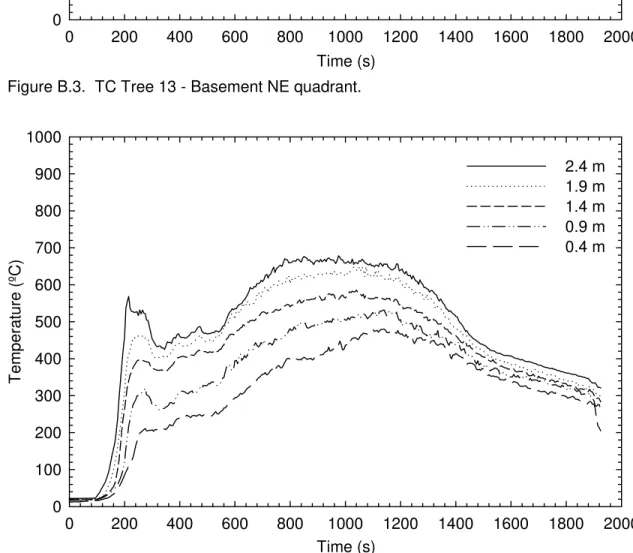
Figure B.3. TC Tree 13 - Basement NE quadrant. Time (s) 0 200 400 600 800 1000 1200 1400 1600 1800 2000 T e m perature (º C ) 0 100 200 300 400 500 600 700 800 900 1000
Figure B.4. TC Tree 2 - Basement NW quadrant. Time (s) 0 200 400 600 800 1000 1200 1400 1600 1800 2000 T e m perature (ºC) 0 100 200 300 400 500 600 700 800 900 1000 2.4 m 1.9 m 1.4 m 0.9 m 0.4 m Instrumentation not installed in this test
Figure B.5. TC Tree 6 - 1st Storey SE quadrant. Time (s) 0 200 400 600 800 1000 1200 1400 1600 1800 2000 T e mperature (ºC) 0 50 100 150 200 250 2.4 m 1.9 m 1.4 m 0.9 m 0.4 m
Figure B.6. TC Tree 5 - 1st Storey SW quadrant. Time (s) 0 200 400 600 800 1000 1200 1400 1600 1800 2000 T e m perature (º C) 0 50 100 150 200 250 2.4 m 1.9 m 1.4 m 0.9 m 0.4 m
Figure B.7. TC Tree 7 - 1st Storey NE quadrant. Time (s) 0 200 400 600 800 1000 1200 1400 1600 1800 2000 T e mp er at u re (º C) 0 25 50 75 100 125 150 175 200 225 250 2.4 m 1.9 m 1.4 m 0.9 m 0.4 m
Figure B.8. TC Tree 8 - 1st Storey NW quadrant. Time (s) 0 200 400 600 800 1000 1200 1400 1600 1800 2000 T e mp erature (ºC) 0 25 50 75 100 125 150 175 200 225 250 2.4 m 1.9 m 1.4 m 0.9 m 0.4 m
Figure B.9. TC Tree 11 - 2nd Storey SE bedroom. Time (s) 0 200 400 600 800 1000 1200 1400 1600 1800 2000 T e mp eratu re (ºC) 0 25 50 75 100 125 150 2.4 m 1.9 m 1.4 m 0.9 m 0.4 m
Figure B.10. TC Tree 9 - 2nd Storey SW bedroom. Time (s) 0 200 400 600 800 1000 1200 1400 1600 1800 2000 T e m p e rature (ºC ) 0 25 50 75 100 125 150 2.4 m 1.9 m 1.4 m 0.9 m 0.4 m
Figure B.11. TC Tree 4 - Top of basement stairs. Time (s) 0 200 400 600 800 1000 1200 1400 1600 1800 2000 T e mpe ra ture (ºC) 0 100 200 300 400 500 2.4 m 1.9 m 1.4 m 0.9 m 0.4 m
Figure B.12. TC Tree 10 - Top of 1st storey stairs. Time (s) 0 200 400 600 800 1000 1200 1400 1600 1800 2000 T e mp erature (ºC) 0 25 50 75 100 125 150 175 200 2.4 m 1.9 m 1.4 m 0.9 m 0.4 m
Figure B.13. TCs - Basement window. Time (s) 0 200 400 600 800 1000 1200 1400 1600 1800 2000 T e m peratu re (ºC) 0 100 200 300 400 500 600 700 800 900 1000
Figure B.14. TCs - Steel columns.
Time (s) 0 200 400 600 800 1000 1200 1400 1600 1800 2000 T e mp er at u re (º C) 0 50 100 150 200 250 SW NW SE
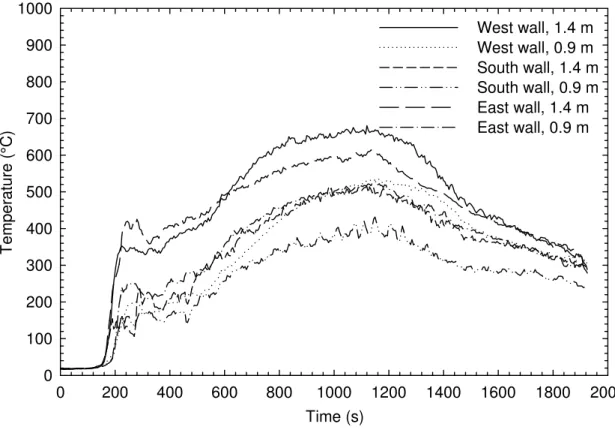
Figure B.25. Fire compartment wall temperatures. Time (s) 0 200 400 600 800 1000 1200 1400 1600 1800 2000 T e m perat ure (°C) 0 100 200 300 400 500 600 700 800 900 1000 West wall, 1.4 m West wall, 0.9 m South wall, 1.4 m South wall, 0.9 m East wall, 1.4 m East wall, 0.9 m
APPENDIX C TEST FS-1 RESULTS
Fire Performance of Houses Test Summary • Test ID: FS-1 (Fire Scenario 1)
• Test Date: Jan. 27, 2005
• Atmospheric Conditions: Temp: -18°C RH: 65% Pres: 103.5 kPa ↑ • Structure Tested: Non-combustible floor assembly
• Fire Load:
sofa at center of basement (8.88 kg foam)
wood crib located 0.20 m behind sofa (50.0 kg, <6% MC)
wood crib located 0.20 m from west side of sofa (50.1 kg, <6% MC) two wood cribs located under the sofa (25.4 kg, 24.5 kg, <6% MC) 80 s ignition with 19 kW burner (13 L/min)
ignition time after start of data: 62 s
• Doors: SE bedroom door closed / SW bedroom door open first floor door opened at 180 s
• Basement exterior opening: opened at 110 s when air temperature near it reached 300°C
• Smoke Detector Activation Times:
Activation (time from ignition) Smoke Detector #1, Ioniz., Basement, bottom of stairs before ignition Smoke Detector #2, Photoelec., Basement, bottom of stairs 0:30 Smoke Detector #3, Ioniz., 1st Floor, top of stairs 0:50 Smoke Detector #4, Photoelec., 1st Floor, top of stairs 1:15 Smoke Detector #5, Ioniz., 2nd Floor, top of stairs 1:45 Smoke Detector #6, Photoelec., 2nd Floor, top of stairs 2:05 Smoke Detector #7, Ioniz., SE bedroom, closed 3:10 Smoke Detector #8, Photoelec., SE bedroom, closed 4:15 Smoke Detector #9, Ioniz., SW bedroom, open 2:05 Smoke Detector #10, Photoelec., SW bedroom, open 2:10
Figure C.1. TC Tree 1 - Basement SE quadrant. Time (s) 0 200 400 600 800 1000 1200 1400 1600 1800 T emp erat ure (ºC) 0 100 200 300 400 500 600 700 800 900 1000 2.4 m 1.9 m 1.4 m 0.9 m 0.4 m
Figure C.2. TC Tree 12 - Basement SW quadrant. Time (s) 0 200 400 600 800 1000 1200 1400 1600 1800 T empe rat u re (ºC) 0 100 200 300 400 500 600 700 800 900 1000 2.4 m 1.9 m 1.4 m 0.9 m 0.4 m
Figure C.3. TC Tree 13 - Basement NE quadrant. Time (s) 0 200 400 600 800 1000 1200 1400 1600 1800 T empe rat u re (ºC) 0 100 200 300 400 500 600 700 800 900 1000 2.4 m 1.9 m 1.4 m 0.9 m 0.4 m
Figure C.4. TC Tree 2 - Basement NW quadrant. Time (s) 0 200 400 600 800 1000 1200 1400 1600 1800 T empe rat u re (ºC) 0 100 200 300 400 500 600 700 800 900 1000 2.4 m 1.9 m 1.4 m 0.9 m 0.4 m
Figure C.5. TC Tree 6 - 1st Storey SE quadrant. Time (s) 0 200 400 600 800 1000 1200 1400 1600 1800 T e mperature (ºC) 0 50 100 150 200 250 300 2.4 m 1.9 m 1.4 m 0.9 m 0.4 m
Figure C.6. TC Tree 5 - 1st Storey SW quadrant. Time (s) 0 200 400 600 800 1000 1200 1400 1600 1800 T e m perature (º C) 0 50 100 150 200 250 300 2.4 m 1.9 m 1.4 m 0.9 m 0.4 m
Figure C.7. TC Tree 7 - 1st Storey NE quadrant. Time (s) 0 200 400 600 800 1000 1200 1400 1600 1800 T e mp er at u re (º C) 0 50 100 150 200 250 300 2.4 m 1.9 m 1.4 m 0.9 m 0.4 m
Figure C.8. TC Tree 8 - 1st Storey NW quadrant. Time (s) 0 200 400 600 800 1000 1200 1400 1600 1800 T e mp erature (ºC) 0 50 100 150 200 250 300 2.4 m 1.9 m 1.4 m 0.9 m 0.4 m
Figure C.9. TC Tree 11 - 2nd Storey SE bedroom. Time (s) 0 200 400 600 800 1000 1200 1400 1600 1800 T e mp eratu re (ºC) 0 25 50 75 100 125 150 175 200 2.4 m 1.9 m 1.4 m 0.9 m 0.4 m
Figure C.10. TC Tree 9 - 2nd Storey SW bedroom. Time (s) 0 200 400 600 800 1000 1200 1400 1600 1800 T e m p e rature (ºC ) 0 25 50 75 100 125 150 175 200 2.4 m 1.9 m 1.4 m 0.9 m 0.4 m
Figure C.11. TC Tree 4 - Top of basement stairs. Time (s) 0 200 400 600 800 1000 1200 1400 1600 1800 T e mp er at u re (º C) 0 100 200 300 400 500 600 2.4 m 1.9 m 1.4 m 0.9 m 0.4 m
Figure C.12. TC Tree 10 - Top of 1st storey stairs. Time (s) 0 200 400 600 800 1000 1200 1400 1600 1800 T e mp erature (ºC) 0 100 200 300 400 500 600 2.4 m 1.9 m 1.4 m 0.9 m 0.4 m
Figure C.13. TCs - Basement window. Time (s) 0 200 400 600 800 1000 1200 1400 1600 1800 T e mp e rat u re (ºC) 0 100 200 300 400 500 600 700 800 900 Top east Top west Top center Center Bottom center
Figure C.14. TCs - Steel columns.
Time (s) 0 200 400 600 800 1000 1200 1400 1600 1800 T e mp er at ur e (ºC) -25 0 25 50 75 100 125 SW NW SE
Figure C.15. O2 Concentrations. Time (s) 0 200 400 600 800 1000 1200 1400 1600 1800 O2 c o nc en tr a tio ns (%Vo l) 10 11 12 13 14 15 16 17 18 19 20 21 1st storey, 1.5 m 1st storey, 0.9 m 2nd storey stairs, 1.5 m 2nd storey stairs, 0.9 m Figure C.16. CO2 Concentrations. Time (s) 0 200 400 600 800 1000 1200 1400 1600 1800 CO 2 concen trations (%Vol) 0 1 2 3 4 5 6 7 8 9 10 1st storey, 1.5 m 1st storey, 0.9 m 2nd storey stairs, 1.5 m 2nd storey stairs, 0.9 m
Figure C.17. CO Concentrations. Time (s) 0 200 400 600 800 1000 1200 1400 1600 1800 CO concentrations (%Vo l) 0.0 0.1 0.2 0.3 0.4 0.5 0.6 0.7 1st storey, 1.5 m 1st storey, 0.9 m 2nd storey stairs, 1.5 m 2nd storey stairs, 0.9 m
Figure C.18. Pressure - Fire compartment.
Time (s) 0 200 400 600 800 1000 1200 1400 1600 1800 Press u re (Pa) 0 10 20 30 40 50 60 70 80 90 100
Figure C.19. Smokemeters - 1st storey. Time (s) 0 200 400 600 800 1000 1200 1400 1600 1800 Sm oke obscu ra tio n (O.D ./m) 0 1 2 3 4 5 1.5 m 0.9 m
Figure C.20. Smokemeters - 2nd storey.
Time (s) 0 200 400 600 800 1000 1200 1400 1600 1800 Sm oke obscuratio n (O.D./m) 0 1 2 3 4 5 1.5 m 0.9 m Measurement limit: 4.5 O.D./m
Figure C.21. Velocity probes - Top of basement stairs. Time (s) 0 200 400 600 800 1000 1200 1400 1600 1800 Ve lo ci ty (m/ s ) -5 -4 -3 -2 -1 0 1 2 3 4 5 Ceiling 1.5 m
Figure C.22. Velocity probes - Top of 1st storey stairs. Time (s) 0 200 400 600 800 1000 1200 1400 1600 1800 V e lo ci ty (m /s) -5 -4 -3 -2 -1 0 1 2 3 4 5 Ceiling 1.5 m
Figure C.23. Velocity probe - Exterior door. Time (s) 0 200 400 600 800 1000 1200 1400 1600 1800 Velocity (m /s) -5 -4 -3 -2 -1 0 1 2 3 4 5
Figure C.24. TC - Exterior door velocity probe. Time (s) 0 200 400 600 800 1000 1200 1400 1600 1800 T e mp eratu re (º C) -50 0 50 100 150 200 250
APPENDIX D TEST FS-2 RESULTS
Fire Performance of Houses Test Summary • Test ID: FS-2
• Test Date: Feb. 22, 2005
• Atmospheric Conditions: Temp: -7°C RH: 92% Pres: 101.9 kPa ↓ • Structure Tested: Non-combustible floor assembly
• Fire Load:
sofa at center of basement (8.89 kg foam) no wood cribs
80 s ignition with 19 kW burner (13 L/min) Ignition time after start of data: 65 s
• Doors: SE bedroom door closed / SW bedroom door open first floor door opened at 180 s
• Basement exterior opening: opened at 80 s when air temperature near it reached 300°C
• Smoke Detector Activation Times:
Activation (time from ignition) Smoke Detector #1, Ioniz., Basement, bottom of stairs not used Smoke Detector #2, Photoelec., Basement, bottom of stairs 0:30 Smoke Detector #3, Ioniz., 1st Floor, top of stairs 1:05 Smoke Detector #4, Photoelec., 1st Floor, top of stairs 1:10 Smoke Detector #5, Ioniz., 2nd Floor, top of stairs 1:45 Smoke Detector #6, Photoelec., 2nd Floor, top of stairs 1:55 Smoke Detector #7, Ioniz., SE bedroom, closed 8:10 Smoke Detector #8, Photoelec., SE bedroom, closed 4:15 Smoke Detector #9, Ioniz., SW bedroom, open 2:00 Smoke Detector #10, Photoelec., SW bedroom, open 2:05
Figure D.1. TC Tree 1 - Basement SE quadrant. Time (s) 0 100 200 300 400 500 600 700 T emp erat ure (ºC) 0 100 200 300 400 500 600 700 800 900 1000 2.4 m 1.9 m 1.4 m 0.9 m 0.4 m
Figure D.2. TC Tree 12 - Basement SW quadrant. Time (s) 0 100 200 300 400 500 600 700 T empe rat u re (ºC) 0 100 200 300 400 500 600 700 800 900 1000 2.4 m 1.9 m 1.4 m 0.9 m 0.4 m
Figure D.3. TC Tree 13 - Basement NE quadrant. Time (s) 0 100 200 300 400 500 600 700 T e m pera ture (ºC) 0 100 200 300 400 500 600 700 800 900 1000 2.4 m 1.9 m 1.4 m 0.9 m 0.4 m
Figure D.4. TC Tree 2 - Basement NW quadrant. Time (s) 0 100 200 300 400 500 600 700 T e mp er at ur e (ºC) 0 100 200 300 400 500 600 700 800 900 1000 2.4 m 1.9 m 1.4 m 0.9 m 0.4 m
Figure D.5. TC Tree 6 - 1st Storey SE quadrant. Time (s) 0 100 200 300 400 500 600 700 T e mperature (ºC) 0 25 50 75 100 125 150 2.4 m 1.9 m 1.4 m 0.9 m 0.4 m
Figure D.6. TC Tree 5 - 1st Storey SW quadrant. Time (s) 0 100 200 300 400 500 600 700 T e m perature (ºC) 0 25 50 75 100 125 150 2.4 m 1.9 m 1.4 m 0.9 m 0.4 m
Figure D.7. TC Tree 7 - 1st Storey NE quadrant. Time (s) 0 100 200 300 400 500 600 700 T e mp er at u re (ºC) 0 25 50 75 100 125 150 2.4 m 1.9 m 1.4 m 0.9 m 0.4 m
Figure D.8. TC Tree 8 - 1st Storey NW quadrant. Time (s) 0 100 200 300 400 500 600 700 T e mp erature (ºC) 0 25 50 75 100 125 150 2.4 m 1.9 m 1.4 m 0.9 m 0.4 m
Figure D.9. TC Tree 11 - 2nd Storey SE bedroom. Time (s) 0 100 200 300 400 500 600 700 T e mp eratu re (ºC) 0 10 20 30 40 50 2.4 m 1.9 m 1.4 m 0.9 m 0.4 m
Figure D.10. TC Tree 9 - 2nd Storey SW bedroom. Time (s) 0 100 200 300 400 500 600 700 T e m p e rature (ºC ) 0 10 20 30 40 50 2.4 m 1.9 m 1.4 m 0.9 m 0.4 m
Figure D.11. TC Tree 4 - Top of basement stairs. Time (s) 0 100 200 300 400 500 600 700 T e mp er at u re (ºC) 0 50 100 150 200 250 2.4 m 1.9 m 1.4 m 0.9 m 0.4 m
Figure D.12. TC Tree 10 - Top of 1st storey stairs. Time (s) 0 100 200 300 400 500 600 700 T e mp erature (ºC) 0 10 20 30 40 50 60 70 80 90 100 2.4 m 1.9 m 1.4 m 0.9 m 0.4 m
Figure D.13. TCs - Basement window. Time (s) 0 100 200 300 400 500 600 700 T e mp er at u re (ºC) 0 100 200 300 400 500 600 700 800 900 1000 Top east Top west Top center Center Bottom center
Figure D.14. TCs - Steel columns.
Time (s) 0 100 200 300 400 500 600 700 T e mp erature (ºC) 0 5 10 15 20 25 SW NW SE
Figure D.15. O2 Concentrations. Time (s) 0 100 200 300 400 500 600 700 O2 c o nc en tr at io n s (%V o l) 13 14 15 16 17 18 19 20 21 1st storey, 1.5 m 1st storey, 0.9 m 2nd storey stairs, 1.5 m 2nd storey stairs, 0.9 m Figure D.16. CO2 Concentrations. Time (s) 0 100 200 300 400 500 600 700 CO 2 con c en tration s (%Vol) 0.0 0.5 1.0 1.5 2.0 2.5 3.0 1st storey, 1.5 m 1st storey, 0.9 m 2nd storey stairs, 1.5 m 2nd storey stairs, 0.9 m
Figure D.17. CO Concentrations. Time (s) 0 100 200 300 400 500 600 700 CO co ncen tration s (%Vol) 0.0 0.1 0.2 0.3 0.4 0.5 1st storey, 1.5 m 1st storey, 0.9 m 2nd storey stairs, 1.5 m 2nd storey stairs, 0.9 m
Figure D.18. Pressure - Fire compartment.
Time (s) 0 100 200 300 400 500 600 700 Pres sure (Pa) 0 10 20 30 40 50 60 70 80 90 100
Figure D.19. Smokemeters - 1st storey. Time (s) 0 100 200 300 400 500 600 700 Sm oke obscu ra tio n (O.D ./m) 0.0 0.5 1.0 1.5 2.0 2.5 3.0 3.5 1.5 m 0.9 m
Figure D.20. Smokemeters - 2nd storey.
Time (s) 0 100 200 300 400 500 600 700 Sm oke obscuratio n (O.D./m) 0.0 0.5 1.0 1.5 2.0 2.5 3.0 3.5 1.5 m 0.9 m
Figure D.21. Velocity probes - Top of basement stairs. Time (s) 0 100 200 300 400 500 600 700 Ve lo ci ty (m/ s ) -4 -3 -2 -1 0 1 2 3 4 Ceiling 1.5 m
Figure D.22. Velocity probes - Top of 1st storey stairs. Time (s) 0 100 200 300 400 500 600 700 V e lo ci ty (m /s) -4 -3 -2 -1 0 1 2 3 4 Ceiling 1.5 m
Figure D.23. Velocity probe - Exterior door. Time (s) 0 100 200 300 400 500 600 700 Velocity (m /s) 0.0 0.5 1.0 1.5 2.0 2.5
Figure D.24. TC - Exterior door velocity probe. Time (s) 0 100 200 300 400 500 600 700 T e mp eratu re (º C) 0 10 20 30 40 50 60 70 80 90 100
APPENDIX E TEST FS-3 RESULTS
Fire Performance of Houses Test Summary • Test ID: FS-3
• Test Date: Feb. 25, 2005
• Atmospheric Conditions: Temp: -12°C RH: 65% Pres: 102.3 kPa ↓ • Structure Tested: Non-combustible floor assembly
• Fire Load:
sofa at center of basement (8.87 kg foam) no wood cribs
80 s ignition with 19 kW burner (13 L/min) Ignition time after start of data: 65 s
• Doors: SE bedroom door closed / SW bedroom door open first floor door closed
door at top of basement stairs closed • Basement exterior opening: closed • Smoke Detector Activation Times:
Activation (time from ignition) Smoke Detector #1, Ioniz., Basement, bottom of stairs not used Smoke Detector #2, Photoelec., Basement, bottom of stairs 0:30 Smoke Detector #3, Ioniz., 1st Floor, top of stairs 0:35 Smoke Detector #4, Photoelec., 1st Floor, top of stairs 1:00 Smoke Detector #5, Ioniz., 2nd Floor, top of stairs 1:25 Smoke Detector #6, Photoelec., 2nd Floor, top of stairs 1:50 Smoke Detector #7, Ioniz., SE bedroom, closed 18:10 Smoke Detector #8, Photoelec., SE bedroom, closed 16:15 Smoke Detector #9, Ioniz., SW bedroom, open 2:05 Smoke Detector #10, Photoelec., SW bedroom, open 2:10
Figure E.1. TC Tree 1 - Basement SE quadrant. Time (s) 0 200 400 600 800 1000 1200 1400 1600 T e mp era ture (ºC) 0 100 200 300 400 500 600 700 800 900 1000 2.4 m 1.9 m 1.4 m 0.9 m 0.4 m
Figure E.2. TC Tree 12 - Basement SW quadrant. Time (s) 0 200 400 600 800 1000 1200 1400 1600 T e mp er at ur e (ºC) 0 100 200 300 400 500 600 700 800 900 1000 2.4 m 1.9 m 1.4 m 0.9 m 0.4 m
Figure E.3. TC Tree 13 - Basement NE quadrant. Time (s) 0 200 400 600 800 1000 1200 1400 1600 T e m pera ture (ºC) 0 100 200 300 400 500 600 700 800 900 1000 2.4 m 1.9 m 1.4 m 0.9 m 0.4 m
Figure E.4. TC Tree 2 - Basement NW quadrant. Time (s) 0 200 400 600 800 1000 1200 1400 1600 T e mp er at ur e (ºC) 0 100 200 300 400 500 600 700 800 900 1000 2.4 m 1.9 m 1.4 m 0.9 m 0.4 m
Figure E.5. TC Tree 6 - 1st Storey SE quadrant. Time (s) 0 200 400 600 800 1000 1200 1400 1600 T e mperature (ºC) 0 5 10 15 20 25 2.4 m 1.9 m 1.4 m 0.9 m 0.4 m
Figure E.6. TC Tree 5 - 1st Storey SW quadrant. Time (s) 0 200 400 600 800 1000 1200 1400 1600 T e m perature (ºC) 0 5 10 15 20 25 2.4 m 1.9 m 1.4 m 0.9 m 0.4 m
Figure E.7. TC Tree 7 - 1st Storey NE quadrant. Time (s) 0 200 400 600 800 1000 1200 1400 1600 T e m p er at u re (ºC) 0 5 10 15 20 25 2.4 m 1.9 m 1.4 m 0.9 m 0.4 m
Figure E.8. TC Tree 8 - 1st Storey NW quadrant. Time (s) 0 200 400 600 800 1000 1200 1400 1600 T e mp erature (ºC) 0 5 10 15 20 25 2.4 m 1.9 m 1.4 m 0.9 m 0.4 m
Figure E.9. TC Tree 11 - 2nd Storey SE bedroom. Time (s) 0 200 400 600 800 1000 1200 1400 1600 T e mp eratu re (ºC) 0 5 10 15 20 25 2.4 m 1.9 m 1.4 m 0.9 m 0.4 m
Figure E.10. TC Tree 9 - 2nd Storey SW bedroom. Time (s) 0 200 400 600 800 1000 1200 1400 1600 T e m p e rature (ºC ) 0 5 10 15 20 25 2.4 m 1.9 m 1.4 m 0.9 m 0.4 m
Figure E.11. TC Tree 4 - Top of basement stairs. Time (s) 0 200 400 600 800 1000 1200 1400 1600 T e m p er at u re (ºC) 0 10 20 30 40 50 60 2.4 m 1.9 m 1.4 m 0.9 m 0.4 m
Figure E.12. TC Tree 10 - Top of 1st storey stairs. Time (s) 0 200 400 600 800 1000 1200 1400 1600 T e mp erature (ºC) 0 5 10 15 20 25 2.4 m 1.9 m 1.4 m 0.9 m 0.4 m
Figure E.13. TCs - Basement window. Time (s) 0 200 400 600 800 1000 1200 1400 1600 T e m p er at u re (ºC) 0 100 200 300 400 500 600 700 800 900 1000 Top east Top west Top center Center Bottom center
Figure E.14. TCs - Steel columns.
Time (s) 0 200 400 600 800 1000 1200 1400 1600 T e mp erature (ºC) 0 10 20 30 40 50 SW NW SE
Figure E.15. O2 Concentrations. Time (s) 0 200 400 600 800 1000 1200 1400 1600 O2 c o nc en tr a tio ns (% Vo l) 13 14 15 16 17 18 19 20 21 1st storey, 1.5 m 1st storey, 0.9 m 2nd storey stairs, 1.5 m 2nd storey stairs, 0.9 m
Figure E.16. CO2 Concentrations.
Time (s) 0 200 400 600 800 1000 1200 1400 1600 CO 2 concen trations (%Vol) 0.0 0.5 1.0 1.5 1st storey, 1.5 m 1st storey, 0.9 m 2nd storey stairs, 1.5 m 2nd storey stairs, 0.9 m
Figure E.17. CO Concentrations. Time (s) 0 200 400 600 800 1000 1200 1400 1600 C O c o nc entrat ions (%Vol) 0.00 0.01 0.02 0.03 0.04 0.05 1st storey, 1.5 m 1st storey, 0.9 m 2nd storey stairs, 1.5 m 2nd storey stairs, 0.9 m
Figure E.18. Pressure - Fire compartment.
Time (s) 0 200 400 600 800 1000 1200 1400 1600 Pres sure (Pa) 0 25 50 75 100 125 150
Figure E.19. Smokemeters - 1st storey. Time (s) 0 200 400 600 800 1000 1200 1400 1600 Sm oke obscu ra tio n (O.D ./m) 0.0 0.1 0.2 0.3 0.4 0.5 0.6 1.5 m 0.9 m
Figure E.20. Smokemeters - 2nd storey.
Time (s) 0 200 400 600 800 1000 1200 1400 1600 Sm oke obscuratio n (O.D./m) 0.0 0.1 0.2 0.3 0.4 0.5 0.6 1.5 m 0.9 m
Figure E.21. Velocity probes - Top of basement stairs. Time (s) 0 200 400 600 800 1000 1200 1400 1600 Ve lo ci ty (m/ s ) -2 -1 0 1 2 3 4 Ceiling 1.5 m
Figure E.22. Velocity probes - Top of 1st storey stairs. Time (s) 0 200 400 600 800 1000 1200 1400 1600 V e lo ci ty (m /s) -2 -1 0 1 2 3 4 Ceiling 1.5 m
Figure E.23. Velocity probe - Exterior door. Time (s) 0 200 400 600 800 1000 1200 1400 1600 Velocity (m /s) 0.0 0.5 1.0 1.5 2.0
Figure E.24. TC - Exterior door velocity probe. Time (s) 0 200 400 600 800 1000 1200 1400 1600 T e mp eratu re (º C) 0 5 10 15 20
APPENDIX F TEST FS-4 RESULTS
Fire Performance of Houses Test Summary • Test ID: FS-4
• Test Date: March 24, 2005
• Atmospheric Conditions: Temp: -1°C RH: 68% Pres: 101.6 kPa ↑ • Structure Tested: Non-combustible floor assembly
• Fire Load:
sofa at center of basement (9.26 kg foam)
wood crib located 0.20 m behind sofa (58.8 kg, 7% MC)
wood crib located 0.20 m from west side of sofa (65.0 kg, 7% MC) two wood cribs located under the sofa (33.3 kg, 31.3 kg, 7% MC) 80 s ignition with 19 kW burner (13 L/min)
Ignition time after start of data: 62 s
• Doors: SE bedroom door closed / SW bedroom door open Door at top of basement stairs closed
first floor door opened at 180 s
• Basement exterior opening: opened at 105 s when air temperature near it reached 300°C
• Smoke Detector Activation Times:
Activation (time from ignition) Smoke Detector #2, Photoelec., Basement, bottom of stairs 0:30 Smoke Detector #3, Ioniz., 1st Floor, top of stairs 0:50 Smoke Detector #4, Photoelec., 1st Floor, top of stairs 1:00 Smoke Detector #5, Ioniz., 2nd Floor, top of stairs 2:55 Smoke Detector #6, Photoelec., 2nd Floor, top of stairs 3:20 Smoke Detector #7, Ioniz., SE bedroom, closed 13:10 Smoke Detector #8, Photoelec., SE bedroom, closed 16:50 Smoke Detector #9, Ioniz., SW bedroom, open 3:55 Smoke Detector #10, Photoelec., SW bedroom, open 4:15
Figure F.1. TC Tree 1 - Basement SE quadrant. Time (s) 0 200 400 600 800 1000 1200 1400 1600 1800 2000 T e mp era ture (ºC) 0 100 200 300 400 500 600 700 800 900 1000 2.4 m 1.9 m 1.4 m 0.9 m 0.4 m
Figure F.2. TC Tree 12 - Basement SW quadrant. Time (s) 0 200 400 600 800 1000 1200 1400 1600 1800 2000 T e mp er at ur e (ºC) 0 100 200 300 400 500 600 700 800 900 1000 2.4 m 1.9 m 1.4 m 0.9 m 0.4 m
Figure F.3. TC Tree 13 - Basement NE quadrant. Time (s) 0 200 400 600 800 1000 1200 1400 1600 1800 2000 T e m pera ture (ºC) 0 100 200 300 400 500 600 700 800 900 1000 2.4 m 1.9 m 1.4 m 0.9 m 0.4 m
Figure F.4. TC Tree 2 - Basement NW quadrant. Time (s) 0 200 400 600 800 1000 1200 1400 1600 1800 2000 T e mp er at ur e (ºC) 0 100 200 300 400 500 600 700 800 900 1000 2.4 m 1.9 m 1.4 m 0.9 m 0.4 m
Figure F.5. TC Tree 6 - 1st Storey SE quadrant. Time (s) 0 200 400 600 800 1000 1200 1400 1600 1800 2000 T e mperature (ºC) 0 10 20 30 40 50 2.4 m 1.9 m 1.4 m 0.9 m 0.4 m
Figure F.6. TC Tree 5 - 1st Storey SW quadrant. Time (s) 0 200 400 600 800 1000 1200 1400 1600 1800 2000 T e m perature (ºC) 0 10 20 30 40 50 2.4 m 1.9 m 1.4 m 0.9 m 0.4 m
Figure F.7. TC Tree 7 - 1st Storey NE quadrant. Time (s) 0 200 400 600 800 1000 1200 1400 1600 1800 2000 T e m p er at u re (ºC) 0 10 20 30 40 50 2.4 m 1.9 m 1.4 m 0.9 m 0.4 m
Figure F.8. TC Tree 8 - 1st Storey NW quadrant. Time (s) 0 200 400 600 800 1000 1200 1400 1600 1800 2000 T e mp erature (ºC) 0 10 20 30 40 50 2.4 m 1.9 m 1.4 m 0.9 m 0.4 m
Figure F.9. TC Tree 11 - 2nd Storey SE bedroom. Time (s) 0 200 400 600 800 1000 1200 1400 1600 1800 2000 T e mp eratu re (ºC) 0 10 20 30 40 50 2.4 m 1.9 m 1.4 m 0.9 m 0.4 m
Figure F.10. TC Tree 9 - 2nd Storey SW bedroom. Time (s) 0 200 400 600 800 1000 1200 1400 1600 1800 2000 T e m p e rature (ºC ) 0 10 20 30 40 50 2.4 m 1.9 m 1.4 m 0.9 m 0.4 m
Figure F.11. TC Tree 4 - Top of basement stairs. Time (s) 0 200 400 600 800 1000 1200 1400 1600 1800 2000 T e m p er at u re (ºC) 0 10 20 30 40 50 60 2.4 m 1.9 m 1.4 m 0.9 m 0.4 m
Figure F.12. TC Tree 10 - Top of 1st storey stairs. Time (s) 0 200 400 600 800 1000 1200 1400 1600 1800 2000 T e mp erature (ºC) 0 10 20 30 40 50 60 2.4 m 1.9 m 1.4 m 0.9 m 0.4 m
Figure F.13. TCs - Basement window. Time (s) 0 200 400 600 800 1000 1200 1400 1600 1800 2000 T e m p er at u re (ºC) 0 100 200 300 400 500 600 700 800 900 1000 Top east Top west Top center Center Bottom center
Figure F.14. TCs - Steel columns.
Time (s) 0 200 400 600 800 1000 1200 1400 1600 1800 2000 T e mp erature (ºC) 10 20 30 40 50 60 70 80 90 100 SW NW SE
Figure F.15. O2 Concentrations. Time (s) 0 200 400 600 800 1000 1200 1400 1600 1800 2000 O2 c o nc en tr at io n s (%V o l) 13 14 15 16 17 18 19 20 21 1st storey, 1.5 m 1st storey, 0.9 m 2nd storey stairs, 1.5 m 2nd storey stairs, 0.9 m Figure F.16. CO2 Concentrations. Time (s) 0 200 400 600 800 1000 1200 1400 1600 1800 2000 CO 2 con c en tration s (%Vol) 0.0 0.5 1.0 1.5 1st storey, 1.5 m 1st storey, 0.9 m 2nd storey stairs, 1.5 m 2nd storey stairs, 0.9 m
Figure F.17. CO Concentrations. Time (s) 0 200 400 600 800 1000 1200 1400 1600 1800 2000 CO co ncen tration s (%Vol) 0.00 0.01 0.02 0.03 0.04 0.05 0.06 0.07 0.08 0.09 0.10 1st storey, 1.5 m 1st storey, 0.9 m 2nd storey stairs, 1.5 m 2nd storey stairs, 0.9 m
Figure F.18. Pressure - Fire compartment.
Time (s) 0 200 400 600 800 1000 1200 1400 1600 1800 2000 Pres sure (Pa) 0 10 20 30 40 50
Figure F.19. Smokemeters - 1st storey. Time (s) 0 200 400 600 800 1000 1200 1400 1600 1800 2000 Sm oke obscu ra tio n (O.D ./m) 0.0 0.1 0.2 0.3 0.4 0.5 0.6 1.5 m 0.9 m
Figure F.20. Smokemeters - 2nd storey.
Time (s) 0 200 400 600 800 1000 1200 1400 1600 1800 2000 Sm oke obscuratio n (O.D./m) 0.0 0.1 0.2 0.3 0.4 0.5 0.6 1.5 m 0.9 m
Figure F.21. Velocity probes - Top of basement stairs. Time (s) 0 200 400 600 800 1000 1200 1400 1600 1800 2000 Ve lo ci ty (m/ s ) -2 -1 0 1 2 3 4 Ceiling 1.5 m
Figure F.22. Velocity probes - Top of 1st storey stairs. Time (s) 0 200 400 600 800 1000 1200 1400 1600 1800 2000 V e lo ci ty (m /s) -2 -1 0 1 2 3 4 Ceiling 1.5 m
Figure F.23. Velocity probe - Exterior door. Time (s) 0 200 400 600 800 1000 1200 1400 1600 1800 2000 Velocity (m /s) 0.00 0.25 0.50 0.75 1.00 1.25 1.50 1.75
Figure F.24. TC - Exterior door velocity probe. Time (s) 0 200 400 600 800 1000 1200 1400 1600 1800 2000 T e mp eratu re (º C) 0 5 10 15 20 25 30 35 40
Figure F.25. Temperature of Basement Door Time (s) 0 200 400 600 800 1000 1200 1400 1600 1800 2000 T e mp erature (ºC) 0 25 50 75 100 125 150 175 200 1.9 m 1.4 m 0.9 m
Figure F.26 . Differential Pressure, Basement - 1st Floor Time (s) 0 200 400 600 800 1000 1200 1400 1600 1800 2000 Pressure (Pa) -20 -15 -10 -5 0 5 10 15 20
Figure F.27. South Crib Temperatures. Time (s) 0 200 400 600 800 1000 1200 1400 1600 1800 2000 T em pe ra tur e (ºC ) 0 100 200 300 400 500 600 700 800 900 1000 3rd row 7th row Top, center
Figure F.28. East Crib Temperatures.
Time (s) 0 200 400 600 800 1000 1200 1400 1600 1800 2000 T empe ra tur e (ºC) 0 100 200 300 400 500 600 700 800 900 1000 3rd row 7th row Top, center
APPENDIX G DATA PROCESSING ALGORITHM
Thermocouple data are recorded directly in °C and are not converted. Smoke detector data are recorded as voltages and are visually inspected to
determine activation times.
Time is recorded in seconds and is shifted to place the time of ignition at t = 0 s. Basement level fire room pressure (Ch.99) is converted from voltage (V) according
to:
[Pa] = 1 000 * ([V] – 2.43)
Velocity probe data (Ch.101-105) are converted from manometer voltages (V) and nearby temperatures (°C) according to:
[m/s] = 0.07 * (k * [V] * (T + 273.15) )1/2
where k = 1000 or 2000, according to Appendix A, and T is the closest recorded temperature in °C.
Smokemeter obscurations are converted from voltages (V) according to:
[O.D./m] = m * -log([V]) - b
where m and b are constants specific to each smokemeter recorded on its calibration sheet.
Gas concentrations are converted from analyzer currents (mA) according to:
[%Vol] = k * ([mA]-Al) / (Au-Al)
where the constants k, Al and Au are listed in Appendix A for each analyzer (e.g. for
Ch.1, k = 5, Al = 4 and Au = 20). Gas concentration data is also shifted in time by -10