for fouling prevention in membrane distillation
The MIT Faculty has made this article openly available.
Please share
how this access benefits you. Your story matters.
Citation
Warsinger, David M., Amelia Servi, Sarah Van Belleghem, Jocelyn
Gonzalez, Jaichander Swaminathan, Jehad Kharraz, Hyung Won
Chung, Hassan A. Arafat, Karen K. Gleason, and John H. Lienhard V.
“Combining Air Recharging and Membrane Superhydrophobicity for
Fouling Prevention in Membrane Distillation.” Journal of Membrane
Science 505 (May 2016): 241–252.
As Published
http://dx.doi.org/10.1016/j.memsci.2016.01.018
Publisher
Elsevier
Version
Author's final manuscript
Citable link
http://hdl.handle.net/1721.1/105438
Terms of Use
Creative Commons Attribution-Noncommercial-Share Alike
* Corresponding author.
E-mail address: lienhard@mit.edu (J. H. Lienhad V).
D.M. Warsinger, A. Servi, S. Van Belleghem, J. Gonzalez, J. Swaminathan, J. Kharraz, H.W. Chung, H.A. Arafat, K.K. Gleason, and J.H. Lienhard V, “Combined Air Recharging and Membrane Superhydrophobicity for Fouling Prevention in Membrane Distillation,” J. Membrane Sci., online 14 January 2016, 555050005555:241-252, 1 May 2016.
Combining air recharging and membrane superhydrophobicity for
fouling prevention in membrane distillation
David M. Warsinger
a, Amelia Servi
b, Sarah Van Belleghem
a, Jocelyn Gonzalez
a, Jaichander
Swaminathan
a, Jehad Kharraz
c, Hyung Won Chung
a, Hassan A. Arafat
c, Karen K. Gleason
b, John H.
Lienhard V
a*
a Rohsenow Kendall Heat Transfer Laboratory, Department of Mechanical Engineering Massachusetts Institute of Technology, 77 Massachusetts Avenue, Cambridge MA 02139-4307 USA
b Department of Chemical Engineering, Massachusetts Institute of Technology, 77 Massachusetts Avenue, Cambridge MA 02139-4307 USA
c Institute Center for Water and Environment (iWATER), Department of Chemical and Environmental Engineering, Masdar Institute of Science and Technology, Abu Dhabi, United Arab Emirates , PO Box 54224, Abu Dhabi, UAE
* Corresponding Author lienhard@mit.edu
ABSTRACT
In previous studies of the desalination technology membrane distillation (MD), superhydrophobicity of the membrane has been shown to dramatically decrease fouling in adverse conditions, but the mechanism for this is not well understood. Additionally, air layers present on submerged solid superhydrophobic surfaces have been shown to dramatically reduce biofouling, and air-bubbling has been used to reducing fouling in MD. The present work studies the effect of maintaining air layers on the membrane surface and superhydrophobicity as a new method for preventing fouling of MD membranes by salts, particulates, and organic particles. Superhydrophobic MD membranes were prepared using initiated chemical vapor deposition (iCVD) of perfluorodecyl acrylate (PFDA) on poly(vinyldene fluoride) PVDF membranes and used to study the effects of hydrophobicity on fouling. A static MD setup with evaporation through an MD membrane but no condensing of permeate was used to examine the effect of air exposure on fouling, by measuring the increase in weight of the membrane caused by scale deposition. Theory was derived for the reduction of fouling on superhydrophobic surfaces. Air layers may displace fouling gels, reduce the area of feed in contact with the membrane, reduce foulant adhesion, and enhance superhydrophobicity in a Cassie-Baxter state. The study shows that the presence of air on the membrane surface significantly reduces biological fouling, but in some cases had mildly exacerbating effects on fouling of salts, especially when the air was not saturated with water vapor. Air recharging combined with superhydrophobicity reduced fouling in several cases where hydrophobic membranes alone did little.
Keywords: membrane distillation; superhydrophobic surface; air layer; nucleation; anti-fouling
Graphical abstract reduced particle adhesion increased salt nucleation at interface displacement of gel layers air layer superhydrophobic porous membrane solution vapor diffusion detrimental preventative
hot side cold side
Graphical Abstract
1.
Introduction
1.1
Scaling in Membrane Distillation
Membrane distillation is an emerging thermal desalination technology that relies on a porous hydrophobic membrane that passes water vapor but rejects liquid water [1]. Several MD module designs have been developed for reducing the specific energy consumption for desalination. MD can be configured indirect contact [2] or multistage vacuum configurations [3] with energy recovery in external heat exchangers or in air, permeate or conductive gap configuration with internal heat recovery [4] MD is known to be relatively more resistant to scaling of salts compared to other membrane-based desalination processes such as reverse osmosis (RO) [5, 6]. However, the mechanism for this resistance is poorly understood [7]. Fouling of the membrane surface impairs MD performance by blocking the surface, which reduces permeate flux, and may cause wetting of the saline feed through the membrane, contaminating the permeate.
Past studies on superhydrophobic MD membranes have shown extreme resistance to scaling [8, 9], which included a reduction in surface nucleation and particulate attachment [10]. Additionally, past studies on MD have also found that nucleation in the bulk feed fluid contributes significantly to MD fouling [11]. Studies on submerged superhydrophobic surfaces with visible air layers have shown extreme resistance to biofouling [12].
In desalination systems including membrane distillation, several types of scale dominate. Calcium scale, including calcium sulfate and calcium carbonate, are among the least soluble and most problematic inorganic scale in seawater and various groundwater sources [13]. For systems that experience regular dry out such as remote solar thermal desalination, significant sodium chloride is often left behind after evaporation [7], since it is present in such high levels in most waters. Finally, in seawater applications, the remains of algae often cause biological fouling, and in fact the polysaccharide alginate is often used to study algae fouling [14, 15]. Alginate can form a gel layer on membrane surfaces that causes significant diffusion resistance [16].
For inorganic scaling to occur, two steps are involved: first nucleation of crystals from the solution, followed by crystal growth [17]. Crystal growth on stable crystals is spontaneous in saturated solutions [18], so the key to avoiding crystallization is to extend the induction time before nucleation occurs. The degree of saturation is measured by the saturation index (SI), which is a log scale of saturation, where 0 is saturated and 1 is 10 times the saturation concentration [19].
(1)
where Cxis the local concentration and Csat is the saturated concentration.
Previous studies have shown bubbling of air in the MD feed could reduce fouling, which was largely attributed to reduced concentration polarization by increased mixing [20]. Because of the effectiveness of air layers and superhydrophobicity for fouling prevention of MD membranes and other surfaces, as well as the desire to reduce wetting, it is hypothesized in the present work that deliberately introducing air into the MD feed stream periodically could reduce fouling. Under this hypothesis, the air layer formed on the membrane surface may act as a barrier to particulate fouling, reducing the adhesion rate and reducing particle advection to the surface by physically blocking them. The introduction of air may also remove particles which are weakly adhered, as the particles may leave with water that the air displaces. The periodic introduction of air may allow wetted membrane sections to recover lost hydrophobicity, reducing the risk of the feed contaminating the permeate.
In the present study, NaCl, CaSO4, silica, and alginate foulants were each tested in a beaker-based MD setup with different
methods of air exposure. Lifting horizontally and vertically, as well as the introduction of water-vapor saturated air bubbles, were techniques applied to either regular hydrophobic or coated superhydrophobic MD membranes. The rate of scale deposition by mass was used to examine the effect of air recharging on reducing fouling on different types of MD membranes.
1.2
Particulate and Biofouling in MD
The physical behavior of the types of foulants that may be present in the feed water must be understood to predict and explain fouling phenomena.
If particles deposit on the membrane, either from biological fouling, particulate fouling, or bulk nucleation, then the flux of particles to the surface can be modeled as follows, which was previously applied for particulate deposition on RO membranes [21]:
(2)
where Cx is the foulant mass concentration, p is the permeate velocity, δc is the fouling layer average thickness, α is called
the “foulant sticking efficiency,” and t is the time elapsed.
An air layer on the surface of the membrane may alter deposition by blocking foulant from adhering, which may reduce the likelihood that particles convected to the surface will stick to it, thus reducing the foulant sticking efficiency, α. If the air layer is allowed to fully disappear, it will still improve the process by reducing wetting, and thus the depth of water penetrating into the membrane.
Superhydrophobicity may also help remove particulate and organic fouling. Simply, superhydrophobicity reduces the work of adhesion, which more readily allows water to be removed from the surface, where it may carry away other foulants [22]. The work of adhesion is given as:
(3)
where is the work of adhesion and is the receding contact angle [22].
2.
Thermodynamic Theory Derivation for the Impact of Air Layers on Inorganic Fouling
(1)(2)(3)
2.1
Inorganic Fouling and Nucleation Kinetics
2.1.1
Salt Nucleation Induction Time and Thermodynamics
Previous studies have examined the Gibbs energy of formation (∆G*) on the microporous hydrophobic membrane
distillation surfaces as a function of the PVDF-crystal-liquid static contact angle, θpcl. This formation energy is given as
follows, originally derived by Volmer [23, 24]:
(4)
Homogeneous nucleation refers to classical nucleation theory in the pure bulk, which can be derived from the surface energy (proportional to area) and the energy of phase transformation (volumetric) [18]. Meanwhile, heterogeneous nucleation refers to nucleation at interfaces, including on surfaces and particles in the bulk. Studies have shown that heterogeneous nucleation in the bulk dominates in MD, as atmospheric dust and other contaminants still cause bulk heterogeneous nucleation to exceed membrane-surface heterogeneous nucleation or homogeneous nucleation, even in very pure solutions [11]. The equation above shows that heterogeneous nucleation is favored, as its energy barrier is much smaller. As approaches 180°, the approaches the (large) energy barrier for homogeneous nucleation. As approaches 0°, also approaches 0 (Figure 2.
Nucleation induction time is exponentially dependent on the Gibbs free energy barrier; small differences in this barrier can make nucleation much more rapid. The induction time is delay time before readily observable formation of a large number of stable nuclei. The induction time for homogeneous nucleation is
(5)
where N is the number of foulant molecules per unit volume, k is the Boltzmann constant, T is temperature in kelvins, and
A is a pre-exponential factor usually found through experiments [24]. Crucially, the air-water interface can induce heterogeneous nucleation [25, 26, 27, 28], partly because it disturbs the solution and also usually contains a higher quantity of foreign particles that may act as nucleation sizes.
As a result, the presence of air, other surfaces, or colloids may cause heterogeneous nucleation. A fraction of the particles nucleating elsewhere may then deposit on the membrane surface, as seen in equation (2). This may foul MD systems in conditions where the induction time of the membrane and homogeneous nucleation would otherwise be hours or days, long enough to avoid fouling. Therefore, since air layers may block the membrane surface but encourage nucleation, they may either help or hinder fouling: the present study is the first to study both these competing effects.
2.1.2
Deriving a Relationship between Superhydrophobicity and Inorganic Fouling Resistance
Previous experimental observations have linked superhydrophobicity and increased fouling resistance, including a decreased nucleation rate, increased induction time, reduced bacteria absorption, and decreased fouling layer thickness [8, 9]. The link can be seen indirectly in previous work through the use of contact angles and the Good-van Oss-Chaudhury equation to measure surface free energy [29]. As an example here, we derive a direct link between the superhydrophobicity and fouling resistance and use values for the foulant Gypsum which forms crystals on PVDF membranes.
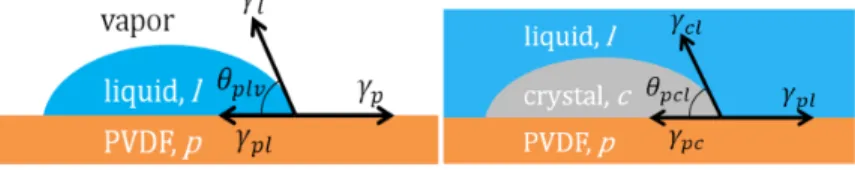
In this derivation, we dissect the two Young’s equations for the contact angles that define superhydrophobicity and the energy barrier of equation (4), seen in Figure 1. These equations [17, 30] represent the easily measured contact angle with the surface, air, and liquid, as well as the contact angle for crystal nucleation, the solid-crystal-liquid contact angle, :
(
6)(7)
The terms in these equations are calculated using the Girifalco-Good-Fowkes equation [31] with the polar term modification by Owens et al. [32, 33]. The comparison between the two angles is made through a key shared term: the free energy of the substrate, p. By linking the two contact angles with substitution through this shared term, the Volmer
equation (4) for Gibbs free energy barrier for nucleation can be directly linked and graphed versus the contact angle that defines superhydrophobicity in Figure 2.
Figure 1. Contact angle liquid-vapor) measured for surface hydrophobicity (top) and the contact angle (surface-crystal-liquid) relevant for the energy barrier for nucleation in equation (4) (bottom).
In Young’s equation, θ is the contact angle of interest, the ’s are surface energies, and the subscripts p, l, and c, represent the PVDF substrate, liquid (salt water), and crystal (gypsum) components [17, 30]. Notably, the surface free energy (e.g., ) is the same as the surface tension between the material and vapor (e.g. ): here the variable without the vapor
subscript will be used for simplicity. The names and values of all these variables are given in , which shows contact angles and surface tensions for the example scenario. [34].
However, not all surface interfacial energies between materials are readily available. Other surface energies can be found by using the Girifalco-Good-Fowkes equation with the polar term modification by Owens et al. This equation for the PVDF and crystal interfacial energy is given as follows:
(8) (8)
where the superscripts d and AB stand for the Van der Waal dispersion contribution and the acid base (polar) contributions, respectively. The acid base contribution can be found with the equation:
(9)
where and are the positive and negative
contributions to the acid base energy. These are usually determined for a surface by simultaneously solving the equation for the Van Oss–Chaudhury–Good approach while using at least three different reference liquids [43]. The modified Girifalco equation can be substituted into the first Young’s equation (6), for eventual substitution into the nucleation energy barrier by Volmer, equation (4):
(10)
The Grifalco equation can also be substituted in to the Young’s equation for the crystal-substrate-liquid contact angle, into both terms in the numerator:
(11) The first Young’s equation (10) for can then be
solved for the dispersion force of the membrane, ,
which can then be substituted in where this term appears in the second Young’s equation (11) for . Almost all the other terms are functions of liquid water, which is unaffected by a change in hydrophobicity, or equivlently, . The acid base term, , also may vary with , but is relatively small for PVDF and would exhibit the same trend, so this
approximation is acceptable.
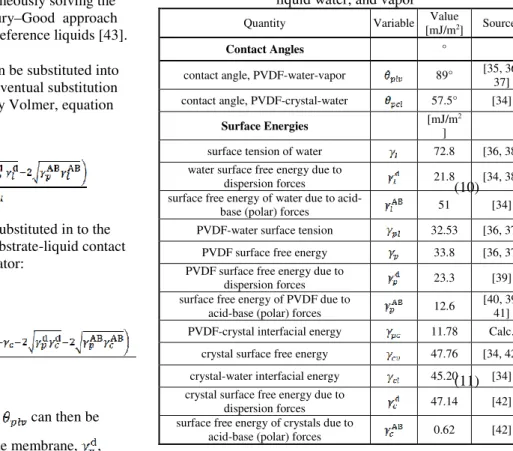
Table 2.1. Surface energy variables and values for CaSO4, liquid water, and vapor
Quantity Variable Value
[mJ/m2] Sources
Contact Angles °
contact angle, PVDF-water-vapor 89° [35, 36, 37] contact angle, PVDF-crystal-water 57.5° [34]
Surface Energies [mJ/m
2
]
surface tension of water 72.8 [36, 38] water surface free energy due to
dispersion forces 21.8 [34, 38] surface free energy of water due to
acid-base (polar) forces 51 [34] PVDF-water surface tension 32.53 [36, 37]
PVDF surface free energy 33.8 [36, 37] PVDF surface free energy due to
dispersion forces 23.3 [39] surface free energy of PVDF due to
acid-base (polar) forces 12.6
[40, 39, 41] PVDF-crystal interfacial energy 11.78 Calc.
crystal surface free energy 47.76 [34, 42] crystal-water interfacial energy 45.20 [34] crystal surface free energy due to
dispersion forces 47.14 [42] surface free energy of crystals due to
(12a)
In words, this equation can be broken in three parts in the numerator:
(12b) Here, in equation (12), the direct relationship between the contact angle that describes hydrophobicity, , and angle for the Volmer equation (4) is shown.
As the surface becomes more hydrophobic, approaches negative 1, causing to decrease as well. The acid base terms are small for the gypsum-PVDF system, so the term with has a dominating effect on the other angle, . As approaches -1, the Gibbs free energy barrier for heterogeneous nucleation aproaches that for homogeneous nucleation, as seen in equation (4). Because homogeneous nucleation has a high energy barrier and does not occur readily, this means that nucleation of both types becomes unlikely as the surface becomes more hydrophobic. Equation (12) may be substituted into equation (4), and the result is graphed in Figure 2. .
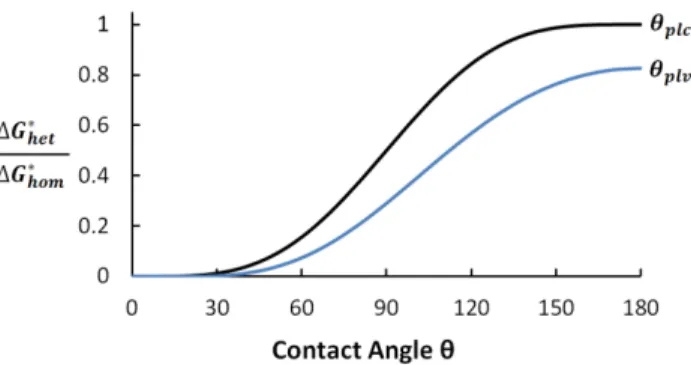
Figure 2. Energy of formation of a critical nucleus versus two contact angles: the substrate-crystal-liquid contact angle (equation 7) and the substrate-liquid-vapor contact angle (which describes hydrophobicity) for PVDF and gypsum
CaSO4 (equation 6) .
Figure 2. shows that for larger values of either contact angle, the Gibbs free energy required to nucleate on the membrane surface is increased, approaching that required for homogeneous nucleation in the bulk liquid. This means that MD membranes with large contact angles are not favored as a location for nucleation. Heterogeneous nucleation, however, can still occur on any small foreign particles in the bulk liquid, and it would be favored over either homogeneous nucleation in the bulk or heterogeneous nucleation on the membrane surface [43]. In fact, studies examining mechanisms of CaSO4
fouling have found that colloidal fouling from the bulk dominates, which can be modelled with Extended Dejaguin−Landau−Verwey−Overbeek (XDLVO) theory [29].
There are several important caveats for this calculation seen in Figure 2. . Different studies often disagree on the values for surface tensions. For the present analysis, multiple references were compared to find two or more sources with values that were in agreement, and studies with more test liquids were prioritized. Additionally, the constraints of the Young equation
for all three contact angles and Girifalco-Good equation were checked to ensure self-consistency. The analysis (and Young’s equation) neglects surface roughness, which is expected to decrease the Gibbs free energy barrier by providing more volume without increasing liquid-solid surface area, assuming a nonwetting Cassie-Baxter regime. Other factors such as functional groups on surfaces as well as surface topography also play a roll. Finally, these results embody the limitations of classical nucleation theory.
2.2
Effect of Roughness and Air Layers on Superhydrophobicity
The periodic introduction of air onto a membrane surface can help maintain a larger area fraction of the surface that contains air. For hydrophobic surfaces where the water does not fully wet into the surface, such as MD membranes, the hydrophobicity can be modeled with the Cassie-Baxter approach.
Figure 3. Droplet on a rough surface, where the liquid does not wet fully.
The contact angle measuring hydrophobicity for surfaces with Cassie-Baxter nonwetting is measured as a weighted average of the components of the surface, in this case the highly hydrophobic air, and the membrane surface (Figure 3). The equation is as follows:
(13)
To the extent that the surface is mixed between these types at a length scale smaller than the critical nucleus, the angle may be applied to the nucleation energy barrier equation (12) in the previous chapter, 2.1.2. For CaSO4
fouling on a PVDF membrane, this is an acceptable assumption. At very high supersaturation however, the critical nucleus may be as small as a few hundred molecules, so the effective angle may lie somewhere in between and
. Previous studies on fouling use the advancing contact angle on a Cassie-Baxter surface to estimate the true contact angle relevant for the other analysis [29].
3.
Methodology
3.1
Static membrane distillation setup
A static MD setup was created to analyze the effect of introducing air layers to reduce fouling. This simple set up lacks water recovery like a full MD system; instead, it simply analyzes the effect of air layers on an MD membrane that separates a hot well-mixed saline solution from turbulent dry air. This design allows for typical MD conditions on the feed side, while allowing for rapid results and more precise weight measurement of foulants.
In a static MD setup (Figure 4), the MD membrane rests on the surface of a beaker, with various foulants in the water. A stirrer keeps the solution well mixed, and a hot plate with temperature controls keeps it at a constant temperature. A fan situated one meter away from the apparatus blows arid air over the system. Fouling was observed by weighing the membrane before and after running the experiment. After the experiment, the weight was measured twice to account for water remaining on the membrane: first, a few seconds after the experiment to weigh water left clinging to the membrane, and again a few hours later to measure the dry weight. The three weights were then compared, using the salt concentration of the water on the membrane surface, to determine how much weight of salt precipitated onto the membrane during the MD process itself and how much was added by foulants in water remaining on the surface.
Droplet on rough surface
The static setup was validated as a good representation of the feed-side thermo-fluids and heat transfer effects in MD with a direct comparison to full-apparatus MD conditions, by comparing to fouling results in AGMD from [11]. The system had similar average feed bulk velocity, permeate flux, and temperatures as full MD systems. A stirrer kept the feed well mixed and at a similar average velocity to full-MD setups. The evaporation rate (~5 LMH) was similar to that in [11] when a more realistic temperature difference (∆T) between feed and hot side is used. Temperature and concentration polarization effects in the feed were very similar to that of [11] operated at lower ∆T. The concentrations where significant fouling was observed with CaSO4 in these trials correlated with those from [11] where flux decline and wetting occurred.
Figure 4. Experimental setup of evaporation and scaling through a MD membrane
The experiment took place under a fume hood with consistent conditions between trials. A humidity meter was placed inside plate was well insulated with a 2.5 cm thick foam insulation sheet so that it would not significantly warm the air circulated by the fan. For temperature readings, measurement was done with a handheld Omega Microprocessor Thermometer, Model HH23, with a type J-K-T thermocouple. Humidity was measured with an Avianweb Digital Mini Instant-Read Temperature and Humidity Gauge, part number B00U2S6JSC.
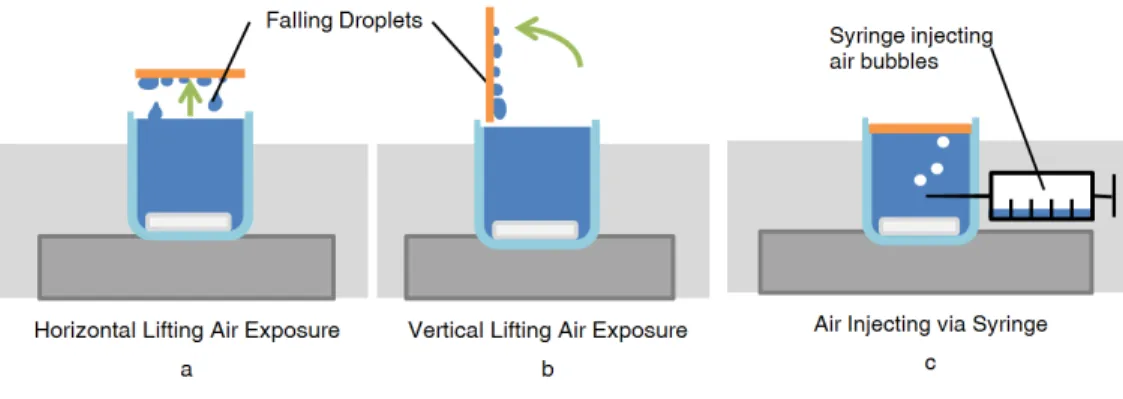
Figure 5. Methods for air recharging examined in the experiment
Several different methods of air recharging were tried. This ensured that variables outside the scope of study, such as the evaporation of water on the membrane surface during air recharging, did not affect the results. In the lifting methods (5 a and b), the membrane is gently lifted vertically, and the saline water rolls off the hydrophobic surface back into the solution. The vertical lifting case allowed more water droplets to roll off the surface than did the horizontal lifting. For the syringe method (5c), saturated air bubbles were injected periodically near the center of the device, 5 mL per injection. The syringe contained water to ensure saturation. The added air to the small 80 mL beaker caused the membrane to briefly lose touch with the surface. These methods all rely on displacement of water from the membrane under short time periods, rather than evaporation.
The air recharging was done by periodically lifting the membrane off of the surface for a specific duration and frequency. A lift time of 10 seconds was used as this was sufficient for most of the water to drain off due to gravity, but not so long such that significant dry out by evaporation would occur on the membrane surface. A variety of configurations and lifting frequencies was examined to determine which was the most effective. A horizontal lift position (Fig. 3a) means that the membrane was lifted without any tilting, whereas a vertical lifting configuration (Fig. 3b) rotated the membrane 90°. Lifting was done with tweezers, with two ~0.5 mm small lift tabs cut into the edges of the original membrane, ~0.5 mm x 0.5 mm. Trials each lasted one hour. Condensate flux was measured by volume change in the beaker. This volume change was a small fraction of overall volume on the time scales studies, avoiding any significant effects of changing water height. The experimental cases considered are summarized in Table 3.1, and values of related variables are given in Table 3.2.
Several foulants were examined. NaCl and CaSO4 are common salts that scale in desalination systems, silica is a common
inorganic foulant, and alginate is a component of biofouling from algae, which forms a fouling gel layer. The concentrations of the salts were chosen to be supersaturated at the membrane surface, except for some of the NaCl cases. For the colloids Silica and Alginate, concentrations known to produce fouling in MD systems were chosen. All substances were reagent grade from Sigma-Aldrich, and prepared with DI water. All hydrophobic cases (tests A and B) used the PVDF membrane, and all superhydrophobic cases (tests C and D) used the same PVDF membrane coated with PFDA via iCVD. All superhydrophobic samples used were created during one iCVD experiment run, ensuring nearly identical properties.
Table 3.2. Experimental Variables
Variables Symbol Values Uncertainty temperature Tf,in 60°C ±3°C
humidity mf,in 30% ±5%
condensate flux ṁp 5 LMH ±0.5 LMH
stirrer rotation ω 60 rpm ±1 rpm membrane area A 19.63 cm2 –
3.2
Superhydrophobic Membrane Preparation and Testing
The hydrophobic membranes were commercial polyvinylidene fluoride (PVDF) membranes (Millipore Immobilon-PSQ, 0.2 μm pore size, part # ISEQ 000 10). The superhydrophobic membranes were prepared using the same PVDF membranes treated with a conformal coating of poly-(1H,1H,2H,2H-perfluorodecyl acrylate) (PPFDA). The coating was produced using initiated chemical vapor deposition (iCVD). iCVD of the PPFDA was conducted using a custom-built reactor using a process described previously [44]. iCVD of PPFDA has been previously used to create hydrophobic, conformal coating on membranes [45, 46].
PFDA monomer (97% Sigma-Aldrich) and t-butyl peroxide initiator (TBPO) (98% Sigma-Aldrich) were used without further purification. The monomer was heated to 80 °C and fed into the chamber at a rate of 0.03 sccm(standard cubic centimeter per minute). The initiator was kept at room temperature and was fed into the chamber at a rate of 1.0 sccm. The total pressure in the chamber was maintained at 45 mTorr throughout the deposition using a mechanical pump (45 CFM pumping speed, Alcatel). The reactor was equipped with an array of 14 parallel filaments (80% Ni, 20% Cr) resistively heated to 210 °C. The membranes were placed on a stage that was maintained at 30 °C using a recirculating chiller/heater (NESLAB). A 200 nm thick PFDA film was deposited after which the filaments were turned off and deposition was halted. The deposition rate was 1.8 nm/min.
Contact angles of water on the membrane surfaces were measured using a goniometer equipped with an automatic dispenser (model 590, Ramé-Hart). DropImage software was used to acquire images for measurement. A 3 µL drop of room-temperature DI water was first placed onto the membrane surface. The contact angle of the drop on the surface was measured at this time to determine the static contact angle. Water was then added to this drop in increments of 2 µL, and the angle between the advancing drop and the membrane surface was measured 1 second after each addition. The maximum of these measured angles was considered the advancing contact angle. Receding contact angle was measured by removing 2 µL of water at a time from the drop and measuring the angle between the receding drop and the surface 1 second after each removal. The lowest value observed was the receding contact angle. Measurements on at least five locations on each membrane were taken and averaged.
Air permeability was measured using a custom setup. A syringe-pump (PHD 22/2000, Harvard Apparatus) was used to push room-temperature air through a membrane held in a membrane holder (GE healthcare biosciences) at a rate of 210 mL/min. While the air was being pushed through the membrane, the pressure difference across the membrane was monitored using a USB pressure transducer with a precision of +/- 0.03 kPa (PX409, Omega). This pressure difference was used to calculate the permeability to air of the membranes.
Scanning electron microscope (SEM) images (JEOL 6010a) and a porosity test were used to verify the conformity of the coating, and SEM was also used to study scaling after the tests.
4.
Results and Discussion
4.1
Superhydrophobic membranes and their properties
The effect of the PPFDA coating on the PVDF membranes was determined by measuring contact angles and air permeability and taking SEM images of the membranes before and after coating. As expected, the PPFDA coating increased the hydrophobicity of the membranes (Table 4.1), Advancing and static contact angles increased from hydrophobic to superhydrophobic (increases of 11° and 22° respectively). Receding contact angle had the most significant increase, transforming from less than to greater than 90° (an increase of 78°). These results were more dramatic than expected considering that both PVDF and PPFDA are fluorinated polymers. While PVDF has CF2 groups that alternate
with CH2 moieties, The PPFDA has a perfluorinate sidechain, (CF2)7CF3 which orient toward interfaces with air. The
terminal –CF3 group reduces surface energy further than CF2. The PPFDA sidechains also form a semi-crystalline structure
which prevents the fluorine atoms from orienting away from water after contact [47]. This feature may explain why the PPFDA-coated membranes have hydrophobic receding contact angles unlike the uncoated PVDF membranes. For both membranes, the contact angles measured on the membranes are affected by the roughness of the surface and are significantly higher than the same chemistry would be if measured on a flat surface. Crucially, regarding the work of adhesion for particulate fouling, it is the receding contact angle that matters [22], while for resistance to nucleation of inorganic fouling, the intrinsic angle matters (which is often approximated by the advancing contact angle).
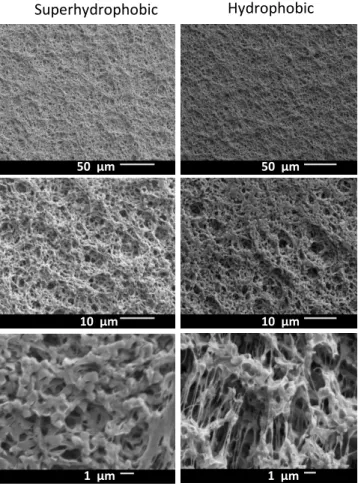
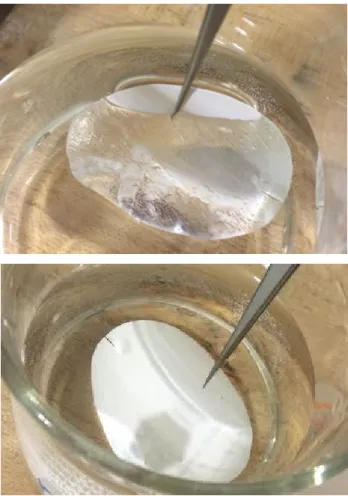
Air permeability was measured (Table 4.1) and SEM images of the membranes were taken before and after coating (Figure 6) to verify the conformity of the coatings. The minor change in air permeability (< 7.5%) suggests that the coating did not significantly alter the total porosity or pore structure of the membranes. The hydrophobicity of the membranes after iCVD coating was also further illustrated by observation of an air layer during submersion in water (Figure 7).
Table 4.1. Summary of MD membrane properties used in this study. The membranes are commercial PVDF membranes used as received. The membranes are the PVDF membranes coated with PPFDA using iCVD.
Membrane Air permeability (kg/m2-Pa-s)
Advancing contact angle (°)
Static contact angle (°)
Receding contact angle (°)
Superhydrophobic 2.96E-06 156 157 134
Hydrophobic 3.19E-06 145 125 56
For each angle measurement, 4 or 5 trials were performed, with a standard deviation between 2.1° and 11.9°. However, it is clear that the coated membranes have significantly higher receding contact angles than the uncoated membrane. Both membranes had a porosity of 80%.
Table 4.2. Standard deviation of selected trials for the measurement of MD membrane contact angles Standard deviation
Membrane # Trials Static contact angle (°) Advancing contact angle (°) Receding contact angle (°) Superhydrophobic 4 4.39 2.89 2.12
Figure 6. SEM images of MD membrane surface. The coating layer of PPFDA deposited by iCVD on the membranes does not significantly decrease porosity, and does not drastically change the membrane surface structure.
Superhydrophobic
Hydrophobic
50 μm 50 μm
10 μm 10 μm
Figure 7. Photograph of submerged superhydrophobic MD membrane (left) and submerged uncoated hydrophobic membrane (right). The membrane is visibly shiny due to the thin air layer on its surface
4.2
Scaling Results
The effectiveness of the air recharging and membrane superhydrophobicity were measured by the mass of salt adhered to the membrane after the experiment. SEM was performed as well for select cases. The salinity is characterized by the Saturation Index (SI), a log scale with 0 being saturated. The concentration was determined by measuring salt added with a mass scale, and the saturation concentration was calculated using the software PHREEQC (version 3) by USGS.
In the case of NaCl scaling, shown in Figure 8, the air recharging trials with lifting consistently had more salt adhered to the membrane. As the water contains a high fraction of NaCl, water evaporating off the membrane after the experiment was over (dry out) left significant amounts of NaCl on the membrane, increasing the overall error.
Figure 8. SI vs Mass Added, NaCl, horizontal lifting. (Trials 1, 3 and 4)
Notably, the total salt adherence for the trials with added air had similar masses added, regardless of the membrane used. This may suggest that nucleation in the bulk, not on the membrane itself, dominated over any nucleation or crystal growth at the membrane, a result found in previous MD studies [11]. Bulk conditions do not depend on the membrane, and particles in the bulk may then precipitate on the membrane, increasing its mass. This aligns with the expected thermodynamics of MD systems with added air, where scaling on the hydrophobic membrane is relatively unfavorable but heterogeneous scaling at the air-liquid interface may be significant. This interface nucleation occurs both because disturbances such as moving bubbles tends to encourage nucleation, and because any insoluble contaminants tend to migrate to these interfaces, which can act as nuclei for nucleation.
NaCl salt crystals can be seen in Figure 9. These crystals span multiple orders of magnitude. Notably, there were few crystals visible embedded deep into the pores, likely because of minimal wetting of the water into the superhydrophobic surface. This is very desirable, as crystals forming in the pores have been shown to cause wetting, contaminating the permeate [7]. Since crystal growth is much more thermodynamically favorable on the crystals themselves rather than the membrane, most of the membrane surface is not blocked by any crystal.
No differences were seen between the vertical and horizontal lifting methods of adding air (trials 1-4). Evaporation into the air during lifting may leave salt crystals behind, but this can be avoided if the air is supersaturated and is at least at the temperature of the feed solution. The salt deposition was compared between the brief 10 second lifting periods, and with the syringe containing hot saturated air. Both trials showed that the air addition to NaCl exacerbated scale deposition, and repeated experiments confirmed that result. The salt deposition was reduced with the hot saturated air, but did not appear dominant as the mass added changed little.
Figure 9. SEM Images of the superhydrophobic PVDF membrane after air recharging, in a solution with 30% NaCl, with vertical lifting. (Trial 4)
However, in the case of air added with the syringe, the results were much different for NaCl (Figure 10). Little salt adhered to the membrane during operation in the air recharging cases. However, the salt masses added during dry-out after ending the experiment were large, due to the high concentration of NaCl leaving significant mass behind as it evaporated. This created high uncertainty and large error bars for NaCl compared to the other foulants. Notably, the air added with the syringe is saturated with water vapor while the air exposed to the surface in the lifting trials is sub-saturated. In those lifting trials, significant evaporation may occur during operation, leaving salts on the surface, thus explaining the detrimental effect of air layers in that case as opposed to the saturated case.
Figure 10. Mass of Salt Adhering to MD Membrane, 25% NaCl with syringe (Trial 8). Includes trials for hydrophobic “H”, superhydrophobic “Super H,” air recharging “air,” and no air recharging, “none.”
The frequency of air recharging was varied as well (trials 1 and 2), but this did not show significant differences over the range of frequencies examined.
Figure 11. Mass of Salt Adhering to MD Membrane, CaSO4 (Trial 5).
For the CaSO4 trials, the introduction of air had a varied effect in reducing fouling, where it helped in the superhydrophobic
case, but made things worse for the control, as seen in Figure 11. However, the trials without air recharging did not vary substantially from one another, while the trials with air recharging did. The superhydrophobic membrane shows a vast reduction in salt mass relative to the hydrophobic case. The superhydrophobic membranes were able to sustain a substantially thicker air layer as seen in the image of Figure 7, and the superior buffering effect of this layer may be the reason for the difference. Meanwhile, as in the NaCl experiments, the introduction of air may have caused heterogeneous nucleation at the interface, increasing the salt adherence in the hydrophobic case. Because of the low solubility of CaSO4
in water and thus the small concentration, the calcium sulfate salt deposited while drying the membrane was minimal, reducing the uncertainties. The differing fouling effects for hydrophobic air recharging (test B only) of the salts NaCl and CaSO4 (Figure 10 and Figure 11)is interesting, and it may be related to several factors. First, the hydrophobic case is less
water repelling, and thus may benefit less from air layers. Second, the induction times of the salts may differ: calcium sulfate is known for its particularly long induction times [48]. Calcium sulfate also tends to form long needle-like structures, compared to the more squat structures of NaCl. Other factors may also have an influence: less salt was deposited in the CaSO4 trials, the crystal growth rates of the salt vary, and the salinity for the NaCl experiments is large enough to
affect water properties such as surface tension, which the presence of crystals may affect as well [49]. Since the hydrophobic case of CaSO4 with air layers performed poorly, it is likely that the difference is not related to nucleation in
the induced from the air, as that would have been the same. However, there is insufficient data to explain this trend adequately, so no speculations are made here.
For the case of Silica, the superhydrophobic membrane fared worse, but improved with air layers (Figure 12). However, this improvement still had similar and slightly worse performance than the control.
For the deposition of Silica compounds, generally, polymerization of silicic acid by dehydration occurs, including cross-linking and aggregation by Van der Waals forces, creating negatively charged colloids [50]. The aggregation leads to soft gels on the membrane surface [50]. Only in this trial did the superhydrophobic surface perform worse that the control surface. Perhaps the surface plays a role in the coalescing steps. Alternatively, superhydrophobic surfaces are known to have a lower charge density [51], and thus may repel these negatively charged colloids less, causing a relative increase in colloidal adherence to the membrane.
Figure 13. Weight of Alginate Adhered to MD Membrane, 0.04% Alginate, CaCl2 (Trial 7)
The introduction and maintenance of air layers on the membrane surface caused a profound and consistent reduction in biofouling of alginate (Figure 13). Alginate, which forms a gel in the presence of calcium [52], does not follow classical crystalline nucleation. These large molecules are already colloids, and so do not have a prolonged induction time like nucleating salts [53]; given sufficient minimum concentration, gels form in a matter of seconds. Therefore, the induction of nucleation by air layers was not a factor. The air layers were thus able to reduce the contact area and adherence of the gel, substantially reducing fouling. The introduction of air may act to displace the gel, which given its internal cohesion, may peel off almost entirely. In the experiments there was barely any visible gel adhered in the air recharging cases.
Notably, while Ca2+ is part of the gel, no scaling of CaCl
2 occurred here, as it is extremely soluble and was orders of
magnitude below saturation concentrations. This result shows that air layers may be helpful in reducing biofouling in MD, which is particularly important for MD because the hydrophobicity of MD membranes tends to make them oleophilic [5]. These experiments on a diverse variety of foulants give an overall picture for how air layers impact fouling in MD. As discussed in the introduction, nucleation thermodynamics indicate that the air-water interface encourages heterogeneous nucleation more than hydrophobic microporous membranes do [23, 24]. Furthermore, several experiments in the literature have shown the presence of air interfaces to encourage nucleation [25, 26, 27], and [28]. Nucleation is the initial step, and typically the limiting step for salt scaling, although does not describe gel formation of alginate biofilms [14].
Some other notable trends were observed as well. Solutions with a larger mass fraction of foulant had larger masses adhered to the membrane. In fact, the total average mass added, when ordered, has the same ordering as that of the mass fraction of foulant: NaCl, Silica, CaSO4, and finally Alginate. Solutions with a smaller mass fraction of foulant also
benefitted more from the presence of air layers. A related trend: the foulants showing the biggest reduction in the presence of air layers were the ones that were the least soluble.
A summary of the results is shown given in Table 4.3.
Table 4.3. Summary of the effect of air layers (with saturated vapor) and superhydrophobicity on mass of foulant left on the membrane, compared to the hydrophobic control
Effect of Air Layers Effect of Super-hydrophobicity Effect of Both NaCl 86.5% +18% -50-99%* CaSO4 +371% +8.2% -59% Silica 23% 230% 55% Alginate -96% -24% -95%
In Table 4.3., darker red indicates significant increases in foulant mass adhered to the membrane, while dark green indicates significant reduction in fouling mass. The air layers provided extreme benefits in the prevention of biofouling. The * indicate where error bars were too large to truly know the result. Notably, when the air exposure is by lifting with exposure to colder (~25°C) air not saturated with water vapor, the air layers significantly hindered the processes instead of helping, increasing salt deposition by as much as 500%.
5.
Conclusion
The introduction of air layers had significant but varied effects, depending on the foulant studied and method of air addition. In the case of NaCl exposed to colder arid air, and for CaSO4 with a less hydrophobic membrane, air layers
worsened fouling, increasing the amount of mass left on the membrane. However, biofouling, studied with alginate and calcium ions, had the opposite effect. The air layers reduced fouling by as much as 96%. The introduction of air layers also reduced fouling for superhydrophobic membranes paired with NaCl, calcium sulfate and colloidal silica. However, the improved value for silica was still worse than the control membrane. The anti-fouling effects and exacerbating-fouling effects can be explained by two separate mechanisms:
The presence of air layers reduces the membrane area in contact with the solution, preventing fouling on hydrophobic and especially superhydrophobic surfaces. These results indicate that maintaining air layers on MD membranes can dramatically reduce biofouling, but with varied and often detrimental results to preventing inorganic scale. This may suggests that studies from the literature encouraging air bubbling to reduce fouling by concentration polarization reduction should be viewed with caution, and designed to ensure saturated warm air in the bubbles.
A second mechanism explains the observed increased fouling for salts but decreased biofouling: nucleation of salts at the air-water interface. The thermodynamics of nucleation support this idea: the Gibbs free energy barrier for heterogeneous nucleation at interfaces is much lower than that of the membrane. Furthermore, numerous studies in the literature have observed heterogeneous nucleation preferentially occurring at air-water interfaces. Another mechanism may worsen fouling as well: evaporation of water during the introduction of air layers, which can leave crystals behind.
No change
3x
Increase
reduction
100%
reduction
color key
6.
Acknowledgement
This work was funded by the Cooperative Agreement between the Masdar Institute of Science and Technology (Masdar University), Abu Dhabi, UAE and the Massachusetts Institute of Technology (MIT), Cambridge, MA, USA, Reference No. 02/MI/MI/CP/11/07633/GEN/G/00. This work made use of the Cornell Center for Materials Research Shared Facilities which are supported through the NSF MRSEC program (DMR-1120296).
The authors would like to thank Allen Myerson, You Peng, Emily Tow, McCall Huston, and Grace Connors for their contributions to this work.
Nomenclature
α foulant sticking efficiency [-] δc fouling layer average thickness [m]
γ surface energy [mJ/m2] θ contact angle [°] ω stirrer rotation rate [rpm]
Øp area fraction of drop in contact with the surface
A experimental pre-exponential factor Am membrane area [cm2]
CX salt concentration [g/mL] k Boltzmann constant [m2 kg/s2 K] ṁp condensate flux [kg/hr]
N number of particles per unit volume [mols/L] tinduction induction time [s]
T temperature [K] vp permeate velocity [m/s]
Wadh adhesion [mJ/m2]
∆G* Gibbs Free Energy barrier for formation of a stable nucleus [J] SI Saturation Index [-]
()p PVDF membrane
()c crystal ()l liquid
()d dispersion forces
()AB acid-base (polar) forces
()+ positive contribution to acid-base forces
7.
Supplemental Material
7.1
Nucleation Energy Barrier
Figure 14. Plot of the energy barrier of formation ΔG* versus r, the radius of minimum stable crystal nuclei, with examples of membrane and surface heterogeneous nucleation, adapted from (Ragone, 1994)
As seen in Figure 14, the energy barrier for heterogeneous nucleation is much smaller than that of homogeneous nucleation. As the induction time is exponentially related to the Gibbs free energy to form a minimum stable nucleus, it can be expected that most nucleation will be heterogeneous, if surfaces, particles, or interfaces are present to cause it.
7.2
Contact angle testing
Table 7.1. Selected trials for the measurement of MD membrane contact angles Standard deviation
Membrane # Trials Static contact angle (°) Advancing contact angle (°) Receding** contact angle (°) Superhydrophobic 4 4.39 2.89 2.12
Hydrophobic 5 8.11 11.86 8.19
7.3
Calculation of Salt left from Operation, using original, wet, and dry weights
Three mass measurements are made of the membrane, and are numbered in chronological order. The mass of the membrane before the experiment is . The mass of the membrane just moments after the experiment is ended (~30 seconds) is , and includes mass added from water droplets adhered to the membrane. The third mass, , is measured after all water has evaporated from the membrane surface (4+ hours after removal). The mass of foulant left by evaporation of adhered water droplets can be calculated from the first two masses, and the concentration of salt, as follows.
The mass of foulant that sticks to the membrane during MD operation, , is calculated as follows:
In the graphs presented, , is shown in orange, and is shown in red.
Figure 15. Weight of Salt Adhered to Static MD Membrane, 20% NaCl (Trial 1)
7.4
Additional Experimental Data
Figure 16. Weight of Salt Adhered to MD Membrane, 25% NaCl (Trial 3)
The salt from operation refers to precipitation while membrane distillation is ongoing, while dry-out refers to salt left from adhered water, which dries after the experiment is over. As seen in Figure 15 and Figure 16, significant salt was left by dryout (shown in red). This is significant due to the very high solubility of NaCl in water, making the mass fraction of the water very high (e.g. 25%). As a result, water evaporating off the membrane after the experiment contains significant salt, leaving a large mass behind in dry out.
Figure 17. Weight of Salt Adhered to MD Membrane, Silica and Alginate (Trial 9), assuming gel fouling layer is 1% Silica
Figure 18. Weight of Salt Adhered to MD Membrane from operation only, Silica and Alginate (Trial 9), assuming gel fouling layer is 1% Silica
In Figure 17 and Figure 18, the results of a trial of multiple foulants is shown. The results include Alginate, CaCl2, and
Silica, and the same concentrations run elsewhere in the study. The foulants from operation graph is separated out in a separate graph since it is very small compared to that from running the experiment. There is a key difficulty in determining the exact masses adhered, which is why these results are merely in the appendix: without knowing the relative composition of the fouling layer, the masses are under-defined. Here, assuming that 1% or less of the fouling layer was Silica showed that like in the previous alginate experiments, the introduction of air layers dramatically reduces fouling. However, if the foulant layer contains the same concentration of Silica as in the bulk, the results are nonsensical, with negative mass quantities adhered (Figure 19). All reasonable assumptions (without highly negative resulting values) showed that the air layers significantly reduced fouling despite the presence of Silica. Notably, Silica may also reduce the adherence of alginate gels to the membrane surface.
This mixed trial excluded CaSO4 and NaCl for a few important reasons. The alginate gels crosslink in the presence
of Ca2+, which displaces Na+ in the chains. Therefore, adding CaSO
4 would significantly strengthen the gel layers, whereas
foulants uncertain, and comparisons to the previous trials invalid. Additionally, reducing the complexity allows for better understanding of the results.
Figure 19. Weight of Salt Adhered to MD Membrane from operation only, Silica and Alginate (Trial 9), assuming gel fouling layer is 15% Silica (the bulk concentration)
8.
References
[1] D. Warsinger, J. Swaminathan, L. Maswadeh, and J. H. Lienhard V, “Superhydrophobic condenser surfaces for air gap membrane distillation,” Journal of Membrane Science, vol. 492, pp. 578–587, 2015.
[2] J. Swaminathan, H. W. Chung, D. M. Warsinger, and J. H. Lienhard V, “Simple method for balancing direct contact membrane distillation,” Desalination, vol. 383, pp. 53–59, 2016.
[3] H. W. Chung, J. Swaminathan, D. Warsinger, and J. H. Lienhard V, “Multistage vacuum membrane distillation (MSVMD) system for high salinity application,” Journal of Membrane Science, vol. 497, pp. 128–141, 2016. DOI: 10.1016/j.memsci.2015.09.009
[4] J. Swaminathan, H. W. Chung, D. M. Warsinger, F. A. Al-Marzooqi, A. H. Arafat, and J. H. Lienhard V, “Energy efficiency of permeate gap and novel conductive gap membrane distillation,” Journal of Membrane Science, vol. 502, pp. 171–178, 2016. DOI: doi: doi:10.1016/j.memsci.2015.12.017
[5] D. M. Warsinger, J. Swaminathan, E. Guillen-Burrieza, H. A. Arafat, and J. H. Lienhard V, “Scaling and fouling in membrane distillation for desalination applications: A review,” Desalination, vol. 356, pp. 294–313, 2014. URL: http://-www.sciencedirect.com/science/article/pii/S0011916414003634. DOI: doi: http://dx.doi.org/10.1016/j.desal.2014.06.031 [6] S. Goh, J. Zhang, Y. Liu, and A. G. Fane, “Fouling and wetting in membrane distillation (MD) and MD-bioreactor (MDBR) for wastewater reclamation,” Desalination, vol. 323, pp. 39–47, 2013.
[7] E. Guillen-Burrieza, R. Thomas, B. Mansoor, D. Johnson, N. Hilal, and H. A. Arafat, “Effect of dry-out on the fouling of PVDF and PTFE membranes under conditions simulating intermittent seawater membrane distillation (SWMD),” Journal of Membrane Science, vol. 438, pp. 126–139, 2013. URL: http://linkinghub.elsevier.com/retrieve/pii/-S0376738813002093. DOI: doi: 10.1016/j.memsci.2013.03.014
[8] A. Razmjou, E. Arifin, G. Dong, J. Mansouri, and V. Chen, “Superhydrophobic modification of TiO2
nanocomposite PVDF membranes for applications in membrane distillation,” Journal of Membrane Science, vol. 415-416, pp. 850–863, 2012. URL: http://linkinghub.elsevier.com/retrieve/pii/S0376738812004632. DOI: 10.1016/j.memsci.2012.06.004
[9] Z. Ma, Y. Hong, L. Ma, and M. Su, “Superhydrophobic membranes with ordered arrays of nanospiked microchannels for water desalination,” Langmuir : the ACS journal of surfaces and colloids, vol. 25, no. 10, pp. 5446–50, 2009. URL: http://www.ncbi.nlm.nih.gov/pubmed/19341278. DOI: 10.1021/la900494u
[10] L. Song, B. Li, K. K. Sirkar, and J. L. Gilron, “Direct Contact Membrane Distillation-Based Desalination: Novel Membranes, Devices, Larger-Scale Studies, and a Model,” Industrial & Engineering Chemistry Research, vol. 46, no. 8, pp. 2307–2323, 2007. URL: http://pubs.acs.org/doi/abs/10.1021/ie0609968. DOI: 10.1021/ie0609968
[11] D. M. Warsinger, J. Swaminathan, , H. W. Chung, S. Jeong, and J. H. Lienhard V, “The effect of filtration and particulate fouling in membrane distillation,” in Proceedings of The International Desalination Association World
Congress on Desalination and Water Reuse, San Diego, CA, USA, Aug. 2015.
[12] H. Zhang, R. Lamb, and J. Lewis, “Engineering nanoscale roughness on hydrophobic surface–preliminary assessment of fouling behaviour,” Science and Technology of Advanced Materials, vol. 6, no. 3-4, pp. 236–239, 2005. URL: http://stacks.iop.org/1468-6996/6/i=3-4/a=A05?key=crossref.6a0fc42fbe64dde077d9fd3f948518a7. DOI: 10.1016/j.stam.2005.03.003
[13] S. Shirazi, C.-J. Lin, and D. Chen, “Inorganic fouling of pressure-driven membrane processes – A critical review,”
Desalination, vol. 250, no. 1, pp. 236–248, 2010. URL: http://linkinghub.elsevier.com/retrieve/pii/S0011916409007541. DOI: 10.1016/j.desal.2009.02.056
[14] S. Lee and M. Elimelech, “Relating organic fouling of reverse osmosis membranes to intermolecular adhesion forces,” Environmental science & technology, vol. 40, no. 3, pp. 980–987, 2006.
[15] D. M. Warsinger, J. V. Gonzalez, S. M. Van Belleghem, A. Servi, J. Swaminathan, and J. H. Lienhard V, “The combined effect of air layers and membrane superhydrophobicity on biofouling in membrane distillation,” in Proceedings
of The American Water Works Association Annual Conference and Exposition, Anaheim, CA, USA, 2015.
[16] M. Herzberg and M. Elimelech, “Biofouling of reverse osmosis membranes: role of biofilm-enhanced osmotic pressure,” Journal of Membrane Science, vol. 295, no. 1, pp. 11–20, 2007.
[17] J. J. De Yoreo and P. G. Vekilov, “Principles of crystal nucleation and growth,” Reviews in mineralogy and
geochemistry, vol. 54, no. 1, pp. 57–93, 2003.
[18] M. Çelikbilek, A. E. Ersundu, and S. Aydn, Crystallization Kinetics of Amorphous Materials. INTECH Open Access Publisher, 2012.
[19] Z. K. Nagy and R. D. Braatz, “Advances and new directions in crystallization control.” Annual review of chemical
and biomolecular engineering, vol. 3, pp. 55–75, 2012. URL: http://www.ncbi.nlm.nih.gov/pubmed/22468599. DOI: 10.1146/annurev-chembioeng-062011-081043
[20] G. Chen, X. Yang, R. Wang, and A. G. Fane, “Performance enhancement and scaling control with gas bubbling in direct contact membrane distillation,” Desalination, vol. 308, pp. 47–55, 2013. URL: http://linkinghub.elsevier.com/-retrieve/pii/S001191641200389X. DOI: 10.1016/j.desal.2012.07.018
[21] E. Hoek, J. Allred, T. Knoell, and B.-H. Jeong, “Modeling the effects of fouling on full-scale reverse osmosis processes,” Journal of Membrane Science, vol. 314, no. 1, pp. 33–49, 2008.
[22] H. Sojoudi, G. H. McKinley, and K. K. Gleason, “Linker-free grafting of fluorinated polymeric cross-linked network bilayers for durable reduction of ice adhesion,” Materials Horizons, vol. 2, no. 1, pp. 91–99, 2015.
[23] E. Curcio, E. Fontananova, G. Di Profio, and E. Drioli, “Influence of the structural properties of poly(vinylidene fluoride) membranes on the heterogeneous nucleation rate of protein crystals,” The Journal of Physical Chemistry B, vol. 110, no. 25, pp. 12438–12445, 2006.
[24] E. Curcio, X. Ji, G. Di Profio, A. O. Sulaiman, E. Fontananova, and E. Drioli, “Membrane distillation operated at high seawater concentration factors: Role of the membrane on CaCO3 scaling in presence of humic acid,” Journal of
Membrane Science, vol. 346, no. 2, pp. 263–269, 2010. URL: http://linkinghub.elsevier.com/retrieve/pii/-S0376738809007017. DOI: 10.1016/j.memsci.2009.09.044
[25] H. Cao, G. Lin, J. Yao, and Z. Shao, “Amphiphilic polypeptides as a bifunctional template in the mineralization of calcium carbonate at the air/water interface,” Macromolecular bioscience, vol. 13, no. 5, pp. 650–659, 2013.
[26] S. Veintemillas-Verdaguer, S. O. Esteban, and M. Herrero, “The effect of stirring on sodium chlorate crystallization under symmetry breaking conditions,” Journal of crystal growth, vol. 303, no. 2, pp. 562–567, 2007. [27] A. Tsutsumi, J. Y. Nieh, and L. S. Fan, “Role of the bubble wake in fine particle production of calcium carbonate in bubble column systems,” Industrial & engineering chemistry research, vol. 30, no. 10, pp. 2328–2333, 1991.
[28] M. Jamialahmadi, R. Blöchl, and H. Müller-Steinhagen, “Bubble dynamics and scale formation during boiling of aqueous calcium sulphate solutions,” Chemical Engineering and Processing: Process Intensification, vol. 26, no. 1, pp. 15– 26, 1989.
[29] J. Genzer and K. Efimenko, “Recent developments in superhydrophobic surfaces and their relevance to marine fouling: a review,” Biofouling, vol. 22, no. 5, pp. 339–360, 2006.
[30] N. Miljkovic and E. N. Wang, “Condensation heat transfer on superhydrophobic surfaces,” Materials Research
Society, vol. 38, pp. 397–406, 2013.
[31] F. M. Fowkes, “Attractive forces at interfaces,” Industrial & Engineering Chemistry, vol. 56, no. 12, pp. 40–52, 1964.
[32] D. H. Kaelble, “Dispersion-polar surface tension properties of organic solids,” The Journal of Adhesion, vol. 2, pp. 66–81, 1970.
[33] D. K. Owens and R. Wendt, “Estimation of the surface free energy of polymers,” Journal of applied polymer
science, vol. 13, no. 8, pp. 1741–1747, 1969.
[34] A. Hina, G. Nancollas, and M. Grynpas, “Surface induced constant composition crystal growth kinetics studies. the brushite–gypsum system,” Journal of crystal growth, vol. 223, no. 1, pp. 213–224, 2001.
[35] M. Pascu, D. Debarnot, S. Durand, and F. Poncin-Epaillard, “Surface modification of pvdf by microwave plasma treatment for electroless metallization,” Plasma Processes and Polymers, pp. 157–176, 2005.
[36] K. L. Mittal, Contact angle, wettability and adhesion. CRC Press, 2006, vol. 4.
[37] L. Boulangé-Petermann, E. Robine, S. Ritoux, and B. Cromières, “Hygienic assessment of polymeric coatings by physico-chemical and microbiological approaches,” Journal of adhesion science and technology, vol. 18, no. 2, pp. 213– 225, 2004.
[38] E. M. de Castro Lobato, “Determination of surface free energies and aspect ratio of talc, masters thesis,” Materials
Science and Engineering, Virginia Polytechnic Institute and State University.
[39] DataPhysics Instruments, “Solid surface energy data (SFE) for common polymers,” http://www.surface-tension.de/solid-surface-energy.htm, 2007.
[40] Y. Kitazaki and T. Hata, “Surface-chemical criteria for optimum adhesion: Ii. the variability of critical surface tension (γc) and its choice,” The Journal of Adhesion, vol. 4, no. 2, pp. 123–132, 1972.
[41] S. Wu, “Surface tension of solids: an equation of state analysis,” Journal of Colloid and Interface Science, vol. 71, no. 3, pp. 605–609, 1979.
[42] F. Teng, H. Zeng, and Q. Liu, “Understanding the deposition and surface interactions of gypsum,” The Journal of
[43] G. Azimi, Y. Cui, A. Sabanska, and K. K. Varanasi, “Scale-resistant surfaces: Fundamental studies of the effect of surface energy on reducing scale formation,” Applied Surface Science, vol. 313, pp. 591–599, 2014.
[44] A. M. Coclite, R. M. Howden, D. C. Borrelli, C. D. Petruczok, R. Yang, J. L. Yagüe, A. Ugur, N. Chen, S. Lee, W. J. Jo et al., “25th anniversary article: CVD polymers: A new paradigm for surface modification and device fabrication,”
Advanced Materials, vol. 25, no. 38, pp. 5392–5423, 2013.
[45] M. Gupta, V. Kapur, N. M. Pinkerton, and K. K. Gleason, “Initiated chemical vapor deposition (iCVD) of conformal polymeric nanocoatings for the surface modification of high-aspect-ratio pores,” Chemistry of Materials, vol. 20, no. 4, pp. 1646–1651, 2008.
[46] A. Asatekin and K. K. Gleason, “Polymeric nanopore membranes for hydrophobicity-based separations by conformal initiated chemical vapor deposition,” Nano letters, vol. 11, no. 2, pp. 677–686, 2010.
[47] A. M. Coclite, Y. Shi, and K. K. Gleason, “Grafted crystalline poly-perfluoroacrylate structures for superhydrophobic and oleophobic functional coatings,” Advanced Materials, vol. 24, no. 33, pp. 4534–4539, 2012.
[48] A. Antony, J. H. Low, S. Gray, A. E. Childress, P. Le-Clech, and G. Leslie, “Scale formation and control in high pressure membrane water treatment systems: A review,” Journal of Membrane Science, vol. 383, no. 1-2, pp. 1–16, 2011. URL: http://linkinghub.elsevier.com/retrieve/pii/S0376738811006430. DOI: 10.1016/j.memsci.2011.08.054
[49] K. G. Nayar, J. Swaminathan, D. Warsinger, J. Swaminathan, D. Panchanathan, , and J. H. Lienhard V, “Effect of scale formation on surface tension of seawater and membrane distillation,” in Proceedings of The International
Desalination Association World Congress on Desalination and Water Reuse, San Diego, CA, USA, Aug. 2015.
[50] R. Y. Ning, “Discussion of silica speciation, fouling, control and maximum reduction,” Desalination, vol. 151, no. 1, pp. 67–73, 2003.
[51] P. Papadopoulos, X. Deng, D. Vollmer, and H.-J. Butt, “Electrokinetics on superhydrophobic surfaces,” Journal of
Physics: Condensed Matter, vol. 24, no. 46, p. 464110, 2012.
[52] J. Gregor, E. Fenton, G. Brokenshire, P. Van Den Brink, and B. O’sullivan, “Interactions of calcium and aluminium ions with alginate,” Water Research, vol. 30, no. 6, pp. 1319–1324, 1996.
[53] S. Lee and M. Elimelech, “Relating organic fouling of reverse osmosis membranes to intermolecular adhesion forces,” Environmental science & technology, vol. 40, no. 3, pp. 980–987, 2006.