HAL Id: tel-01149483
https://pastel.archives-ouvertes.fr/tel-01149483
Submitted on 7 May 2015HAL is a multi-disciplinary open access
archive for the deposit and dissemination of sci-entific research documents, whether they are pub-lished or not. The documents may come from teaching and research institutions in France or abroad, or from public or private research centers.
L’archive ouverte pluridisciplinaire HAL, est destinée au dépôt et à la diffusion de documents scientifiques de niveau recherche, publiés ou non, émanant des établissements d’enseignement et de recherche français ou étrangers, des laboratoires publics ou privés.
énergétiques
Neda Yavari
To cite this version:
Neda Yavari. Aspects géotechniques des pieux de fondation énergétiques. Autre. Université Paris-Est, 2014. Français. �NNT : 2014PEST1160�. �tel-01149483�
Thèse pour obtenir le grade de
Docteur de l’Université Paris-Est
discipline : Géotechnique
Présentée par
Neda YAVARI
Aspects géotechniques des pieux de fondation énergétiques
Centre d’Enseignement et de Recherche en Mécanique des Sols (CERMES)
Laboratoire Navier
Soutenue le 27 Novembre 2014
JURY
Hussein MROUEH Université de Lille Rapporteur
Luc THOREL IFSTTAR Rapporteur
Farimah MASROURI Université de Lorraine Examinatrice Jean-Michel PEREIRA École des Ponts ParisTech Examinateur Ghazi HASSEN École des Ponts ParisTech Examinateur Anh-Minh TANG École des Ponts ParisTech Directeur de thèse
First and foremost, I wish to thank my research director, Dr. Anh Minh Tang for being supportive from the very first days I began working on the project. His expertise, understanding and patience, added considerably to my graduate experience. I would have been lost without his detailed plan. I am also deeply thankful to my co-director, Dr. Jean-Michel Pereira, for his inspiring guidance, sound advice and good ideas especially throughout my thesis-writing period. My sincere gratitude also goes to Dr. Ghazi Hassen for supervising me throughout the numerical study, for everything I learned, for his ideas and pertinent suggestions. Intelligence, wisdom, problem solving skills and human qualities of the supervision team made me cherish every moment of this work, even the hardest ones.
I am grateful to members of the jury, Prof. Farimah Masrouri, Prof. Hussein Mroueh and Dr. Luc Thorel, for agreeing to read the manuscript and to participate in the defence of this thesis; their remarks and constructive criticism were of great help.
I would like to express my appreciation to the French National Research Agency for funding this PhD thesis.
My sincere thanks also go to the laboratory’s technical support staff ; Emmanuel De Laure, Hocine Delmi, Baptiste Chabot, Xavier Boulay and Marine Lemaire. Without their permanent support, unquestionable skills, understanding and helpfulness the experimental part of this work would definitely not have been possible. Thanks to all the CERMES members, for providing a stimulating environment. My special gratitude to my friends, Hamza Menaceur and Nicolaine Agofack for their moral support.
I would especially like to thank the French Institute of Science and Technology for Transport, Development and Networks (IFSTTAR) for supplying one of the most important experimental apparatuses and all the technical support. Appreciation is extended to Dr. Alain Le Kouby and Mr. Jean-Louis Tacita. Special thanks to Dr. Emmanuel Bourgeois for useful discussions and technical aids on the utilised finite element program.
My loving thanks to my husband, Arash, for his never-failing sympathy and encouragement, for always being there to help and support me, and for always being patient with me. Thanks for ‘teaching’ me how to enjoy the delights and dangers of this adventure : writing the thesis.
resides: my family. I am hugely thankful to the unconditional support of my parents. As always, I find myself speechless when it comes to them. I just want to assure them that I feel more deeply than ever that the more I learn, the less I know. My sisterly thanks to Sara, for ‘seeing me through the hard times that we have had’, for her ‘loyal heart’.
To my father,
To my mother,
To Arash & Sara……
Energy pile efficiency has been tested and validated by numerous studies from environmental and energy-related points of view until now. Nevertheless, energy pile technology is still more or less unknown and rarely applied in construction, especially in France compared to other European countries. The chief reason for this lack of attention might be the limited knowledge of the impact of the coupled thermo-mechanical loading on the behaviour of the pile and that of the surrounding soil. This thesis aims to study the geotechnical aspects of energy piles through physical modelling and some numerical investigations.
A physical model is developed in order to better identify the soil/pile interaction under thermo-mechanical loading. The model is made up of a small pile equipped with a heat exchanger loop embedded in compacted soil. The pile was once installed in dry sand and then in saturated clay; it was then loaded mechanically and was subjected to thermal cycles. The effect of mechanical load value, number of thermal cycles and soil type is studied. The results show the appearance of irreversible settlements during thermal cycles, whose quantity increases as the pile head load increases. Total pressure in the soil close to the pile surface does not change by cooling and heating, while total pressure below the pile increases gradually as thermal cycles proceed. This is in accordance with the permanent downward movement of the pile within thermal cycles. Experiments also show the evolution of axial force profiles with temperature, axial force in the pile increases by cooling and decreases by heating.
In another part of the experimental work, focus shifted to the soil/pile interface. The shear behaviour of the soil (the same as the soils used above) and that of the soil/concrete interface was evaluated at different temperatures. To do this, a conventional shear apparatus was equipped with a temperature control system. Soil (and soil/concrete interface) was subjected to a rather low range of stress. Thermal consolidation was performed according to a special protocol. It was observed that the soil friction angle and cohesion do not change considerably relative to temperature.
The numerical study was initiated by simulating existing tests in the literature on energy piles through a finite element code well-known to engineers, applying a simplified method. The thermal load was simulated by imposing volumetric strains calculated from the coefficient of thermal expansion of the material on the pile. The method successfully simulates the behaviour of some full-scale energy piles in terms of axial strain and pile head displacement. The results highlight the important role played by the pile thermal volume change on the mechanical behaviour of the energy pile under various thermo-mechanical loadings. In the
used for modelling the tests formerly performed on the physical model. Thus, compared to the first numerical attempts, the soil thermal volume change is also taken into account. The numerical results were compared with the experimental ones obtained from physical modelling. It was deduced that the numerical model could simulate correctly the pile behaviour under purely mechanical loading. Also, simulating thermo-mechanical tests, a good estimation of heat conduction in the soil was achieved numerically. Regarding the mechanical behaviour of the pile under thermal cycles, the numerical model adequately predicts the gradual ratcheting of the pile as observed in the experiments. However in terms of axial force distribution in the pile, the results from numerical modelling are different from the physical one.
Key words: energy pile, thermo-mechanical loading, dry sand, saturated clay, physical
modelling, shear behaviour, soil/concrete interface, numerical modelling, heating/cooling cycle
L'efficacité de pieux géothermiques (e.g. énergétiques) a été examinée et validée par de nombreuses études à partir de points de vue environnemental et energétique jusqu'à présent. Néanmoins, la technologie des pieux géothermiques est encore peu connue et rarement appliquée dans la construction, notamment en France comparée à d'autres pays européens. La raison principale du manque d'attention peut être la connaissance limitée sur les impacts du chargement thermomécanique sur le comportement du pieu et celui du sol environnant. Cette thèse vise à étudier les aspects géotechniques des pieux géothermiques grâce aux modélisations physique et numérique.
Un modèle physique est développé afin de mieux connaitre l’interaction sol/pieu sous chargement thermomécanique. Le modèle est composé d'un pieu énergétique équipé des tubes d’échangeur de chaleur, installé dans un sol compacté. Le pieu a d’abord été installé dans un sable sec, puis dans une argile saturée ; il a ensuite été chargé mécaniquement et soumis à des cycles thermiques. L'effet de la charge mécanique, du nombre de cycles thermiques et du type de sol a été étudié. Les résultats montrent la génération de tassements irréversibles au cours des cycles thermiques, dont la quantité augmente avec l’augmentation de la charge en tête du pieu. La pression totale dans le sol à proximité de la surface du pieu ne change pas par refroidissement et chauffage, tandis que la pression totale au-dessous du pieu augmente progressivement à mesure que les cycles thermiques poursuivent. Les expériences montrent aussi l'évolution des profils de la force axiale avec la température ; la force axiale dans le pieu augmente pendant le refroidissement et diminue pendant l’échauffement.
Les comportements au cisaillement du sol (mêmes sols que ceux utilisés dans la première partie) ainsi que de l'interface sol/béton ont été évalués à différentes températures. Pour ce faire, un appareil de cisaillement conventionnel a été équipé d'un système de contrôle de température. Le sol (et l’interface sol/béton) a été soumis à une gamme de contraintes relativement faibles. La consolidation thermique a été effectuée selon un protocole particulier. Il a été observé que l'angle de frottement et la cohésion de matériaux utilisés ne changent pas sensiblement avec température.
L'étude numérique a débuté par la simulation d’essais existants dans la littérature sur des pieux énergétiques en appliquant une méthode simplifiée via un code de calcul basé sur la méthode des éléments finis et assez répandu dans la profession. Le changement de la température est simulé en imposant au pieu des déformations volumétriques calculées à partir du coefficient de dilatation thermique du matériau. La méthode prédit correctement le comportement de certains pieux énergétiques à grande échelle en termes de contrainte axiale
mécanique. Dans un second temps, un autre code de calcul offrant la possibilité d'inclure les effets thermique a été utilisé pour la modélisation des essais effectués auparavant sur le modèle physique. Ainsi, en comparant aux modélisations numériques précédemment expliquées, le changement de volume du sol induit par les variations de température est également pris en compte. Les résultats numériques et expérimentaux sont ainsi comparés. On en déduit que le modèle numérique est capable de prédire le comportement des pieux sous chargement purement mécanique. En outre, en simulant des essais thermomécaniques, une bonne estimation du transfert thermique dans le sol est obtenue. En ce qui concerne le comportement mécanique du pieu au cours de cycles thermiques, le modèle numérique prédit bien le tassement progressif du pieu. Cependant, en termes de répartition de la force axiale, on obtient des résultats contradictoires.
Mots-clés: pieu énergétique, chargement thermomécanique, sable sec, argile saturée,
modélisation physique, cisaillement, interface sol/béton, modélisation numérique, cycle de chauffage/refroidissement
PUBLICATIONS
- Yavari, N., Tang, A.M., Pereira, J.M., Hassen, G. 2014. A simple method for numerical
modelling of mechanical behaviour of an energy pile. Géotechnique Letters 4: 119-124.
- Yavari, N., Tang, A.M., Pereira, J.M., Hassen, G. 2014. Experimental study on the
mechanical behaviour of a heat exchanger pile using physical modelling. Acta Geotechnica 9(3): 385–398.
- Tang, A.M., Pereira, J.M., Hassen, G., Yavari, N. 2013. Behaviour of Heat-Exchanger Piles
from Physical Modelling. Chapter 4, Energy Geostructures: Innovation in Underground Engineering (Eds. Laloui & Di Donna), pp. 79 -97.
- Hassen, G., Pereira, J.M., Tang, A.M., Yavari, N. 2014. Etude du comportement des pieux
échangeurs de chaleur par modélisation physique. Chapitre 4, Géostructure Énergétiques (Eds. Laloui & Di Donna), pp. 99-115.
- Tang, A.M., Pereira, J.M., Hassen, G., Yavari, N. 2013. Mechanical behaviour of energy
piles. Proceedings of the 2nd International Conference on Geotechnics for Sustainable Development (Geotec Hanoi 2013).
- Tang, A.M., Pereira, J.M., Hassen, G., Yavari, N., Kalantidou, A. 2013. Studying the
mechanical behaviour of energy pile physical model. Proceedings of the French-Vietnamese conference on “Construction and Sustainable Development”, CIGOS 2013. No. 22.
- Yavari, N., Tang, A.M., Pereira, J.M., Hassen, G. 2015. Modelling the mechanical
behaviour of an energy pile. 16th European Conference on Soil Mechanics and Geotechnical Engineering (accepted).
- Yavari, N., Tang, A.M., Pereira, J.M., Hassen, G. 2012. A physical model for studying the
mechanical behaviour of heat exchanger pile. ALERT Geomaterials Workshop 2012.
- Pereira, J.M., Tang, A.M., Hassen, G., Yavari, N. 2013. Mechanical behaviour of a heat
exchanger pile: physical and numerical modelling. Geoengineering Energy Geo-Storage, Weimar, Germany.
GENERAL INTRODUCTION……….. 1
CHAPTER 1- LITERATURE REVIEW 1.1 Introduction ... 4
1.2 Thermo-active ground structures ... 5
1.3 Energy piles... 6
1.4 Thermo-mechanical behaviour of soils ... 8
1.5 Soil and soil/structure interface shear behaviour ... 12
1.6 Soil/pile interaction in energy piles... 18
1.7 Design approaches... 39
1.8 Conclusion... 40
CHAPTER 2- DEVELOPMENT OF PHYSICAL MODEL FOR ENERGY PILE 2.1 Introduction ... 41
2.2 Experimental setup ... 41
2.3 Experimental procedure for experiments on dry sand ... 53
2.4 Experimental procedure for experiments on saturated clay ... 58
2.5 Discussion ... 62
2.6 Conclusion... 63
CHAPTER 3- EXPERIMENTAL RESULTS ON PHYSICAL MODEL 3.1 Introduction ... 64
3.2 Experimental results on the model pile in dry sand ... 64
3.3 Experimental results on the model pile in saturated clay... 88
3.4 Discussion ... 98
3.5 Conclusion... 100
CHAPTER 4- EFFECT OF TEMPERATURE ON SHEAR STRENGTH OF SOIL AND SOIL/STRUCTURE INTERFACE 4.1 Introduction ... 103
4.4 Thermo-mechanical loading paths ... 106
4.5 Thermal calibration ... 108
4.6 Experimentalresults... 109
4.7 Discussion ... 117
4.8 Conclusions ... 119
CHAPTER 5- FINITE ELEMENT ANALYSIS OF ENERGY PILES 5.1 Introduction ... 120
5.2 Mathematical formulation of a thermo-mechanical problem... 120
5.3 A first and simple strategy to model energy piles ... 122
5.4 Numerical modelling by CESAR-LCPC... 133
5.5 Conclusion... 162
GENERAL CONCLUSION AND PERSPECTIVES... 164
Figure 1.1 Heat exchanger pile performance during cold and hot periods of the year (Abuel Naga et al., 2014) ... 6 Figure 1.2 Evolution of soil internal friction angle with temperature (Cekerevac, 2003) ... 10 Figure 1.3 Axial strain versus temperature changes for different OCR values (Vega & McCartney, 2014)... 12 Figure 1.4 Typical interface response (Said, 2006)... 13 Figure 1.5 Direct shear box apparatus used by Tsubakihara & Kishida (1993) ... 14 Figure 1.6 Failure mechanism in (a) clay with wc= 10%, σn = 50 kPa, 100 kPa, 150 kPa; (b) clay with wc= 21%, σn= 150 kPa (Shakir & Zhu, 2009)... 15 Figure 1.7 Stress-displacement relationship for kaolin/kaolin interface (Rouaiguia, 2010).... 16 Figure 1.8 Stress-displacement relationship for kaolin/sandstone rock interface (Rouaiguia, 2010)... 16 Figure 1.9 Shear strength envelope of clay and clay/concrete interface with different roughness values (Taha & Fall, 2013) ... 17 Figure 1.10 Experimental results on clay/concrete interface at different temperature values (Di Donna and Laloui, 2013b) (a) Shear stress versus horizontal displacement (b) Shear strength envelope ... 18 Figure 1.11 Geological formation and pile instrumentation at test locations: (a) Lausanne (Laloui et al., 2006) (b) London (Bourne-Webb et al., 2009) ... 19 Figure 1.12 Axial force distribution in the pile in the last test in Lausanne test series (Laloui et
al., 2006) ... 21
Figure 1.13 Axial force distribution in the main pile in London test: (a) at the end of cooling (b) at the end of heating (Bourne-Webb et al., 2009) ... 21 Figure 1.14 Ground profile and foundation instrumentation in the test conducted in Denver, Colorado (McCartney & Murphy, 2012) ... 22 Figure 1.15 Thermal axial stress in (a) Foundation A; (b) Foundation B (McCartney & Murphy, 2012)... 23 Figure 1.16 Cross section and plan view of the pile in Texas experiment (Akrouch et al., 2014)... 24
Vertical displacement in mechanical and thermal phases in test under 150 kN of tension load
(Akrouch et al., 2014) ... 25
Figure 1.18 Thermal axial strain and stress during heating (red) and cooling (open) measured in Foundation 1 and Foundation 3 (Murphy et al., 2014) ... 26
Figure 1.19 (a) Schematic of the centrifuge-scale testing setup at the University of Colorado; (b) Schematic of foundation and heat pump setup (McCartney & Rosenberg, 2011) ... 27
Figure 1.20 Load-settlement curves for model foundations in prototype scale in the work of McCartney & Rosenberg (2011) ... 27
Figure 1.21 Physical modelling of energy pile: (a) the model pile; (b) and the corresponding instrumentation (Stewart & McCartney, 2014)... 28
Figure 1.22 Axial load distribution in prototype scale in the work of Stewart & McCartney (2014) ... 29
Figure 1.23 Laboratory scale testing apparatus (Wang et al., 2011) ... 30
Figure 1.24 Experimental set-up (Kalantidou et al., 2012)... 31
Figure 1.25 Pile temperature versus pile temperature under the pile head load of: (a) 200 N (b) 500 N (Kalantidou et al., 2012)... 32
Figure 1.26 (a) Pile displacement in test 1 in Lausanne test (b) Numerical axial force distribution in the pile in Lausanne test (to be compared to Figure 1.12) (Laloui et al., 2006) ... 33
Figure 1.27 Pile head reaction to thermal cycles: (a) settlement variation in the free head pile (b) head force variation in the restrained head pile (Suryatriastuti, 2013)... 34
Figure 1.28 Axial force distribution in the (a) free head pile (b) restrained head pile (Suryatriastuti, 2013)... 35
Figure 1.29 Modelled and measured strains at the end of (a) the mechanical loading phase (b) the cooling phase (c) the heating phase (Knellwolf et al., 2011)... 38
Figure 2.1 Experimental setup………...…….…. 42
Figure 2.2 Sensors distribution... 43
Figure 2.3 The model pile ... 44
Figure 2.4 Details on strain gauges (G) and temperature transducers (T) ... 45
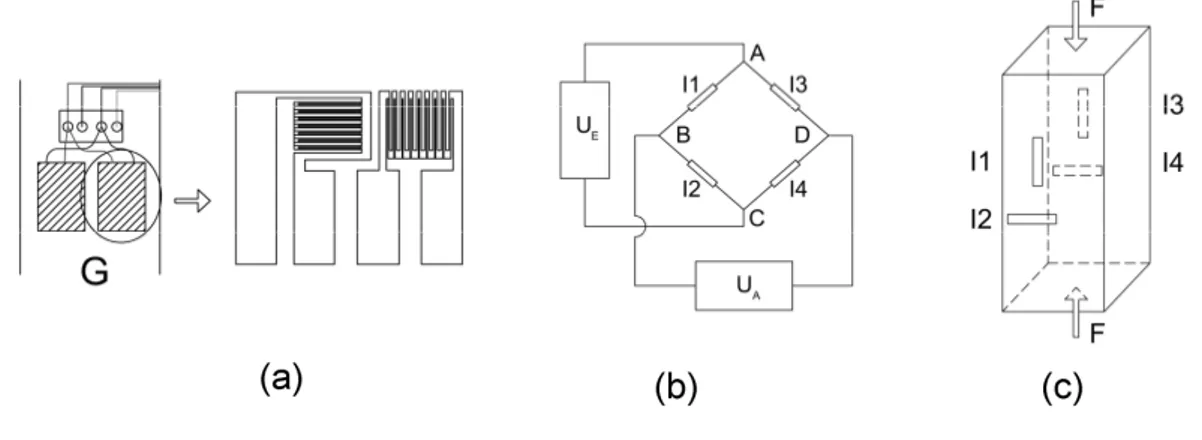
Figure 2.5 Details of the full-bridge strain gauge: (a) installation on the pile surface; (b) behaviour under uniaxial compression of the pile; (c) full-bridge configuration ... 47
and pouring sand; (c) leaving the pile in the sand to be fully coated
………...………47
Figure 2.7 (a) Definition of R and n R (Fioravante, 2002) (b) Estimated t R on the model pilet ... 48
Figure 2.8 Strain gauges calibration... 49
Figure 2.9 Details on the utilised temperature transducer... 50
Figure 2.10 Installation of temperature transducer S3 on the compacted soil layer ... 51
Figure 2.11 Installation of temperature transducers S10, S11 and S12 on the compacted soil layer ... 51
Figure 2.12 Details on the pressure transducer shape and dimension... 53
Figure 2.13 (a) Details on the structural protection of the pressure transducers (b) Installation of pressure transducers P7, P8 and P9 at the pile vicinity on the compacted soil layer... 53
Figure 2.14 Grain size distribution of Fontainebleau sand ... 54
Figure 2.15 Loading procedure for purely mechanical tests (Test E1) on the pile in Fontainebleau sand ... 55
Figure 2.16 Loading procedure in thermo-mechanical tests on the pile embedded in sand under a pile head load of (a) 0 N (b) less than (or equal to) 250 N (c) More than 250 N... 56
Figure 2.17 Test programme (pile in Fontainebleau sand) ... 57
Figure 2.18 Grain size distribution of Kaolin clay... 59
Figure 2.19. First stages of clayey soil compaction ... 60
Figure 2.20 (a) Last stages of clayey soil compaction (b) Final soil surface ... 60
Figure 2.21 Loading programme (pile in Kaolin clay): (a) purely mechanical loading; (b) thermo-mechanical loading ……… 62
Figure 3.1 Results of test E1 : (a) pile head axial load and the axial forces measured at different levels along the pile (b) pile head displacement... 65
Figure 3.2 Pile settlement time dependency in test E1 ... 66
Figure 3.3 Variation of αn by load in test E1 ... 67
Figure 3.4 Load-settlement curves obtained from various tests in dry sand... 68
Figure 3.5 Results of test E1: total pressure changes versus elapsed time at different locations ... 69
(c) at zone C; at zone D ... 71
Figure 3.8 Temperature changes in test E2: (a) at the pile surface and inside the pile; (b) at the bottom of the container and 50 mm below the pile; (c) at 500 mm depth; (d) at 300 mm depth; (e) at 100 mm depth ... 73
Figure 3.9 Pile thermal settlement versus elapsed time during tests: E2(a), E3(c), E4(e), E5 (g), E6(i), and E7(k); pile head settlement versus pile temperature in tests E2(b), E3(d), E4(f), E5(h), E6(j), and E7(l)... 76
Figure 3.10 Interval of pile head settlement during thermal phase ... 77
Figure 3.11 Total pressure and temperature versus elapsed time during thermal phase: (a) test E2; (b) test E6... 78
Figure 3.12 Axial forces and temperature during thermal phase: (a) test E2; (b) test E6... 80
Figure 3.13 Axial force distribution along the pile (a) in test E2 (b) in test E3 (c) in test E4 (d) in test E5 (e) in test E6 (f) in test E7 ... 82
Figure 3.14 Mobilised friction along the pile during thermal phase: (a, b, c, d) test E2; (e, f, g, h) test E6... 83
Figure 3.15 Temperature changes in test E8 at the pile surface and inside the pile... 84
Figure 3.16 Test E8: (a) pile thermal settlement versus elapsed time; (b) pile head settlement versus pile temperature... 85
Figure 3.17 Total pressure and temperature versus elapsed time during thermal phase of test E8 ... 86
Figure 3.18 Axial forces and temperature during thermal phase in test E8 ... 87
Figure 3.19 Axial force distribution along the pile in test E8 ... 87
Figure 3.20 Results of test F1: (a) pile head axial load (b) pile head displacement... 89
Figure 3.21 Pile settlement time dependency in test F1... 90
Figure 3.22 Variation of αn by load in test F1... 90
Figure 3.23 Load-settlement curves obtained via tests F1 & F2... 91
Figure 3.24 Temperature changes in test F3: (a) at the pile surface and inside the pile; (b) at the bottom of the container and 50 mm below the pile; (c) at 500 mm depth; (d) at 300 mm depth; (e) at 100 mm depth ... 93
Figure 3.25 Pile total settlement versus elapsed time during tests: F3(a), F4(c), F5(e), F6(g), F7 (i); pile head thermal settlement versus pile temperature in tests F3(b), F4(d), F5(f), F6(h), F7 (j) ... 96
displacement value (according to Figure 3.26) ... 97
Figure 4.1 Direct shear apparatus with temperature control system ... 104
Figure 4.2 (a) View of the shear box with copper tubes and water inside (b) Thermal insulation of the shear box ... 104
Figure 4.3 Concrete plate used for studying clay/concrete interface ... 105
Figure 4.4 Thermo-mechanical loading paths: (a) tests at 40°C; (b) tests at 20°C; (c) tests at 5°C... 107
Figure 4.5 Evolution of the loading yield surface (LY) in T-p' plan ... 108
Figure 4.6 Transducers measurements versus temperature change in thermal calibration test, measurement of: (a) horizontal stress; (b) vertical stress; (c) horizontal displacement; (d) vertical displacement ... 109
Figure 4.7 Experimental results on Fontainebleau sand at 5°C: (a) shear stress versus horizontal displacement; (b) vertical displacement versus horizontal displacement; (c) shear strength envelope... 110
Figure 4.8 Experimental results on Fontainebleau sand at 20°C: (a) shear stress versus horizontal displacement; (b) vertical displacement versus horizontal displacement; (c) shear strength envelope... 111
Figure 4.9 Experimental results on Fontainebleau sand at 40°C: (a) shear stress versus horizontal displacement; (b) vertical displacement versus horizontal displacement; (c) shear strength envelope... 112
Figure 4.10 Experimental results on Kaolin clay and Kaolin clay/concrete interface at 5°C: (a) shear stress versus horizontal displacement; (b) vertical displacement versus horizontal displacement; (c) shear strength envelope... 113
Figure 4.11 Experimental results on Kaolin clay and Kaolin clay/concrete interface at 20°C: (a) shear stress versus horizontal displacement; (b) vertical displacement versus horizontal displacement; (c) shear strength envelope... 114
Figure 4.12 Experimental results on Kaolin clay and Kaolin clay/concrete interface at 40°C: (a) shear stress versus horizontal displacement; (b) vertical displacement versus horizontal displacement; (c) shear strength envelope... 115
Figure 4.13 Effect of temperature on (a) friction angle and (b) cohesion... 116
Figure 4.14 Effect of temperature on friction angle………118
Figure 5.1 Utilised mesh and boundary conditions in the case of Lausanne test... 123
axial strain at 2.5 m depth; (d) Pile axial strain at 10.5 m depth; (e) Pile axial strain at 16.5 m depth; (f) Pile axial strain at 24.5 m depth ... 127 Figure 5.4 Results of Lausanne test: (a) Pile axial strain distribution during heating; (b) Pile axial strain distribution during recovering; (c) Temperature evolution of pile during heating; (d) Temperature evolution of pile during recovery ... 128 Figure 5.5 Results of London test: (a) temperature of the circulating fluid; (b) pile head displacement... 129 Figure 5.6 Results of London test: (a) profile of temperature along the pile; (b) pile axial strain distribution... 130 Figure 5.7 Results of the small-scale test: load-settlement curve ... 131 Figure 5.8 Results of the small-scale test: Temperature-settlement curves under different head loads: (a) 0 N; (b) 200 N; (c) 400 N; (d) 500 N ... 132 Figure 5.9 (a) Thermal boundary conditions and (b) mechanical boundary conditions for the small scale tests analysed with CESAR-LCPC code. ... 134 Figure 5.10 Thermal loading programme in test E2 ... 136 Figure 5.11 Measured and calculated load-settlement curve (test E1) ... 138 Figure 5.12 Measured and calculated curves: Total pressure changes in test E1 at: (a) P2; (b) P3; (c) P4; (d) P7; (e) P8; (f) P9... 140 Figure 5.13 Axial force distribution along the pile (test E1) ... 141 Figure 5.14 Simulated temperature fields in test E2: (a) at the end of first cooling (b) at the end of first heating... 142 Figure 5.15 Temperature variation in test E2 at depth of 300 mm at the lateral distance of: (a) 50 mm from the pile, (b) 150 mm from the pile, (c) 250 mm from the pile ... 143 Figure 5.16 Pile thermal settlement versus pile temperature; raw and corrected data obtained from tests: E2(a), E3(b), E4(c), E5(d), E6(e), E7(f)... 145 Figure 5.17 Pile thermal settlement versus pile temperature during tests: E2(a), E3(b), E4(c), E5(d), E6(e), E7(f) ... 147 Figure 5.18 Total pressure variation by thermal cycles Total pressure changes in test E2 at: (a) P2; (b) P3; (c) P4; (d) P7; (e) P8; (f) P9 ………...………….149 Figure 5.19 Total pressure variation by thermal cycles in test E2 at: (a) P2; (b) P3; (c) P4; (d) P7; (e) P8; (f) P9... 150 Figure 5.20 Axial load distribution along the pile in tests: E2(a), E3(b), E4(c), E5(d), E6(e),
first cooling phase (c) first heating phase (d) second cooling phase (e) second heating phase ... 153 Figure 5.22 Plastic zone evolution under 300 N at the end of: (a) purely mechanical phase (b) first cooling phase (c) first heating phase (d) second cooling phase (e) second heating phase
... 153 Figure 5.23 Pile thermal settlement versus pile temperature: raw and corrected data obtained from test E8 ... 154 Figure 5.24 Pile thermal settlement versus pile temperature during test E8... 155 Figure 5.25 Pile head settlement versus thermal cycles... 156 Figure 5.26 Axial load distribution along the pile in test E8 ... 156 Figure 5.27 Plastic zone evolution under 150 N at the end of : (a) purely mechanical phase (b) first cooling phase (c) first heating phase (d) last cooling phase (e) last heating phase ... 157 Figure 5.28 Prospective mechanisms for pile behaviour under a load less than 200N and a thermal cycle: (a) a free pile (b) pile in the simulations (c) pile in the experiment ... 160
Table 5.1 Constitutive parameters of the soil in the case studies... 124 Table 5.2 Constitutive parameters of the pile in the case studies... 125 Table 5.3 Constitutive parameters of soil and pile for the physical model ... 135 Table 5.4Loading path applied in simulating test E2 ... 137
Greek symbols
α
coefficient of linear thermal expansion (10−6/°C ) −1n
α creep parameter (mm)
v
α
coefficient of volumetric thermal expansion (10−6 /°C ) −1β gauge factor γ unit weight (kN m ) / 3 Γd stress vector i ∆ displacement (mm) ∆T temperature change (°C)
ε
strain (10−6) λ d plastic multiplier ν Poisson’s ration ρ density (Mg m/ 3) s ρ particle density ( 3 / Mg m ) σ stress tensor nσ normal stress (kPa)
τ
shear stress (kPa)ϕ friction angle (°)
ψ dilation angle (°)
Roman letters
ℂ fourth-order isotropic linear elastic stiffness tensor
D50 median grain size of soil (mm)
emax maximum void ratio
emin minimum void ratio
E elastic modulus (MPa)
H sample height (mm)
g gravitational acceleration ( 2
/
m s )
k thermal conductivity (W m C/ ° )
K soil hydraulic conductivity (m/s)
0
K coefficient of lateral earth pressure at rest
w
K bulk modulus of water (MPa)
n porosity
P axial force (kPa)
q heat flux
i
S pile head displacement at time I (mm)
t
time (s)T temperature(°C)
u
displacement vectormax
V shear rate (µm/min)
0
K coefficient of lateral earth pressure at rest
z
depth (mm)GENERAL INTRODUCTION
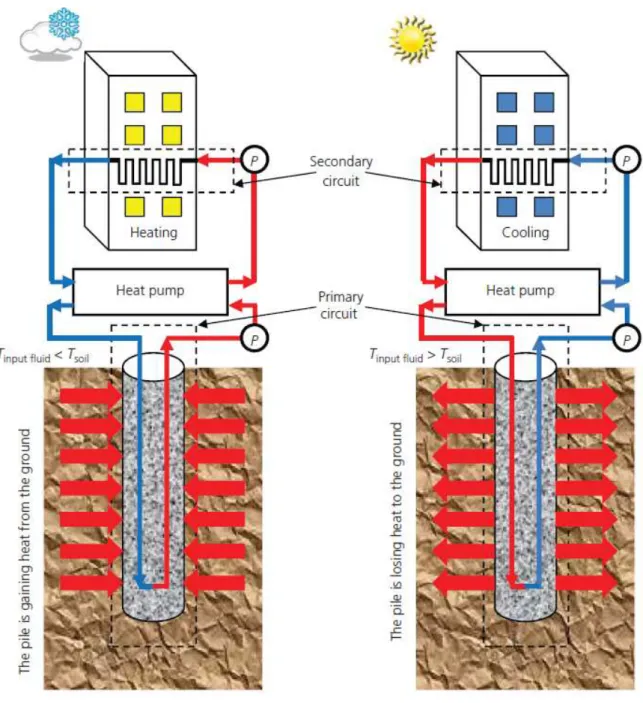
Sustainable development implies reducing any reliance on the technical usage of current energy resources and shifting to others which are known to be clean, environmental friendly and renewable, if properly explored. Geothermal energy is a clean energy resource which does not contribute to global warming emissions. Heat contained in shallow ground can be used by means of a heat pump to cool or heat buildings, since the temperature inside the ground remains stable all year long (Brandl, 2013). In most European countries, this temperature varies between 10°C and 15°C and remains constant below 10 m in depth (Adam & Markiewicz, 2009). Therefore, in summer, the ground is cooler than ambient air and can act as an air conditioner, whereas in winter, the ground is warmer than the air and can be used to heat a building.
Many technologies have been developed to take advantage of geothermal energy, among which energy piles have gained particular attention during the last three decades. Energy piles are double-function piles working simultaneously as conventional deep foundations and heat exchangers. Energy piles contain polyethylene loops within which a heat carrier fluid (generally a mixture of water and glycol) circulates. Loops are connected to a heat pump by means of which in winter, the heat transfer fluid with a temperature of about 4° C is fed into the pile. It is warmed up and then injected back to the building with a higher temperature. The operation is inversed in summer: the fluid with a temperature close to 30° C is injected into the pile and comes back to the building with a lower temperature. Experiments highlight the efficiency of energy piles especially for heating of large industrial or office buildings. Also during summer months, instead of using chillers such buildings can very economically be cooled by running only a circulation pump in the system (Vuataz et al., 2003).
Although justified and accepted from energy and environmental points of view (De Moel
et al., 2010), the application of this construction technique is hindered particularly because of
the lack of a clear vision of the structural integrity of the pile under heating and cooling cycles. Subjecting the pile to coupled mechanical and thermal cycles could indeed have important impact on the pile’s structural behaviour. It is important to understand what effects heating and cooling cycles have on the behaviour of the foundations in order to determine their long-term structural stability: a) expansion and contraction of the pile subjected to heating and
cooling cycles together with; b) thermal volume change in the surrounding soil; c) and dependency of mechanical properties of the pile and the soil to temperature. These effects lead to changing the pile/soil interaction, which results in the variation of axial stress distribution in the pile and reduction of adhesion forces at the pile’s interface. The thermo-mechanical response of the soil/pile interface need to be understood for developing appropriate design practices and standards, which propose economically optimised methods.
The objective of this Ph.D. thesis is to improve knowledge of the geotechnical aspects of heat exchanger piles through physical and numerical modelling. Experimental work consists in the development of a small-scale model in the laboratory and in the implementation of shear tests on soil and soil/pile interface in a modified shear box. The numerical study aims to examine the ability of current commercial codes to simulate energy piles including real scale and small scale ones.
Chapter 1 reviews the literature on different aspects of energy piles with a focus on their geotechnical aspects. The thermo-mechanical behaviour of soils is included. The shear behaviour of soil and soil/pile interface, without and with temperature changes, is highlighted. Different types of tests conducted on energy piles from in situ to laboratory scale are reviewed and major observations are discussed. Numerical studies performed on energy piles are pointed out afterwards. A brief introduction to the limited number of standards and design approaches on energy piles is also provided, which highlights the large deficit in current knowledge of this technology.
The second chapter presents the experiments on a small-scale energy pile. The model pile and its instrumentation are presented. Transducers used and soil materials are discussed in detail. Experimental procedure is explained afterwards.
The experimental results obtained from the physical model are presented in Chapter 3. The response of the pile was investigated by measuring the pile head’s displacement, the pile’s temperature and the pile’s axial strain. The effects induced in the soil during mechanical and thermo-mechanical loading were explored via the measurement of temperature and total pressure.
The fourth chapter concerns shear tests on soil and soil/concrete interface at controlled temperature. Shear box equipment, materials and sensors used are presented. Thermo-mechanical loading paths are discussed. The results are analysed in order to evaluate the effect of temperature on the shear behaviour of sand, clay and clay/concrete interface.
The last chapter discusses numerical modelling performed on energy piles. Two finite element codes (Plaxis and Cesar-LCPC) commonly used by engineers in foundation design
are applied. As a first approach, a decoupling method was proposed whose validity is examined by modelling real scale and small-scale tests via Plaxis. Thereafter, the other commercial code in which temperature effects are also included, is utilised for modelling the pile in the small-scale model developed. The manuscript concludes by presenting general conclusions and perspectives.
CHAPTER 1
LITERATURE REVIEW
1.1
Introduction
The important environmental issue of reducing CO2 emissions and the fact that the energy sources are limited have led to strengthening the classic idea of using renewable energies. One generally accepted concept is paying attention to the geothermal energy and extracting the energy stored below the earth’s surface for heating purposes in winter and injecting the thermal energy back to the earth for cooling purposes in summer. Energy piles were introduced to the industry in the 1980’s and could be considered as dual-purpose structural elements, that transfer the building loads to the ground (as other classical deep foundations) and exchange the ground/building heat as geothermal boreholes. Coupled effects of thermo-mechanical loading could have questionable impact on the thermo-mechanical behaviour of the soil and that of soil/pile interface, which could affect the pile behaviour.
Within this chapter, thermo-active geo-structures in general, and energy piles in particular are first presented. Energy piles are then discussed from energy-related and environmental points of view, according to different studies on this subject. Focus was put afterwards on geotechnical aspects of energy piles, which include the mechanical effects of heating and cooling on the soil/pile interface and on the surrounding soil. The experiments performed without and with temperature changes aiming at characterising both soil behaviour under thermo-mechanical loading and soil/pile interface response were reviewed. This literature review was extended to the study of soil/pile interaction in energy piles via experiments and numerical models. In experimental studies, the test procedure is explained and some important results are presented. Regarding the numerical studies, the models adopted, the numerical procedure and illustrative results are summarised. Finally, the existing energy piles design approaches and their limitations are discussed.
1.2
Thermo-active ground structures
More than 40% of the total energy consumed in Europe is used for heating, ventilation and air conditioning in residential and commercial buildings (Katzenbach et al., 2008). The main sources of this energy are fossil fuels which have major environmental impact on one hand and are finite resources on the other. It seems therefore vital to shift from conventional energy sources to low carbon renewable ones.
Geothermal energy could provide a clean and reliable energy source and help significantly in reducing carbon dioxide (CO2) and other greenhouse gases emissions. Thermal energy stored at depths of 3 to 4 km could be used for electricity production. However this technique is relatively complicated and expensive. Shallower depths provide a good potential for energy storage or extraction, considering that the underground temperature variations stabilise at a depth of 10-20 m (Sanner, 2001), even if ground temperature at very shallow depths does not exceed 30°C (BRGM, 2005). Implementation of geothermal energy at these depths seems to be efficient for space heating and cooling purposes especially in structures with low thermal requirements.
Piles, diaphragm walls, boreholes, slabs, retaining walls and tunnel linings could be transformed into thermo-active geo-structures taking advantage of their structural concrete elements, which are connected to the ground, and considering the relatively high thermal conductivity of concrete. To make the heat exchange possible, concrete elements which are in contact with the underground are equipped with polyethylene pipes containing a heat carrier fluid. Concrete elements are connected to a second network of pipes integrated in other structural elements (which could be walls and roofs in the case of a building). Heat exchange, between the structure and the ground during different seasons, is carried out by the circulation of the heat carrier fluid. As a consequence, heat recovered from the structure through the second network of pipes is injected into the soil during summer and inversely, heat is extracted from the ground and transferred to the structure (again through the mentioned network of pipes) during winter (Brandl, 2006; Banks, 2008; Boënnec, 2009; Adam & Markiewicz, 2009). The technology could be applied in heating and cooling of conventional buildings, pavements, bridge decks and metro stations. As well-known projects, Laizer tunnel in Vienna (Austria), Dock Madfield terminal at Zurich airport (Switzerland), Main Tower in Frankfurt (Germany), One New Change building and Crossrail Project in London (UK) and more recently Shanghai Tower in Shanghai (China) could be mentioned (Pahud et al., 1999; Di Donna & Laloui, 2013a; Brandl 2006; Brandl 2013).
1.3
Energy piles
It is now more than 30 years that geothermal energy is being obtained from deep foundations known as geothermal, heat exchanger or energy piles (Brandl, 2006). Energy piles transfer the building loads to the ground and exchange the ground and building heat at the same time (Figure 1.1). The technology was inaugurated in Austria and spread first to other European countries and more recently to USA and Asian countries (Amis & Loveridge, 2014; Di Donna & Laloui, 2013a).
Figure 1.1 Heat exchanger pile performance during cold and hot periods of the year (Abuel Naga et al., 2014)
Similar to conventional thermal boreholes, geothermal pipe loops filled with a heat carrier fluid, are inserted into the pile at the same time that the reinforcement cage is embedded. Usually, the system is accompanied by a heat pump which helps not only to circulate water, but also to increase the fluid’s temperature from 10-15°C up to 25°C-35°C (Brandl, 2013).
That way, 15% to 25% of thermal needs of a building could be provided (Amis & Loveridge, 2014) while the electricity consumption of the heat pumps integrated with energy piles is only 25% to 30% of the building total electricity requirements (Ebnöther, 2008). The heat, which could be extracted from the ground through a one meter long-energy pile, varies between 20 W and 75 W (Ebnöther, 2008). Heat transfer rate is greater in piles with larger diameters (Amis & Loveridge, 2014) and in soils with higher thermal conductivity (Ebnöther, 2008). The heat that could be extracted from or injected into the ground depends on many parameters, mainly: the viscosity, heat conductivity and specific heat capacity of the heat carrier fluid; the dimension of the internal pipes; flow velocity within the pipes; difference between the inlet and outlet temperature values; thermal properties, hydraulic conditions and density of the soil; and the ground water level and its direction (Yari & Javani, 2007; Lee & Lam, 2007; Ma & Grabe, 2010; Dupray et al., 2014; Brandl, 2013; Stwart & McCartney, 2013; Dupray et al., 2014). There exist limited guidelines in terms of upper and lower temperature of the heat carrier fluid. It is highly recommended that the temperature imposed to the pile should not fall below zero, in order to prevent freezing at the soil/pile interface (SIA, 2005; Brandl, 2006; Loveridge & Powrie, 2013; Boënnec, 2009; GHSP, 2012). Regarding the upper temperature, it does not exceed 40°C in practice (Brandl, 2006; SIA, 2005).
Until now, energy piles have been studied from different points of view. A great part of the work has been focusing on energy-related aspects. Heat transfer regimes, thermal properties of soils, effect of pipes shape on system efficiency and effect of ground water level have been considered in the work of De Moel et al. (2010), Esen et al. (2009), Yari & Javani (2007) and Diao et al. (2004). Special care should be taken in order not to disturb the energy balance of the system (Arson et al., 2013; Loveridge & Powrie, 2013): heating and cooling loads should be similar enough. In other words, the same heat quantity extracted from the ground in winter should be injected into it in summer. Otherwise, the excess heat extraction could lead to ground freezing (Loveridge & Powrie, 2013; Boënnec, 2009; Cervera, 2013). In cold regions where heating requirements are dominant and risk of freezing is higher, other energy sources as solar energy should be used to compensate the excess heat extraction (Cervera, 2013). Arson et al. (2013) considered the particular case of an initially non-saturated soil. In such a case, heating and cooling loads applied to the pile could induce drying and wetting cycles to the surrounding
soil. This could be risky especially in expansive clayey soils, which undergo shrinkage by drying and swell by wetting. The volume changes applied to the soil in that way could lead to ‘debonding’ at pile interface. With respect to mechanical effects of this loss of adhesion, pile side friction decreases. In terms of energy loss, the created gap could play an insulating role and helps to break energy balance (Arson et al., 2013). Freeze-thaw cycles resulting from the imbalanced energy consumption, would cause structural damages to the pile and the soil (Katzenbach et al., 2013).
Although economic, eco-friendly and compatible with sustainable development, energy foundations have not gained the attention they deserved in the construction world, which could be directly related to lack of knowledge of their mechanical performance. Coupling effects of thermo-mechanical loading have been less examined which could be related not only to the complexity of the thermo-mechanical behaviour of the soil/pile system, but also to the difficulty of testing procedures.
Subjecting the pile to heating/cooling cycles could have important consequences, such as reducing the adhesion forces at pile interface, altering the axial stress distribution along the pile, inducing thermal consolidation and thermal volume change in the surrounding soil, etc. (Fromentin et al., 1999; Amatya et al., 2012; Arson et al. 2013; Akrouch et al., 2014; Murphy
et al., 2014; Pasten & Santamarina, 2014; Yavari et al., 2014a&b). Soil mechanical parameters
could also be affected by temperature changes (Cekerevac, 2003) and should not be ignored.
1.4
Thermo-mechanical behaviour of soils
Thermo-mechanical behaviour of soils has been a major research topic during the past two decades. Related researches apply to all underground structures which are subjected to thermal changes, including radioactive waste disposals, energy geo-structures, oil reservoirs, and high-voltage cables buried in soils (Cekeravac 2003; Brandl 2006; Abuel-Naga et al., 2007; Hueckel
et al., 2009; Cui et al., 2009). Geological radioactive waste disposals submit the soil to high
temperatures for a long period of time. The soil temperature varies from its initial state up to around 80°C (Graham et al., 2001; Tang et al., 2007). Thermal effects on the host geological formations, which are mainly clayey soils, could be important. In the case of energy geo-structures, such as walls and foundation piles, the soil temperature can vary from 5°C up to 40°C (Brandl, 2006; Boënnec, 2009), while greater difference between the upper and lower temperatures was considered in some studies in order to examine the worst case scenario (Bourne-Webb et al., 2009; Vega & McCartney, 2014).
Experimental studies on thermo-mechanical behaviour of soils are mostly based on modified oedometric or triaxial cells. The apparatus is generally equipped with a temperature control system and the soil temperature is changed indirectly. According to Cekerevac (2003), the difference between the apparatus developed in different studies is the temperature control method. Moritz (1995) used a triaxial apparatus, filled the cell with water and placed heating elements inside it. Clayey specimens were heated under drained and undrained conditions and then they were loaded until failure under undrained conditions. Tests were carried out at 8°C, 40°C and 70°C, while no experimental results are available at 8°C because of disturbance due to sampling problem. Cekerevac (2003) developed a triaxial apparatus based on the same principles as Baldi et al. (1985), Kuntiwattanakul et al. (1995) and Savvidou & Britto (1995). Thermally resistant rings were placed around the triaxial cell to control the temperature. Drained heating was performed between 22°C and 90°C. In the work of Abuel-Naga et al. (2007) an electric heater was attached to the outer oedometer ring. Water temperature was changed between 25°C and 95°C and clay samples were subjected to thermal cycles. Other heating methods consist of placing electric heating coil around a triaxial cell (Sultan et al., 2002; Monfared et al., 2011; Mohajerani et al., 2014) or immersing the cell in a thermostat bath (Tang et al., 2007). The temperature range applied in these studies was between 20°C and 80°C. It is worth noting that few work has been done in the temperature range lower than 20°C.
Different tests show that the thermo-mechanical behaviour of the soil depends strongly on the applied thermo-mechanical loading path. Heating under undrained conditions leads to increase in pore-water pressure and soil thermal expansion (Graham et al., 2001; Monfared et
al., 2011; Mohajerani et al., 2014). Heating normally consolidated clay under drained condition
induces thermal consolidation (Cui et al., 2000; Cekerevac & Laloui, 2004; Abuel-Naga et al., 2007). On the other hand, heating the soil at low stress induces thermal expansion. Subsequent mechanical loading shows a lower pre-consolidation stress at higher temperature (Sultan et al., 2002; Cekerevac & Laloui, 2004). Various constitutive models have been developed to describe the volumetric thermo-mechanical behaviour of clayey soils (Hong et al., 2013).
In terms of temperature effect on shear strength, conflicting results could be detected from the literature review. Cui et al. (2000) argued that the effects of temperature on shear strength of clay are strongly dependent on the volume change induced by heating. On one hand, thermal expansion leads to a decrease of soil strength; on the other hand, the thermal contraction hardens the soil and makes the shear strength increase. According to Hamidi et al. (2014), heating could make the friction angle decrease, increase or remain unchanged. The soil shear
behaviour is again found to be dependent on its mineralogy and the loading history. The same observation on friction angle was made by Cekerevac (2003), as illustrated in Figure 1.2.
Figure 1.2 Evolution of soil internal friction angle with temperature (Cekerevac, 2003)
While various existing studies focus on the thermo-mechanical behaviour of clay, few work could be found on temperature effects on sand. Thermal consolidation tests performed by Recordon (1993) on fine sand in the range of 2°C and 40°C show that the compressibility parameters (compression index, modulus and over-consolidation ratio) are independent of temperature. The same observation was made by Saix et al. (2000) on clayey silty sand between 30°C and 70°C.
In the context of the energy piles, Franchomme et al. (2013) developed a mini penetration test which helps to rapidly determine temperature effects on cone tip resistance and shear resistance of the soil. The soil used was a mixture of Kaolin clay and Hostun sand. Two cones with a 60° apex, length of 250 mm and diameters of 10 and 12 mm were penetrated in the compacted sample with a rate of 30 mm/s. Tests were first performed on samples with an initial temperature of 20°C. Samples were then thermally cured at 1°C, 30°C and 50°C and tests were repeated. The experimental results show that in the range between 1°C and 30°C, effect of temperature on the penetration test parameters was negligible. At higher temperature values up to 50°C, water content decreased and tip and shear resistances increased. Eslami et al. (2014) performed pressuremeter tests on illitic soil at 20°C and 40°C. Soil was compacted in a
dry density of 1.29 Mg/m3. Steel tubes were welded to the outer surface of the soil container. A mixture of water and ethylene-glycol at a controlled temperature was circulated in the tubes. A mini pressuremeter with length of 340 mm and diameter of 22 mm was utilised. Pressure was increased by increments of 25 kPa for at least 1 minute. The results show low dependency of pressuremeter modulus to temperature in the tested range, while creep pressure and limit pressure values decreased when soil was heated from 20°C to 40°C. Also, pressuremeter curves indicate elastic limit shrinkage by heating.
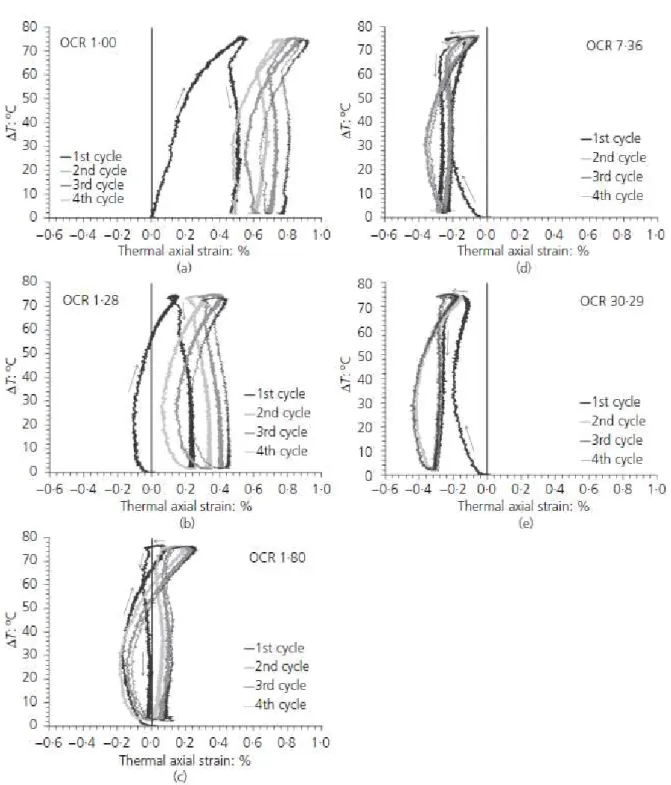
Vega & McCartney (2014) studied the behaviour of saturated Bonny silt under heating and cooling cycles induced by energy geo-structures. Soil specimens were loaded to normally consolidated conditions in a modified thermal oedometer cell, then unloaded to different OCR values. Four thermal cycles were then conducted under a maximum temperature change of 75°C, during which soil was first heated then it underwent ‘unassisted’ cooling (which could also be known as the ‘recovery’ phase, see Kalantidou et al., 2012). Thermal axial strain versus temperature change for different OCR values is shown in Figure 1.3. The results show the contraction of normally consolidated specimens and the expansion of over-consolidated ones by the initial heating. The subsequent cooling led to elastic contraction of both normally consolidated and over-consolidated specimens. By the thermal phases that follow, all the specimens showed increasing additional irreversible volume change while the effects were more pronounced on the normally consolidated specimen. According to the authors, these observations disaffirm the applicability of current thermo-elasto-plastic models on the prediction of the long term behaviour of the soil under cyclic thermal loading, as they predict that the first heating produces plastic contraction in a soil specimen close to normally consolidated conditions, while subsequent heating and cooling cycles result in elastic volume change (Campanella & Mitchell, 1968; Laloui & Cekerevac, 2003; Cui et al., 2000).
Figure 1.3 Axial strain versus temperature changes for different OCR values (Vega & McCartney, 2014)
1.5
Soil and soil/structure interface shear behaviour
Shear tests have been widely used in order to evaluate the shear behavior of soil itself and that of soil/structure interface. In the concerned studies, in general, first the shear strength of the soil is evaluated, then the soil is sheared against another surface and the two mechanisms are compared. As Lemos & Vaughan (2000) deduced from literature, shear strength found on sand/structure interfaces is always smaller than that of sand. When the roughness of the
interface is similar to the grains size, the shear strength will approach to the values observed during sand/sand shear tests. When sand is sheared, the shear behaviour depends on the density. In dense sands, peak strength is generally observed. Regarding the volume change, there exists a short contracting phase followed by a dilating one. In loose sands no peak could be identified and volume change remains contracting (Figure 1.4). On the contrary, the residual shear behaviour of clayey soils and clay/structure interfaces depends on their clay fraction. According
to Lupini et al. (1981), three shear modes exist in clayey soils: sliding, turbulent and transitional.
When clay fraction is dominant and the granular particles are dispersed, reoriented platy particles of clay could form a shear zone between the aggregates. Clay particles will slide on each other and shear will happen. In this case, shear failure is of brittle type. Reversely, when granular particles are dominant, enough space between larger particles, which could help creating the shear zone, does not exist. Thus shear will happen by rotation of the rotund particles and the shear mechanism is of turbulent mode. In this mode shear is of non-brittle type. There exist also a third mechanism, transitional type, in which the two mentioned modes could be observed at the same time. Lemos & Vaughan (2000) also stated that in high clay content clays, the shear residual resistance at interface is close to that of clay and it does not depend on surface roughness.
Figure 1.4 Typical interface response (Said, 2006)
Direct shear apparatus, simple shear apparatus and ring shear apparatus are usually used to study the shear behaviour of soil or soil/structure interface. Tsubakihara & Kishida (1993) used
a direct shear type and a shear box type apparatus in order to investigate the shear behavior of normally consolidated Kawasaki clay/steel interface. The shear box type used is shown in Figure 1.5. Steel plates with different roughness values were used. It was found that there exists a critical roughness beyond which shear failure occurs within the clay layer. Below the critical value, sliding at the interface occurs.
Figure 1.5 Direct shear box apparatus used by Tsubakihara & Kishida (1993)
In Tsubakihara et al. (1993), the authors studied normally consolidated clays with different
sand fractions. The same observation on the existence of a critical roughness value was made. The value was found to be larger for mixtures with higher sand fraction. Hammoud & Boumekik (2006) in their work on a ring shear test, confirm the existence of a critical range of roughness. Below the lower limit, shearing occurs by sliding at the interface and above the upper limit shearing occurs within the soil. For the roughness values within the two limits, shearing is of an intermediate mode, which is a composition of internal shearing and sliding. It has to be noted that they have worked on different clayey soils and steel and concrete interfaces. Shakir & Zhu (2009) performed simple and direct shear tests on unsaturated clay/concrete interface. Concrete surfaces from smooth to rough were prepared in the lower box. Clay was then compacted at different water contents in the upper box. Shear deformation and shear sliding displacements were evaluated. The results show the significant effect of water content on different shear modes, which are depicted in Figure 1.6. According to them, a clay sample with low water content might behave as a quasi-solid material and failure occurs rather by sliding at
the interface. While more water content makes the soil body go under deformation when it is sheared.
Figure 1.6 Failure mechanism in (a) clay with wc = 10%, σn = 50 kPa, 100 kPa, 150 kPa; (b) clay with wc = 21%, σn = 150 kPa (Shakir & Zhu, 2009)
Dove & Jarrett (2002), through direct shear tests on sand/structure interface investigated the effect of asperity height and angle on strength dilatancy behavior. They conclude that when the asperity height approaches the median grain size and asperity spacing is between one and three
times the median grain size, the interface has the maximum efficiency; efficiency is defined as
the ratio between the interface friction angle and the soil friction angle. Rouaiguia (2010) applied a modified shear box to evaluate the residual shear strength of clay alone and that of clay/structure interfaces. Six different clays were first sheared alone and then against two surfaces with different roughness values: glass which was relatively smooth (with an average
roughness of 0.005 µm) and sandstone rock which was rougher (with an average roughness of
10.0 µm). The samples underwent forward and backward shear cycles. The results on the shear
stress versus horizontal displacement show that the shear strength of clay/structure interfaces was smaller than that of clay (Figure 1.7, Figure 1.8). It was also found that the shear mode (whether it was sliding, turbulent or transitional) changed with the surface roughness.
Figure 1.7 Stress-displacement relationship for kaolin/kaolin interface (Rouaiguia, 2010)
Figure 1.8 Stress-displacement relationship for kaolin/sandstone rock interface (Rouaiguia, 2010)
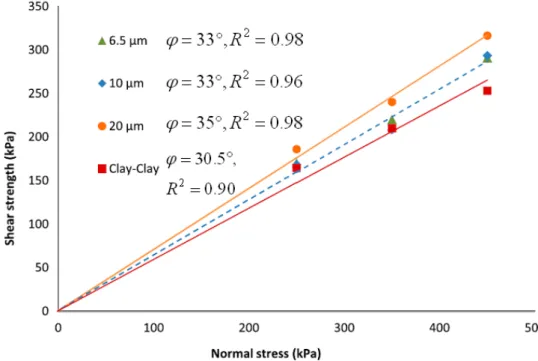
In general, smooth surface promoted sliding shear. For both interfaces, the strength dropped quickly once the peak strength was reached. Smaller shear strength was observed when smoother surface was used. Taha & Fall (2013) used a direct shear apparatus to study the behaviour of sensitive marine clay/concrete interface. Concrete samples were prepared with
three different roughness values which varied between 6.5 µm and 20 µm. The results show an
increase in the friction angle as concrete roughness increased (Figure 1.9). Also, interface shear strength was higher than that of the utilised clay.
Figure 1.9 Shear strength envelope of clay and clay/concrete interface with different roughness values (Taha & Fall, 2013)
Di Donna & Laloui (2013b) equipped the shear box with a heating system and investigated
the shear behaviour of soil and soil/concrete interface at 20°C and 60°C. Tests were conducted under three normal loads of 50 kPa, 100 kPa and 150 kPa. The results of illite clay and illite/concrete interface are shown in Figure 1.10. Tests on illite clay were only performed at 20°C. By increasing the temperature to 60°C, shear resistance at illite/concrete interface
increased (Figure 1.10a). The authors argue that this increase might be explained by thermal
consolidation of clay. With respect to the failure envelope (Figure 1.10b), illite clay and
illite/concrete interface had the same friction angle at critical state at ambient temperature. The illite/concrete interface friction angle at critical state decreased slightly with temperature, while the peak value increased between 20°C and 60°C. Regarding the cohesion value on illite/concrete interface, a significant increase in critical state and peak values could be observed as the temperature increased from 20°C to 60°C. Also, at a constant temperature value, peak and critical state values were close to each other.
Figure 1.10 Experimental results on illite clay/concrete interface at different temperature values (Di Donna and Laloui, 2013b) (a) Shear stress versus horizontal displacement (b) Shear strength envelope
1.6
Soil/pile interaction in energy piles
The behaviour of a soil/pile system under thermo-mechanical solicitation could be investigated through experiments and/or numerical simulations. Experiments could be conducted at different scales, from real scales to laboratory ones. Below, different tests performed within the context of energy piles are first summarised. Then the numerical methods which are mostly validated on the basis of limited existing experiments are discussed.
1.6.1
Full-scale testing
For studying the thermo-mechanical behaviour of energy piles, one of the first methods
was performing in situ experiments. Laloui et al. (1999) conducted full scale tests on one of
the piles of a four-story building under construction on EPFL campus in Lausanne, Switzerland. Pile toe lied on molasses, while the head was topped by the weight of the building that gradually increased by adding each floor. Seven tests were conducted under a constant load value, which varied between 0 kN and 1300 kN. The geological profile and the
pile instrumentation could be seen in Figure 1.11a. One U-shaped polyethylene tube, which
was fixed in the pile during casting, let the heat carrier fluid (water in this case) circulate along the pile. The pile was equipped with vibrating strain gauges (VWSG) and optical fibre sensors (FOS) as well as a load cell at pile toe for measuring vertical and radial strains, temperature and load. At each stage of construction, a temperature change was imposed to the pile, which was equal to 22 °C in the first test and 15 °C in the six others. Pile was cooled down naturally, by stopping the fluid circulation at the elevated temperature. Observations confirmed the evolution of axial strain along the pile under thermo-mechanical loads. Results
also show the elastic behaviour of the pile during thermal cycles. In another study, conducted
by Bourne-Webb et al. (2009) at Lambeth College in London (UK), one of the working piles,
which had been used for verifying the design and also a heat sink pile, were equipped as energy piles. Piles toes lied on London clay while their heads were free. More detail on soil
profile could be observed in Figure 1.11b. The heat sink pile was not loaded mechanically; it
was uniquely subjected to thermal cycles. The main test pile was of diameter of 0.6 m and
length of 23 m (Figure 1.11b) and was instrumented by vibrating-wire strain gauges (VWSG)
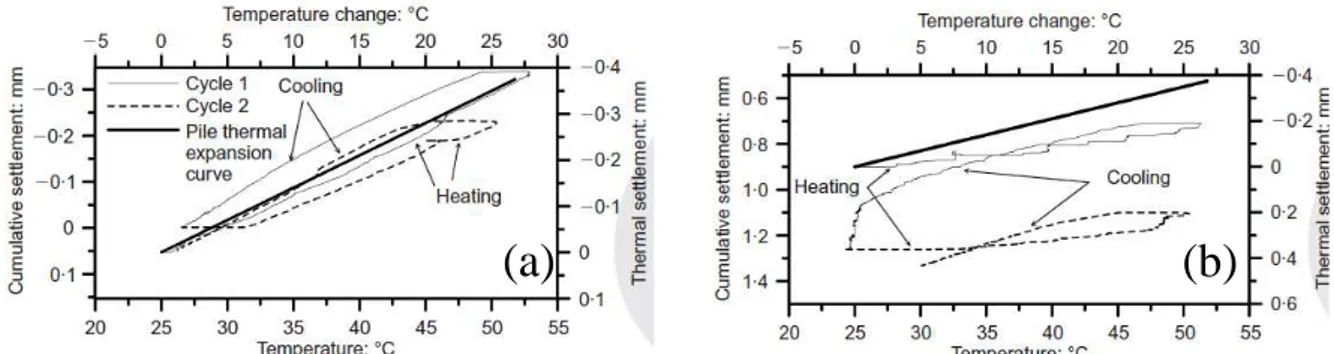
and optical fibre sensors (OFS). Pile was loaded by 1800 kN of axial load at head, then it was unloaded and reloaded this time by 1200 kN. The temperature of the fluid circulating in the pile was varied between -2.5°C and 36°C. Pile was first cooled and then heated.
Figure 1.11 Geological formation and pile instrumentation at test locations: (a) Lausanne (Laloui et al., 2006) (b) London (Bourne-Webb et al., 2009)