Publisher’s version / Version de l'éditeur:
Building Practice Note, 1977-11
READ THESE TERMS AND CONDITIONS CAREFULLY BEFORE USING THIS WEBSITE.
https://nrc-publications.canada.ca/eng/copyright
Vous avez des questions? Nous pouvons vous aider. Pour communiquer directement avec un auteur, consultez la première page de la revue dans laquelle son article a été publié afin de trouver ses coordonnées. Si vous n’arrivez pas à les repérer, communiquez avec nous à [email protected].
Questions? Contact the NRC Publications Archive team at
[email protected]. If you wish to email the authors directly, please see the first page of the publication for their contact information.
NRC Publications Archive
Archives des publications du CNRC
For the publisher’s version, please access the DOI link below./ Pour consulter la version de l’éditeur, utilisez le lien DOI ci-dessous.
https://doi.org/10.4224/20378975
Access and use of this website and the material on it are subject to the Terms and Conditions set forth at
Energy conservation and roofs
Baker, M. C.
https://publications-cnrc.canada.ca/fra/droits
L’accès à ce site Web et l’utilisation de son contenu sont assujettis aux conditions présentées dans le site LISEZ CES CONDITIONS ATTENTIVEMENT AVANT D’UTILISER CE SITE WEB.
NRC Publications Record / Notice d'Archives des publications de CNRC:
https://nrc-publications.canada.ca/eng/view/object/?id=24739309-7a67-4fb4-af83-bb1f797a45dc https://publications-cnrc.canada.ca/fra/voir/objet/?id=24739309-7a67-4fb4-af83-bb1f797a45dcR e f Se
r
TH1BUILDING
PRACTICE
NOTE
ENERGY
CONSERVATIQN AND RDOFSby
M.
C.
Baker
Division of
B u i l d i n g
Research
NationaI
RcciearchCouncil
a£ CanadaOttawa
November
1977National R e a r & Cunseil national
PREFACE
The material
in
this
paper
waspresented
as
part
of
the
Technical Program
of
the
Annual
Meeting and
National Convention
of t h e Canadian Roofing Contractors
Association h e l d
at the
Queen
Elizabeth IIotel, lilonireal,
I6
May1977.
It
is
now
i s s u e d
in
t h i s
form by
the
Division
to
f a c i l i t a t e
theprovision
of
copies for
use
by roofers, and
to make
itavailable
toothers who may
f i n d
it of
value.
The
author i s an honorary member of the Canadian Roofing
Contractors
Association
and
has served
on t h eTechnical
Committee
of the Association
for
many
years.
0
ttatraNovember
1977C
.
B. Crawford,
Di recror,
Division
of
Building Research,
ENERGY rnr4SERVATION lUJD
IMOFS
byW.C. Baker
Buildings
are
b u i l t to protect people,or
their goods o r posssssions f r o m some aspectof
the natural weather. The walls,windows and roofs
of
a building a c t toseparate an inside
[usually
contmI led) envimment f r o m the outside natural (andusually variable] environments ( F i g . I )
.
The c a n t m l l e d indoor environment is
created by using heating, ventilation and air-
conditioning equipnent. As it is usually expensive to provide heating end cooling, t h e
b u i l d i n g enclosure nee& to be made thermally
effective by using m a t e r i a l s that have a high resistance t o heat
flow,
tn keep the heat in during the c o l d weather and out duringthe
h t sluwer
[Fig.
2).me
needfor
t h e m 1 insulationin
buildings
in Canada
has beenm e n for
gran-ted for years. Most people accept -the
fact that a well insulated building a s ts. less to heat or cool than one that is nut insrilated, and t h a t such buildings where people live or
work
are mre cumfortable. Sowhy a l l the fuss about energy wnservatjton? Firstly, d e s p i t e a general knowledge about insul ated buildings,
some
owners s t i l l largely ignore or inten tionally bypass insu- lationin
the interest o f keepingi n i t i a l
building casts low. Even when insulation is -used, the minimum amount r e q u i ~ d for reason-
able comfort is often the cribrian used
without any real consideratian of cost effee
t i m e s s .
Even when cost effectivenesswas considered in the past, the popular mks- conception that it only applied to the
first
one or two inches
of
insulation largely determinedthe arrnunt
used.Secondly, only mccntly
has
the publicbeen
mdc aware that efiergy is indeedIn
s h o e supply, and that energy costs are
continuing t o fise. I t
has
been forecastthat conventional
o i l and gasresources
w i l lprobably be exhausted
in
the next 50or
60 years, and thus other sourcesof
energy forheating and cmling buildings will have to
be
developed. Most e x i s t i n g buildings useEar
mrw
energ);
d ~ a n necessary and many are extremely wasteful of energy. This is anurgent sociological problem; believe
energy-canserration is the only hope
of
averting economic disaster.
Owners
and
designersare
thus forced totaka a new look a t cost-effectiveness of insulation. The
idea
that ma* benefitt o a building owner
m n
be achieved by providing the desired indoor conditions a t the l e a s t capital cost f o ~ the building andthe heating and air-conditioning equipment, and at the least -annual - s t of operation
and financing over the projected l i f e of the
OUTSIDE NATURAL
FIGURE 1
building, i s not
new.
lhis "life-cycld'costing approach to building design
has
nctin the past been taken seriously
by
mostowners
and
their designers, andthis
hashelped to precipitate t h e present
energy
crisis.
Such
a cost analysis frequently showsthat the higher construction cost involved by making a building enclasum thernrally
efficient may result
in
net savings due #decreased fuel r e q u i ~ m e n t s
f&r
tlie heating and cooling over the pm jected l i f e - s p aof
thebuild in^.
T h i si s .another
wavof
savingthat good thermal perforarrrnce is &ore e&o-
mica1
perfomnee. Apartfrom
the p o s s i b i l i t y of saving mneyin
the lanarm
by t h e mupgrading, the& w i l l soon-b e energy
conserua-
tion guidelines or standards enforced by
lsw
to help stretch out our dwindling resources.
Although it mw appears that the ,womt of
new
building construction is decreasing, italso
.appears that the rise of renovated existingbuildings is
on
the increase., and these alabstcertainly will
requim
thermal upgrading.The importance o f the m o f in relation to
the rest of the building depends on the shape
of
the building. ?his can be seen by examin-ing three buildings having equivalent volume,
40 smreys, 10 storeys and one storey high (Fig. 3 ) 'Ihe exposed surface areas of the
buildings expressed as a percentage of the gross floor
areas are,
respectively, 42.5, 30and '118
per
cent. ?his ratio has considerable importancein relation
to energy conservation, because heat l o s sis
a ftmctlonof the
emmto f exposed surface;
heat
gainsf r o m
occupants, l i g h t s and equipmentare
mlated t o floorarea. A building w i t h a high ratio of expsed
surface to floor area w i i l l have o n l y a small
part of its losses made up by heat pmduced
from internal a c t i v i t i e s . It is appropriate,
therefore, and very probable, t h a t this type
o f
building w i l l be required by standards tohave mrs thermal resf stance
i n the
exterior enreIapethan
u i l l buildings with low ratfosaE exposed surface t o
floor area.
All single-storey buiIdings regardless of size, low-rise
b u i l d i n g s of mderate size, and mnst residen- t i a l byildings fall inta this high
ratio
category. 'Ihese generally are buildings w i t ha large amount
of
roof area. In high-rise' buildings,the
mof represents only 6 per cento f the elqrosod area, i n the
medim
rise itrepresents 33 per cent but
in
the sfngle-storey building the
roof is
85 percent of
thee x p s o d area. LENGIH,
FT.
W X O T H ,FT.
I STOREYVOLUME,
CU.Fr.
4 000 000 4 000 000 4 000 OM) FLOOR AREASQ.
FT. 400 000 400 000 200 000 EXPOSED SURFACE,SQ.
R . 170 000 124 000 236 000 EXPOSED SURFACE l0 FLWR AREA -42.5% llMlF AREA,SQ.
FT.
10 000 40 000m
F
AREA M FLOOR AREAROOF
.AREA 10 ?EXWSED SURFACE FIGURE 3Heat
TransferIf
oneis
to consider the energy savingst h a t ctm
be
mds through the useof
insula- tion, w e must mders a d some of the. funda-mentals
ofheat tpnsfer.
Heat transferis
asimple mechartical engineering expression
related to whem
heat is
going, how it flows, andhaw
it can be stopped. A first fundaaen-tal fact i s that heat energy always flows
from
warn t o c o l d and nothing can s t o p it.A l l the h e a t addrnd t o a b u i l d i n g eventually will flow O u t to the
outdoors,
but it can beslowed down by thermal insulation so that
rmh
less heat escapes each hour, each dayor
each winter. I f the heat loss through the roofin
winter is slowed down, mch less heatw i l l have tp be replaced by the heating plant
to
maintain
confortab le conditions. l i k e w i s ein
suuunerif
the heat coming into the build-ing
throughthe roof
can be slowed dwrn thiswill
reduce the energy requiredfor
air-Hovr does heat escape? A11
heat
flow isby conduction, convection or radiation,
although condwtion is generally t h e dominant
mde
for
s o l i d buiIding ~ t e r i a l s .Conduction f s the transfer
or
flow of heat through any type of matter by direct contactof particle t o particle
or
moleculern
mole- a l e ( F i g . 4). Activity of moleculesis
~ l a t e d t o temperature. As heat
is
applied i none
place the a c t i v i t y of the amleculasis
increased and is transferredE m
onemlecule to the next. I f a bar of good con-
duction material, such
as
metal, is heated in one place the heat is r a p i d . 1 ~ transferred throughout t h e bar by molecular a c t i v i t y . l%is is the only method by which heat canflow through an opaque s o l i d . Heat cran also
pass by conduction f m m one material to
another that is
in
intisgte contactw i t t r
it. Convectionis
t h e carryingof
heat by the movement of a l i q u i d or gas [Fig. 53. I fthe
liquid or gas is ih contact w i t h a heated
surface it beanies heated and rises, thus
creating a convection current, whish may,
in
arm,
transfer its heat to any colder surfaceit flows
over.
It it is cooled by contactwith a colder surface, the convection current i s downward. Convection currents set up in sir spaces between the colnponents of walls or
mofs can transfer heat
from
the warn ta the cold si&.Air
leaking through cracks andopenings
also
transmits heat by convection.Radiation is the transfer b f heat energy by
electro-mametic waves through air or a
vacuum (~ig. 6)
.
A l l ob jectg lose energy continmusly by the emission of radiation;they gain energy by absofbing some 6 f the
radiation that comes t o them f r o m ozher
objects. Short-wave radiation c a p s f r o m the sun through empty space and s o w of it
is
absorbed by buildings to heat the materials. Building materials can a l s o transfer h e a tenergy by long-wave radiation thmugh the
air
and acmss air spaces
in
the buildingconstruction.
No matter what the mde, heat flow mans
energy loss or gain, and usually this means greater expenditure for heating or cooling fuel dollars. Fortunately, however, a l l
nodes of heat flow can be easily slowed d m by materials and methods readily available.
' h e addi t i ~ n o f i n s u l a t i o n i s the principal
means
of slowing down h e a t flow in roofs.To
estimate the amunt of heat loss or gain and
FIGURE 5
the heating costs it is necessary to mder- stand a
few mre
specific terns that areused
in
calculations.'lhe
British
Thermal Unit, Btu, i s themeasuring unit of heat energy (Fig. 73. One
Btu is t h e amat o f heat Ghuired to raise
the temperature
of
1 pound of water by IeF,or, conversely, the anwunt of heat given off
by one pound of
water
coaling byI-F.
Thisi s
the
mit used to describe the heat con-tent of fuel and the heat f l o w through
materials and b u i l d i n g envelopes.
T h e d ksistance,
Ill),
indicates theamount of resistance to heat transfer offered
degree
Fahrenheit difference af
temperature
between the faces of t h e mtedal (Fig. 81.
b s r
thermal k u I a t i o n is now described by its R vallle, A l l mturialsin
m f shave
some resistance to heat flow as doair
spaces, andair films at roof and c e i l i n g surfaces. One
. inch
thickness of
a reasonably good insulationhas an R v a l u e o f attout 3 t o 4 . This is an
easy concept to understand but mfortmately
it
is
notthe
only unit necessaryin heat
transfer analysis.Thermal
conductivityis
actually the basic unit of heat flow, and this is a measurn of the Btutsof
heat that will be transmittedthrough one square foot of
one-inch-thick
materidin
m e hour, when the* is a tempera-ture difference of 1'F between the opposite surfaces of the material. This
is
known asthe k vaI*
of
t h e material(Fig.
9).In
analysing the heat flow for a totalroof
construction,the
t orR
value foreach
of the materiaIs making
tp
the constructionmust be considered
.
' h enro
values aredirectly related; t h e R value for m y material
is
siaply the reciprocal of .thek
v d mtR =
*
-
-
ork
=ii).
1 To find the effectivenesso f a maf
or
w a l l as a heat flow b a m e r theeffeariveraess of
each
component of the barriermust-be ad&d (Fig. 10)
.
T h i s can only bedone by working
with
resistances, because k vaIues cannot be added together. The sun ofthe resistances of the a i r f i l m at the
roof
surface, theroofing
merhrane, the mof i q u l a -tim,
theroof
deck. any &ad a i r spaces, theceiling and the
inside a i r
f i l mis
t h e totalBRlTlSU
WE9MAL
U N I T
@td
AMUNTOF MEAT
TORAISE
TEMP.O F
ONE
WUND
OF WATER0Y
I'
F.
heat
resistance
of the construction.This
allowscalculation of
theover-all
heat f l o w forthe
rocif system.'Ihis aver-all coefficient o f
tfieml
transmission,
generally referred ta as the Uvalm, is the time rate of heat flow
in
B a t s perhour
through an a r e a one .foot square.THERMAL
RESISTANCEFf
GURE
8 WIND FIGURE 9Fb
-
RoOF
SURFACERe
-
MEMBRANE 4 ..' c'Lmm - RY-
INSIDESURF%E
m *
-
CEILINGTOTAL
. .R
-
Rt+Ele+Rs-l.R*+Rs+Rg+R7
u
=
l / ~
FIGURE 7 FIGURE 10under steady s t a t e conditions f r n m the
a i r
OTIthe i n s i d e of the roof ta the air on the out-
side, for each l U F of temperature difference
bemeen inside and outside air. The
U
value1
is where
R
represents the total heat resis-tance of the roof as already described. This i s the value that must be known
far thEe
existing mof system for any proposed mb'difi- cations, before the costs and p s d b l e
savings can be calculated.
Heating Degree-Days
'he discussion so far has related to the
general situation, but for any s p e c i f i c build- ing one needs t o consider t h e location, rhe
climate of which w i l l influence the
heat
Lossor
gain of the building and consequently itsenergy requirements. Heating or cooling
operating costs are influenced by the dura-
tion
andseveriry
of the heating or coolingseason, b y the c o s t of the fuel used, and by the efficiency of the heating or cooling plant. The aspect o f climate that mainly affects this is the tempraturn and, for
heating, t h e effect is measured in degree
days. When this concept was originated heat- ing f a c i l i t i e s were generally put to use when the mean daily outdoor temperature fell below ~ F B ~ F , and this is the figure generally used as the base for deermining degree days.
.
For
any heating day there are as mny degree days
as
there
am
Fahrenheit degrees differencebetween 65°F and the man teillprature when
the mean temperature is below 65°F. I f , on
a
given winter day the mean tamperatxae is 3 S 0 ~ ,
for instance, that day represents 30 degree
days. The degree days for the heating season
are the s m of the d a i l y values. Each
weather station keeps track of t h i s imporeant
figure, and a t a b l e 05 degree days below 65%
for
msr
places in Canada is p d l i s h e d as asupplement
m
the National Building Co& o fCanada. Values for representative cities in
each province are given
in
Table I . The 6 5 ' ~b a s i s for degree days is no longer accurate
enough for some calculations; tables are available that use a d i f f e r e n t temperature b a s i s , and some formulae for energy cdcula-
tionsb thae use the degree days based on 65mF
w i t h a conversion factor tn take this into
asclomt.
The Cost of Heat
Most b u i l d i n g s in Canada are heated by burning either o i l or natural gas. The price
.of both
OF
these f ~ l s as w e l l as electricityhas been r i s i n g rapidly and it seems l i k e l y
thaz the trend w i l l continue. Forecasting the
prices
of these comwdities is extremely difficult, butan
estimatehas
t o be mde before any heaniagful analysis of thermal up-grading for
new
or e x i s t i n g buildings cnn beh e , It is predicted that o i l p r i c e s ' u i l l
rise rapidly in the next few
years
--
perhapsat the rate of 20 per cent per year. u n t i l i t
catches up w i t h the price of eIectricity, which i s predicted
-
continue increasing in price at a fairly steady rate of 12 p e r cent peryear
(Fig. 11).The
graph showsincreases of 20 p e r
cent
and 15 per cent andindicates only t h a t at the
lower
rateof
increase
it will take a l i t t l e longer for t h e-st of o i l to catch up w i t h the cost
of
electricity. Natuml gas is currently less expeaivethan fuel oil
but it seemi likelythat it also will increase
in
price until it mches parity w i t h m alternate f-1, atwhich t i m e it
is
assumed they will alll incmase a t *out 12 per cent p e r year. EHiciency of the !-Ieating Plant
The heating value of Emls will vary to some extent but Table 11, based
on
infarma-tion f r o m the Guide of the American Society
for
Heating, Refrigeration and Air-condition- i n g Engineers, gives reasonablevaltes
to usein calculations.
I f mfeaccurate
valuesare
available f r o m the owner in relation to the
f w l being used, then they should be used.
The Table indicates oil to have a heating value f r o m 16S 000 to 184 000 B t u per
Canadian gallon, depending on the type, the
168 000 B t u per gallon being Tor No. 2 which is the commn domestic fizel.
1975 1980
l285
maECT€D
COSTOIL
6
ELECTRICITY
DEGREE
DAYS B W W 6S0F-
SELECTED LOCATIONS CWJANP l a c e F Degree Days Place
F
Degree DaysN o ~ h w
es t Territories A 1 ert Frobisher Bay Yukon-
hwson Whitehorse New filmdl andGrand
FallsLabrador C i t y St. John's
Prince Edward Island
Charlottetown nova S w t i a H a l i f a x Sydney Y a m u t h
Mew
Brunswick Edrmmdston Fredericton Saint John9k!E
Drmmvndvil le Gasps Montrhl Qugbec Seven Islands Ontario Kerm~a O t t a w a Manitoba Churchill Morden Thompson Winnipeg Saskatchewan j b p l e Creek !NO- Battleford : Regina !~askatoonI
klberta
'Calgary I~dmnton1
~ o r t Vermilion;
Lethbri d p B r i t i s h Columbia1
EZ~:;:~~
12 777 6 799 Prince George 9 755 j l f s n - o ~ u ~ ~ r-
5 515 TABLE I1E A T I N G
VALUE
AND COST FAClDRS OF FUELSFraeI Btu's Cost per B t u
Anthracite coal 12 910 per l b . 0.000 077 4 x c o s d l b .
Bituminous coal 9 150 per lb. Q.OW 109 2 x wst/lb,
82 Fuel o i l [domestic] 168 000 p r g a l . 0-000 005 9 x costJga1. #S Fuel o i l (bunker C] 180 000 par gal.
a6 Fuel o i l [bunker C) 184 000 per
gal.
0-000 005 4 x cost/gal.Natural gas 1 000 per cu. ft, 0.001. x wst/cu. ft,
LPG 91 690 per gal. 0.008 010 9 x cost/gal.
1 QQO p e r lb.
Apart fmm the heat content
sf
t h e fuelit is necessary to consider the efficiency of
utili zatian. Heating systems, even when well
designed and maintained,
are
not LOO per centefficient. ' h e rated e f f i c i e n c i e s w i l l probably seldom be mwh h i g h e ~ than 80 per
cent and they relate t o continuous operation
a t f u l l capacity.
The
actual over-allseasonal efficiency m y b p to threequarters or less of the rated capacity. m i c a 1
efficiency ranges of heating systems are
included i n Table 111 based on figures f r o m
the ASHME Guide. The low values probably b e s t F p F e n t seasonal, efficiency.
-
puenti.ty
of
O i lConsumed
A formula to detemine the quantity
of
o i lconsumed
per yearis:
Q
-
o i l cortstnuption, gallons persquare fmt
D = degree days beluw 5S°F per year
24 = conversion factor [For residen- t i a l and some other b u i l d i n g s
t h i s may be given a lower v a l w )
It = tub1 resistance of the mof to
heat flow
H
= heat mnteat of theo i l
Btn pergallon
E = seasonal heating efficiency
TABLE 111
EFFXCIENCES OF
HEATING
S Y S ' E KHand-fired Anthracite furnme 60-75%
Hand-fired bituminous
S t a k e r - f i r e d coal Oil- ot gas-fired
Gas designed u n i t
Gas converted unit
Oil desigtted unit 65- 80
O i l converted unit 60- 80
Direct electric Close t o 100%
FIGURE 12
DEGREE DAYS x 24
OTL CoNSU)4PI'1UN = RESISTANCE x
FEL
HEAT CONTENT x EFFICIENCY GAL/YEAR/SQ. FT.An Example o f 'henna1 Upgrading
i t m y be useful to w n s i d e r an actual
example, A church building has an asphalt
shingle roof, twenty years old and needing replacement (Fig. 12)
.
'Ihe construction, f r o mexterior to interior, c o n s i s t s of asphalt s h i n g l e s , 2-in. thick tongue- and-groove wood
plank, 2 in. by 3 in. furring strips creating
an air space, and 3/8 in. thick fir plywood
interim finish.. The mof area is
72 by 125 ft = 9000 sq. ft. The congregation would like to know i f they should insulate a t
the sane tim as the m o f is replaced.
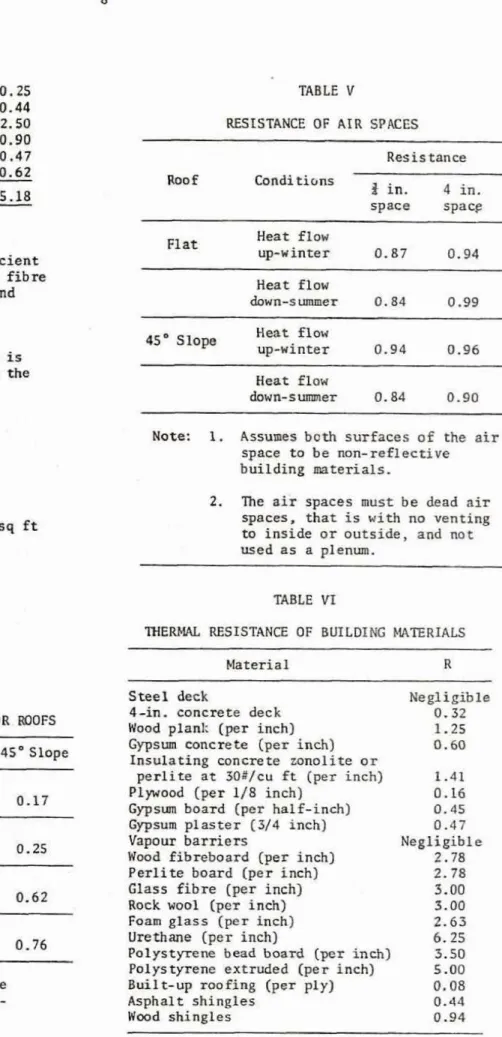
The first step i s to determine the resistance tD
heat
flow for the existingmof, which
can
be designated as RE. Resis- tancevalues
far air films, air spaces and typical roofingmaterials
can be obtainedOutside a i r F i l m (74 mph wind]
AsphaI t shi ngles
2
-in.
wood plank A i r spaceP l p o o d
Inside air f i l m
TOTAL
%
This i s not a very themally e.fficient
mof
considering t h a t aninch
of glass f i b r einsulation has
an U
value of about 3 andextruded p o l y s r p n s an
R
of about 5 .lha
quantity of f u e l cons-din
relation t o O t t a w a , where tfre building i s
located, cltn now be estimated by using the f o m a described earlier :
AIR F I J A RESISTANCE AT SURFAmr MR.ROOFS Surfase Conditions Flat 45' Slope
15 mph wind Outside at foxwinter 0.1; 0-17 roofing surface 7
f
mph wind for s-er 0.25 0.25 Heat £low Inside a t up-winter 0.61 0.62 ceilingsurface Heat flow
dokm-s~mme~ 0.92 0.76
Note: Values are for nonreflective
building materials w i t h s u r - face emissivity of 0.90 TABLE
V
RESISTANG OF A I R SPACESResis
tan- space spa-Flat Heat flow
up-winter 0.87 0.94
Heat f l o w
&wn-stunmer 0.84 0.99
45" Slope Heat up-winter f l o w 0.94 0.96
Heat
flowdown-sumer 0.84 0.90
Note: f . Assuses both surfaces of the air
space t o be mn-reflective
building mterials.
2. The
air
spaces must be dead a i rspaces, that
is
w i t h no ventingto i n s i d e or outside, and not
used as a plenum.
TABLE Yf
TflEREIAL RESTSTANCE
OF
BUILDING MATERIALSMaterial R
Steel deck fleglikible
4-in. concrete deck 0.32
Wood plank (per inch] 1 . 2 5
Gypsum concrete (per inch] 0.60
Insdating concrete mnolite or
perlite a t 3O#/cu
fr
(per inch) 1.41Plywood (per 1/8 inch) 0.16
Gypsum board (per half -inch] 0.45
Gypsum plaster [3/4 inch] 0.47
Vapour barriers Negligible
Wood fibreboard [per inch] 2.78
Perlite board (per inch) 2.78
G l a s s f i b r e (per
inch)
3.00Rock wool (per inch) 3.00
Foam glass (per inch) 2.63 Urethane [per inch) 6.25
Polystyrem bead hoard (per inch) 3.50
Polystyrene extruded (per inch) 5.00
Built-up roofing (per ply] 0.08
Asphalt s h i n g l e s 0.44
This has been expressed in
relation
tn R because everything e l s e w i l l rernain the saaeSn consideratioil of the thermal upgrading.
The most logical. way of upgrading this
roof
would be to leave the e x i s t i n g system asis, place 2-in.
by
2-in. or2-in.
by 4-in.wood
members
on the roof nailedthmu@ *to
thewood deck; f i l l the spaces between the wood
framing w i t h insulation and apply plywood sheathing and
m
roofing of shingles or othermaterial as &sired (Fig. 13).
To
isolate thenew
f r o m the old and to provide a good a i r vapour barrier itwould
be good practice ta apply heavy polyethylene over the old shingles before the new system fs
applied. 2 by 2 ' swill allow 13 in. of insulation; 2 by 4 ' s will
allow 34 in, 'Ihe
new
totalr e s i s z a n e
w i l l depend on the type of insulation; the c o s teffectivemss will depend on the cost per resistance
wit
f u r t h e insulation, TypicalB
values and costs per resistanceunit
are
indicated for seveml t y p e s
of
insulation inTable V f f .
?he easiest material
w
use would beglass f i b r e which can be f i t t e d between the
rood mehers a t 2 ft on centres to take the plywood sheathing. It also is the cheapest per unit o f resf s t a n c e . Insulation
in
boardform would have t o be cut to f i t
bemeen
thewood members w i t h additional labour and some
wastage. I f friction-fit glass f i b r e is used t h e
R
contributed by the added paterials canbe computed as well as the f u e l commption
for the upglarded roof.
U 5 S
FIBRE
INSULATIONI
I
2 ' ~ 4 ~ a @s'ac.
SPIKED
TO
DECK
POLY-
INEW
SUEATCH N
Go
ROOFINGI
I
?OLD
WOOD
DECK
14 in. insulation 4 - 5 0 Plywmd sheathinn
-
0.47 M& shingles-
0.44 AddedR
5.41RE
Total RN31
in.
insulation 10.50 Plywood sheathing 0.4 7 New shingles-
0.44 Added R 11.41%
-
5.18 Total%
16.59 TABLEVII
COSTOF
1NIJLATIOf.IR
CostJsq ft Total R Cost $/sq ft Insulation Type per inch p e r R u n i t l B i n . S i n . l i i n .3 1 i n -
- Bead polystyrene 3.5 2.3 5.25 22.25 0 . 2 2 0.28 Extruded polystyrene 5 5.2 7.50 17.50 0.39 0.91 Urethane 5 9 7.50 17 .SO 0.68 1.58 Glass fibre 3.0 1.3 4.50 10.50 0.06 0.14Fuel savings can
n m
be calculated foreach case
b y
subtracting the fuel consumedwith the upgraded mofs
fmm the
fuel con-sumed with the existing roof. This mounts
to
0.399-
0.195 = 0.204 gallon per year persquare
foot forl i - i n .
insulation and 0.399-
0.125 = 0.274 gallon per year per sqmre foot for 34
-in.
insulation. Fuel savings for t h erim£
of 9000 sq f t: would be 1836 gallons and2466 gallons, and with
fuel
at, say, 60( pergallon, this =presents $1102 for If-in.
In-
sulation and 51480 per year for 33-in insula- tion. For ten y e a r s the savings are $11 020
and $14 800. ?his of course, does not include any analysis
of
the cost of doing the work, the cost of borrowing money, the r i s ein
= s to f fuel, or whether and how long it would
take t o pay o f f the imresbuent from the savings.
It
is p o s s i b l e to take a l l thesethings into account, but
some
additional h l e d g e is required.Opt imaI Thermal Resistance
Another appmaeh ta t h e m 1 upgrading
is
to determine the optimum amunt of insfiation.
This is somewhat more d i f f i c u l t . The optiaum amount of insulation
is
the ammt atwhich
the savings resulting
fmm
adding any-re
insulation j u s t equals the c o s t
of
adding the insulation (Fig. 14).
Assming insulationcan be added without structural changes, the
cost of insulation increases directly as the
thickness is increased. Also the
amunt
ofheat s u p p l i e d (and t h e r e f o ~ the cost]
decreases as insulation i s added. The total annual c u s t of heat loss
fmm
the building through the mof is mde up of the amrtizedc o s t of the insulation
plus
the cost of thefuel. This reduces ta a minimum and then
increases again as insulation
i s
Ldded.The
low point on the total cost curve represents
the optimum thickness. The f o m l a for
optimum resistance is:
FIGURE 14
This
introduces some factors that werenot wed
in
the previously described calcula- tions. The msc of heat in cents per Btu can be obtained b y m l t i p l y i n g the c o s t per Btu (found in Table 11) by the cost per unftof
the
fuel. For No. 2 oil at 604 p e rgallon it
is
0.0000059 x 60 = 0.00035 centsp e r Btu. The w s t of insulation in this formula is the m s t p e r square foot per
resistance unit and is given
in
Table VIIfor some
insulations.P in the firmula represents Present
Worth Fastor. When buying a piece of equip-
mnt
or making an iqmvemnr in a buildingit is necessary tu compare t h e initial cash investment w i t h the saving it w i l l produce
during its projected lifetime. If the
projected l i f e is 10 y e a s on a $1000 invest- ment, and the saving is $100 per year it might be thought that the savings have paid
for the investment. In actual fact at an
interest rate af 10 per cent t h e $100 per
year wouId merely pay o f f the interest.
fiat wrst be known is how much money can be
24 x Degree Days x C o s t of Heat (Canrs/Btu) x P
j u s t i f i e d
in
investing nowin
order to get the benefit of $100 per yearfor
a period af10 years. A t an interest rate of 10 per a n t this i s $614.45, the present v a I w of a
.
.sefies
of
10 annual paymnts of $100 required t o pay the interest and repay the $614.45borrowed.
The
present worth factoris
614g45 or 6.1445. The values o f
P
can be100
determined
in
relation to the rateof
interest and the length of term, ~ n d c*
be
fomd .in
financial
tablesfor
presentvalue
of an annuity of 1 a t corpound interns t.The formula 5s
where i
*
the rate of interestw d W = the
lewth
of t ~ r mBut that's not t h whole s t o r y . In the
case o f f w l savings, the cost of fuel is
going up and as it rises the savings due to
the use of ex- insulation also incmase. This can be taken into acedunt by using an effective rate of interest that allows for
the percentage increase
in fuel
costsIn
place o f the nominal rate of interest. Thefomula is :
i - x
Y = - 1 + x
where i = the rate of interest
and x = the rate of
increase
in
fuelmsr
C o n s i d t an oil-heated building in
Ebantreal w i t h a steel deck to be insulated w i t h glass ebbre insulation or extruded poly-
styrene foam. Ass- 10 per cent as the
rate of interesr and 1 2 per cent as the increase
per
year id the c o s t of f u e l . Theeffective interest rats i s -1.79 (Table VIII)
and
the value of Pfor
a projected l i f e o f 30 years i s about 40 (TableLX)
.
?heF
degree days below 65°F for Mmtreal a% 8200.The c o s t per squam foot of glass fibre per resistan- unit is
L.
3; for extruded p l y -styrene it i s 5.2.
The
efficiency israken
tb
be
75 per cent= 53.5 for glass fibre
'the thickuess
of
insulation, therefore,53 5
w i l l be
-
3 = 17.8 in. Obviously this thickness c m m t be placed on topo f
theTABLE
VI
I1EFFECTIVE INTEREST RATE
Increase
in
costof fuel
% per year 15 14 13 12 11 10 1N"IEREST RATE % 10 -4.35 -3.51 -2.65 -1.79 -0.90 0 11 -3.48 -2.63 -1-77 -0.89 - 0 0.91 f 2 -2.61 -1.75 -0.88 0 0.90 1.82 13 -1.74 -0.88 0 0.89 1 . 8 0 . 2.73 14 -0.87 0 0.88 1.79 2.70 3.64 f 5 0 0.88 ' l,77 2-68 3.60 4-55 16 0.87 1.75 2-65 3.57 4.50 5.45-
17 1.74 2.63 -3.54 4.46 5.41 6.'36 18 2 6 3.51 4.42 5.36 6.31 7.27 19 3.48 . 4 . 3 9 5.31 6.25 7 . 2 1 8.18 20 4.35 5-26 6.19 7.14 3-11 .9.09TABLE I X
PRESENT W O R W FAmRS
TABLE
XPAYBACK
PERIOD
OF T H E W UPI;ELAnING INVES'IMENTIN
YEARS Year 5 10IS
20 25 30 *EFFECFIVE
INTEllEST Ratio A M U ~ Savings Investment]
0 .O1 0 . 0 2 0 . 0 3 0.04 0.05 0.06 0 - 0 7 0.08 0.09 0.10 0.11 0.12 0.13 0.14 0.15 0.16 0.17 0.18 0.19 0.20 0.21 0.22 0.23 0.24 0.25.
-4% 5.7 12.6 21.1 33.6 44.4 60.1 -3% 5.5 11.9 19.3 28.0 38.1 49-8-
*
EFFECTIVE INEREST - 3 45.5 30.1 22.8 28.4 15.4 13.3 11.7 10.5 9 - 4 8.6 7.9 7.3 6.8 6.4 6 . 0 5.6 5.3 5.1 4.8 4.6 4.4 4 . 2 4 - 0 3.9 3.7 -2% 5.3 11.2 11.7 24.9 32,9 41.7 - 2 54.5 34.3 25.3 20.1 16.7 1 4 . 2 12,4 11.0 9.9 9 . 0 8.3 7-6 7.1 6 - 6 6.2 5.8 5.5 5.2 5 . 0 4 - 7 4.5 4.3 4.1 4.0 3.8 -1% 5.2 10.6 16.3 22.2 28.6 35.2 0% 5 . 0 10.0 15.0 20.0 25.0 30.0 -1% 40.0 28.6 22.2 18.1 15.3 13.3 11.7 10.5 9.5 8.7 8.0 7.4 6 . 9 6.4 6 . 0 5 . 7 5 . 4 5.1 4 . 9 4 . 6 4.4 4.2 4 . 1 3.9 1% 4 . 9 9.5 13.9 18.0 22.0 25.8 2% 4 - 7 9.0 0% ' 6 9 . 0 4 1 0 0 , 0 50.0 33.3 25.0 20.0 16.7 14.3 12.5 11.1 10.0 9.1 8.3 7.7 7.1 6.7 6 . 3 5.9 5 - 6 5.3 5.0 4.8 4 - 5 4.3 4.2 4.0 35 4.6 8.5 4 8 4.5 8.1 12.8 16.4 9 5 22.4 1% 69.7 40.7 28.9 22.4 18.3 15.5 13.4 11.8 10.5 9.6 8.7 8.0 7.4 6.9 6.5 6.1 5.7 5.4 5 . 2 4.9 4 . 7 4.5 4.3 4 . 1 5% 4 . 3 7.7 10% 3.8 6.1 2% 55.5 35.0 25.8 20.5 17.0 14.5 12.7 11-3 0 . 9.2 8 . 4 7.8 7.2 6 . 7 6.3 5.9 5.6 5.3 5 . 1 4.8 4.6 4.4 4.2 11.9111.1 10.4 12.5 14.1 15.4 14.9 17.4 19-6 7 . 6 8 . 5 . 9.1 9.4 13.6 15.6 17.3 10% 2 5 . 2 18.8 15.4 13.1 11.5 10.3 9 . 3 8.5 7.1 7.3 6.8 6 - 4 6.0 5 . 7 5.4 3%' 4% 46-9 91.0 23-4 18-9 15.9 13.7 1 2 . 1 10.8 9.7 8 - 9 8.2 7.6 7.0 6.6 6.2 5.8 5 . 5 5 . 2 5.0 4 . 7 4 . 5 4.3 41.0 28.0 21.6 17.7 15.0 13.0 11.5 10.3 9.4 8.6 7.9 7.3 6.8 6.4 6.0 5.7 5.4 5.1 4.9 4.6 4.4steel
deck in the. conventional mfi& system. I f polystyrene is ta be used, the o n l y i t e min
the fornula that changes is the costper
square foot per unitof
resistance. Thus:R [apt) =
/-
= 26.73The
thickness
of insulation will beplace t h i s ampunt
of
insulation in a conven-tional roof, but it should be i n
one
thick-ness as multiple layers & not ~ a d i l y
adhere
one ta the other.
There
IS alsoa
fords to deternine thepayback period
for
any thermal upgradinginvestment r e l a t e d t o the saving of heat energy- The annual saving of heat energy
converted to dollar savings, the effective
interest, and the cost of construction
improvement are required
in
t h i sformula.
The formula is:
whem N = the payback p e r i d
R
= the ratioof
savings expected t o investment requiredY = t h e effective interest rate and,
Ln
= the natural logarithmTable X
gives
the payback periods worked outf r o m this formula related to effective
interest and the annual
savings
to investmentr a t i o .
The
church example can now be further analyzed, assuming the cost of installation for thc roofing Ea be $10,000; t h e cost o f theshingles, which have to be replaced anyway,
can be neglected. The ratio of savings per year ta the total investment for the 35 in, o f insulation would be
-
10 000""'
-
-
0.15. winga 10 per c e n t interest
an
money and a 12 percent increase in guel c o s t the effective
interest is -1.79, .The payback period would Be a h u t 6 - 3 years [Table X),
I f
extruded
polystyrene were used, theextra cost for t h e insulation would be
around $7,000
making the
total cost closerto $17 000. The total resistance would be
23.59 producing a savings
of
2799gallons of
o i l or $1 679 annually. Ratio
o f
amwl
savings to toEal m s t
is
0.098. A tthe
saameffective i n t e r e s t i t
would take
9.3 years payback period [Table X).
Effects
of Increased insulat5onTbe optima thicknesses o f insulation
far
roofs are substantially higher than thethicknesses currently being
used.
Oneconcern arising f r o m this is whether this
will
result
in
life shortening effects onthe mafing. When the insulation is
fnstalled directly below the roofing membrane
which is usual for conventional roofing
systems, it has been suggested that there
w i l l be accelerated weathering, impact resis-
tance and lateral s t a b i l i t y w i l l b e reduced, and t h e splitting hazard will be increased,
A l l but the impact resismce
a=
related tothe greater tesperature range t o
which
the llesbrane wi 11 be subjectedin
comparison witha heavily insulated mof.
The main difference in temrperature
range
r i l l = A t f r o m radiation effects both day and night, with a slightly wanner temperature for themre
heavily insulated roof on a sunny day,and
a slight1 y coolertemperature on a clear cool night. The rate
of chemical degradation
of
mterialsaeceIerates as temperatures
~ i s e .
so
any increasein temperature
over then o m l
hot 5-r temperatires can increase the degrada- tionof
materials, such as b i t m n s .In addition to any increase in tempera-
ture ranges f r o m increased insulation, the raembmne is l o e r e d further away f r o m the structural deck. The importance of resis- tance within t h e insulation t o lateral mve- ment of t h e me&rane certainly assumes added
ftsportance.
It
has also been suggested t h a tthere might be an increase in differential
contraction of t h e membrane caused by
some
a e a s being snow curered and others bare.
In
actwl fact, increased insulation reduces t h i s effect.Calculations by the Division of Building
Research, b y the National Bureau of Standards