HAL Id: inserm-02962997
https://www.hal.inserm.fr/inserm-02962997
Submitted on 9 Oct 2020
HAL is a multi-disciplinary open access
archive for the deposit and dissemination of
sci-entific research documents, whether they are
pub-lished or not. The documents may come from
teaching and research institutions in France or
abroad, or from public or private research centers.
L’archive ouverte pluridisciplinaire HAL, est
destinée au dépôt et à la diffusion de documents
scientifiques de niveau recherche, publiés ou non,
émanant des établissements d’enseignement et de
recherche français ou étrangers, des laboratoires
publics ou privés.
phosphorylation through mitochondria-endoplasmic
reticulum contact sites
Claudie Bosc, Nicolas Broin, Marjorie Fanjul, Estelle Saland, Thomas Farge,
Charly Courdy, Aurélie Batut, Rawand Masoud, Clément Larrue, Sarah Skuli,
et al.
To cite this version:
Claudie Bosc, Nicolas Broin, Marjorie Fanjul, Estelle Saland, Thomas Farge, et al.. Autophagy
regu-lates fatty acid availability for oxidative phosphorylation through mitochondria-endoplasmic
retic-ulum contact sites.
Nature Communications, Nature Publishing Group, 2020, 11 (1), pp.4056.
�10.1038/s41467-020-17882-2�. �inserm-02962997�
Autophagy regulates fatty acid availability for
oxidative phosphorylation through
mitochondria-endoplasmic reticulum contact sites
Claudie Bosc
1,2,12
, Nicolas Broin
1,2,12
, Marjorie Fanjul
1,2
, Estelle Saland
1,2
, Thomas Farge
1,2
, Charly Courdy
1,2
,
Aurélie Batut
3
, Rawand Masoud
4
, Clément Larrue
5
, Sarah Skuli
1,2,11
, Nicolas Espagnolle
6
,
Jean-Christophe Pagès
6
, Alice Carrier
4
, Frédéric Bost
7
, Justine Bertrand-Michel
3
, Jérôme Tamburini
5,8
,
Christian Récher
1,2,9
, Sarah Bertoli
1,2,9
, Véronique Mansat-De Mas
1,2,10
, Stéphane Manenti
1,2
,
Jean-Emmanuel Sarry
1,2,12
✉
& Carine Joffre
1,2,12
✉
Autophagy has been associated with oncogenesis with one of its emerging key functions
being its contribution to the metabolism of tumors. Therefore, deciphering the mechanisms
of how autophagy supports tumor cell metabolism is essential. Here, we demonstrate that
the inhibition of autophagy induces an accumulation of lipid droplets (LD) due to a decrease
in fatty acid
β-oxidation, that leads to a reduction of oxidative phosphorylation (OxPHOS) in
acute myeloid leukemia (AML), but not in normal cells. Thus, the autophagic process
par-ticipates in lipid catabolism that supports OxPHOS in AML cells. Interestingly, the inhibition
of OxPHOS leads to LD accumulation with the concomitant inhibition of autophagy.
Mechanistically, we show that the disruption of mitochondria–endoplasmic reticulum (ER)
contact sites (MERCs) phenocopies OxPHOS inhibition. Altogether, our data establish that
mitochondria, through the regulation of MERCs, controls autophagy that, in turn
finely tunes
lipid degradation to fuel OxPHOS supporting proliferation and growth in leukemia.
https://doi.org/10.1038/s41467-020-17882-2
OPEN
1Cancer Research Center of Toulouse (CRCT), INSERM U1037, CNRS ERL5294, University of Toulouse, Toulouse, France.2Equipe labellisée, La Ligue contre
le Cancer, Toulouse, France.3MetaToul-MetaboHUB, National Infrastructure of Metabolomics and Fluxomics, Toulouse F-31077, France.4Aix Marseille
Université, CNRS, INSERM, Institut Paoli-Calmettes, Centre de Recherche en Cancérologie de Marseille, Marseille, France.5Translational Research Centre in
Onco-hematology, Faculty of Medicine, University of Geneva, 1211 Geneva, Switzerland.6STROMALab, Université de Toulouse, CNRS ERL5311, EFS,
INP-ENVT, Inserm U1031, UPS, Toulouse, France.7Inserm U1065, C3M, Team Cellular and Molecular Physiopathology of Obesity and Diabetes, Université Nice
Côte d’Azur, Inserm, Nice, France.8Université de Paris, Institut Cochin, CNRS UMR8104, INSERM U1016, F-75014 Paris, France.9Service d’hématologie,
Institut Universitaire du Cancer de Toulouse-Oncopole, Toulouse, France.10Laboratoire d’Hématologie, Institut Universitaire du Cancer de
Toulouse-Oncopole, Toulouse, France.11Present address: Division of Hematology and Oncology, Hospital of The University of Pennsylvania, Philadelphia, PA, USA.
12These authors contributed equally: Claudie Bosc, Nicolas Broin, Jean-Emmanuel Sarry, Carine Joffre. ✉email:[email protected];carine.
123456789
A
utophagy is a dynamic catabolic process in which
cyto-plasmic components, including proteins and organelles,
are sequestered into specific intracellular vesicles, called
autophagosomes, before to be delivered to lysosomes for
degra-dation
1. However, autophagy is not only a sink since degradation
products are reused by the cell to sustain metabolism and allow
cell survival. Autophagy is a sensor of the metabolic state and
allows cells to adapt their demands to poor growth environments,
and is considered as a crucial survival mechanism
2. In
physio-logical conditions, autophagy is for instance required to provide
amino acids to the starving neonates after birth
3or to maintain
circulating glucose levels in fasting adult mice
4.
Autophagy has also been critically implicated in tumorigenesis.
This catabolic process was
first shown to favor cancer
progression
5,6, at least in part through its capacity to support the
exacerbated metabolism of cancer cells, and therefore to promote
their proliferation and survival
7–11. Autophagy was then
pro-posed to fuel tumor cell metabolism by supplying metabolic
substrates, such as glucose and amino acids to maintain either
glycolytic capacity
8or mitochondrial functions depending on
cancer types
12–14. However how does autophagy control the
nature and the availability of the substrates, and how is autophagy
itself regulated at the molecular level remain largely unknown.
Tumor cells can use diverse oxidizable substrates to fuel their
energy metabolism
15. For instance, fatty acid oxidation (FAO) is a
crucial catabolic pathway for cell proliferation in acute myeloid
leukemia (AML)
16, and chemotherapy-resistant AML cells
exhi-bit a high OxPHOS status largely dependent on FAO
17,18. These
metabolic changes open new therapeutic avenues and identify
mitochondrial metabolism as an important target in AML
19–22.
While the importance of autophagy in AML cell proliferation was
recently reported in vitro and in vivo
6,23, the contribution of
autophagy to AML metabolism and more specifically to fatty acid
metabolism is currently unknown.
Here, we show that autophagy (i.e., lipophagy) maintains
energy metabolism by suppling free fatty acids (FFAs) to
mito-chondria through the degradation of LD in AML cells, but not in
normal hematopoietic cells. Furthermore, we demonstrate that
mitochondria modulate lipid catabolism through the regulation
of the autophagy process. Our study also reveals that the control
of autophagy by the mitochondria, and then the regulation of
lipid availability require the maintenance of the tethering between
the ER and the mitochondria membranes referred as the
mitochondria–ER contacts or MERCs
24. Thus, this study reports
a new regulatory loop, in which mitochondria control their own
energy and respiratory sources through the regulation of
autop-hagosome formation at MERCs, necessary to AML cell
pro-liferation and survival in vitro and in vivo.
Results
Autophagy participates to lipid catabolism to support
OxPHOS. Whether FFAs might represent a critical substrate to
fuel OxPHOS in AML cells compared to their normal healthy
counterpart cells (hereafter normal hematopoietic cells) is still not
known. To address this question, AML blasts (from peripheral
blood; Supplementary Table 1) and normal hematopoietic cells
(peripheral blood mononuclear cells (PBMC) and CD34
+cells;
Supplementary Table 2) were
first treated with a low
concentra-tion of etomoxir (Etx, 3
μM) to prevent the entry of FFAs into
mitochondria by blocking the activity of carnitine palmitoyl
transferase 1, and oxygen consumption rate (OCR) was evaluated
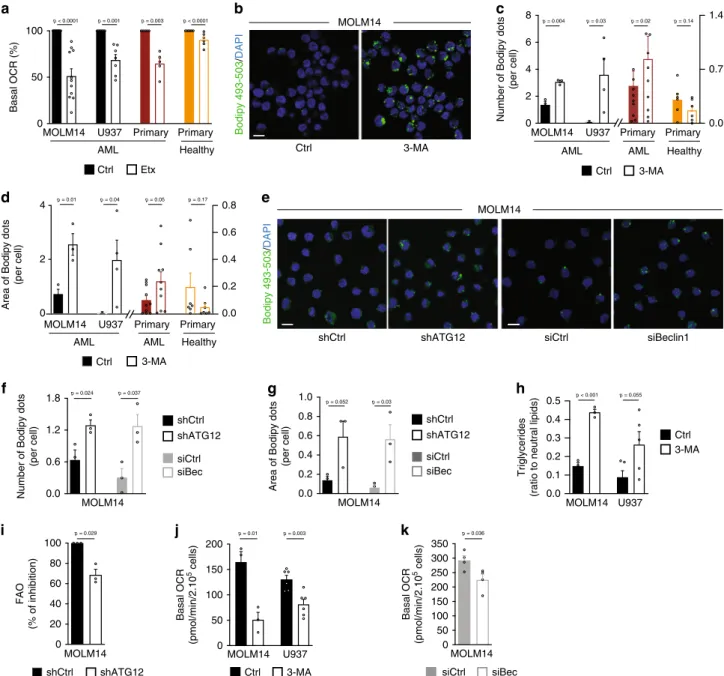
by Seahorse analysis. We found that the OCR (Fig.
1
a,
Supple-mentary Fig. 1a, b) and ATP production linked to respiration
(Supplementary Fig. 1d) were significantly decreased up to
30–50% in AML cells from two cell lines (MOLM14 and U937)
and in primary patient samples compared to respective control
AML cells. Conversely, basal OCR and ATP-linked OCR in the
presence of Etx were only slightly decreased in primary normal
hematopoietic cells (Fig.
1
a, Supplementary Fig. 1c, d). Therefore,
FFAs represent a minor substrate in normal hematopoietic cells,
but are an important carbon source that fuels the TCA cycle and
oxidative phosphorylation in AML cells.
We next addressed the origin of FFAs in AML. Autophagy can
generate FFAs via the degradation of LD
25,26and has been
implicated in tumor lipid homeostasis
27. As autophagy has also
been shown to be required for AML cell proliferation
6, we
hypothesized that autophagy also contributes to lipid catabolism
to support TCA cycle and mitochondrial energetic metabolism in
AML cells. To test this hypothesis, two human AML cell lines
were
first treated with a well-known pharmacologic inhibitor of
autophagosome formation, 3-methyladenine (3-MA), and lipid
content was analyzed by
flow cytometry using the BODIPY 493/
503 probe. Treatment with 3-MA revealed a significant increase
in
fluorescence intensity as compared to control conditions,
indicating an accumulation of lipids after inhibition of autophagy
(Supplementary Fig. 1e). Consistent with these results,
micro-scopy studies revealed a cytosolic accumulation of lipid in
structures resembling LD in AML cells treated with 3-MA, with
no change in lipid content in normal hematopoietic cells
(Fig.
1
b–d, Supplementary Fig. 1f). This suggests that the
involvement of autophagy in lipid metabolism of normal
hematopoietic cells is negligible compared to AML cells. To rule
out 3-MA off-target effects, we investigated the consequences of
short-term and long-term silencing of the key autophagy proteins
Beclin1 and ATG12 on lipid accumulation. Similar to 3-MA
treatment, the number and area of BODIPY 493/503-positive
structures increased upon genetic inhibition of autophagy in
AML cells (Fig.
1
e–g, Supplementary Fig. 1g). Of note, no change
in lipid content of normal hematopoietic cells was significantly
observed (Supplementary Fig. 1h, i). This demonstrates that
autophagy regulates lipid content in AML cells. Furthermore,
specific acid lipase lysosomal inhibitor Lalistat2 also promoted
the accumulation of BODIPY 493/503-positive structures in AML
cells (Supplementary Fig. 1j, k). To further characterize these
intracellular organelles, we quantified content in triglycerides, one
of the major storage lipids sequestered in LD. We observed a
significant increase in triglyceride level in autophagy-incompetent
cells (Fig.
1
h). These results combined with the intracellular
punctuated BODIPY staining indicate that inhibition of
autop-hagy led to the accumulation of triglycerides in LD in AML cells.
Altogether these experiments strongly suggest that autophagy is
involved in lipid catabolism in AML cells to generate FFAs
necessary for mitochondrial activity, and that this process is not
observed in normal hematopoietic cells, where lipids are not a
major respiratory source.
Since fatty acid oxidation (FAO) is the biochemical process
responsible for FA degradation and indicative of the level of FFAs
available to cells, we next analyzed FAO in AML cells. As
expected, the inhibition of autophagosome formation by an
shRNA directed against ATG12 (Fig.
1
i) or by 3-MA
(Supple-mentary Fig. 1l) reduced the rate of FAO. Thus, autophagy of LD
(i.e., lipophagy) contributes at least in part to the release, and
availability of FFAs from triglyceride hydrolysis in AML cells. We
therefore studied whether the FFAs released by autophagy and
utilized by mitochondria represent an important respiratory
substrate that participates in ATP production by OxPHOS. To do
so, we assessed OCR and mitochondrial ATP production in cells
with inhibited autophagy. This approach revealed that both basal
OCR and mitochondrial ATP production-linked OCR were
significantly decreased, when autophagy was inhibited either with
interfering RNA (siRNA) targeting Beclin1 in AML cells
(Fig. 1k, Supplementary Fig. 1o, p). Conversely, OCR and
mitochondrial ATP production were slightly decreased in normal
hematopoietic cells (Supplementary Fig. 1q, r). In summary, these
results indicate that AML cells in part rely on autophagy for
energy metabolism by supplying FFAs to fuel oxidative
phosphorylation.
Inhibition of OxPHOS affects lipid metabolism. Given that our
findings established that FFAs are essential for mitochondrial
activity, we next wondered whether OxPHOS could in turn
reg-ulate the lipid metabolism. Transcriptomic analysis of AML cells
treated with the mitochondrial electron transfer chain (ETC)
complex I inhibitor metformin
18(Supplementary Fig. 2a) showed
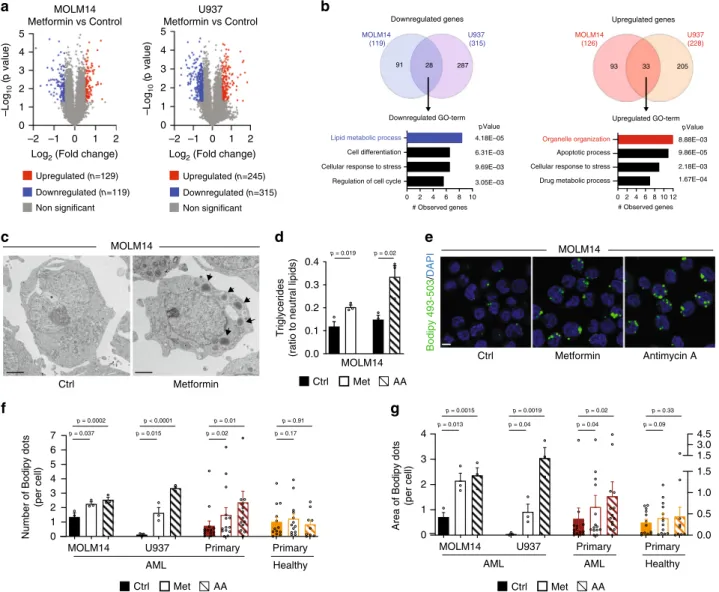
a downregulation of genes regulating metabolic processes (Fig.
2
a,
e
Bodipy 493-503 / DAPI Ctrl 3-MA MOLM14 FAO (% of inhibition)i
j
Basal OCR (pmol/min/2.10 5 cells) Basal OCR (pmol/min/2.10 5 cells) 3-MA Ctrl shCtrl shATG12Number of Bodipy dots
(per cell) MOLM14
f
3-MA Ctrl Triglycerides(ratio to neutral lipids)
k
Ctrl 3-MAa
b
d
Ctrl Etx MOLM14 U937c
Basal OCR (%) Healthy Ctrl 3-MAArea of Bodipy dots
(per cell)
shCtrl shATG12 siCtrl siBeclin1
Bodipy 493-503
/
DAPI
Number of Bodipy dots
(per cell) MOLM14 siCtrl siBec shATG12 shCtrl
Area of Bodipy dots
(per cell) MOLM14
g
p = 0.052 p = 0.03 MOLM14h
p = 0.029 MOLM14 siBec siCtrl MOLM14 p = 0.036 Primary Primary AML p < 0.0001 p = 0.001 p < 0.0001 MOLM14 U937 Healthy Primary Primary AML MOLM14 U937 Healthy Primary Primary AML p = 0.004 p = 0.03 p = 0.02 siCtrl siBec shATG12 shCtrl p = 0.003 AML AML U937 p < 0.001 p = 0.055 MOLM14 U937 p = 0.01 p = 0.003 0 50 100 0 2 4 6 8 0.0 0.7 1.4 p = 0.14 0 2 4 0.0 0.2 0.4 0.6 0.8 p = 0.01 p = 0.04 p = 0.05 p = 0.17 0.0 0.6 1.2 1.8 0.0 0.2 0.4 0.6 0.8 1.0 0.0 0.1 0.2 0.3 0.4 0.5 p = 0.024 p = 0.037 0 20 40 60 80 100 0 50 100 150 200 0 50 100 150 200 250 300 350Fig. 1 Autophagy participates to lipid catabolism to support OxPHOS. a Seahorse measurement of basal oxygen consumption rate (OCR) in MOLM14
(n = 11) and U937 (n = 7) AML cell lines, in primary AML patient cells (n = 4) and in primary normal hematopoietic cells (PBMC n = 6; CD34+n = 3)
treated or not with Etx (3µM, 15 min; one-sample t-test). b MOLM14 cells were treated with 3-methyladenine (3-MA, 5 mM, 24 h), fixed and stained for
Bodipy 493/503 and DAPI. Representative confocal pictures from three independent experiments are shown. Scale bar: 10µm. c, d MOLM14 (n = 3) and
U937 (n = 4) AML cell lines, primary AML patient cells (n = 10) and primary normal hematopoietic cells (PBMC n = 7) were treated or not with 3-MA
(5 mM, 24 h),fixed, and stained for Bodipy 493/503 and DAPI. Histograms show the number (c) or the area (d) of Bodipy 493/503 dots per cell
(one-samplet-test). e, g MOLM14 cells were either transduced with a shRNA directed against ATG12 or transfected with a siRNA targeting Beclin1. Cells were
then stained for Bodipy 493/503 and DAPI. Representative confocal pictures from three independent experiments are shown (e). Scale bar: 10µm. Graphs
represent the number (f) or the area (g) of Bodipy 493/503 dots per cell, (n = 3, unpaired t-test). h MOLM14 (n = 3) and U937 (n = 5) cells were treated
with 3-MA (5 mM, 24 h), and processed for triglycerides content analysis. Graph represents the ratio of triglycerides on total neutral lipids (unpaired t-test). i MOLM14 transduced with Ctrl or ATG12 shRNAs were examined for their rates of β-oxidation, (n = 3, one-sample t-test). j, k Seahorse
measurement of basal OCR in MOLM14 (n = 3) and U937 (n = 6) cells treated or not with 3-MA for 24 h (j), or MOLM14 cells transfected with siRNA
b, Supplementary Tables 3 and 4), and in particular lipid
meta-bolic processes (Fig.
2
b, Supplementary Table 5). We then
per-formed a gene set enrichment analysis (GSEA) with two identified
fatty acid metabolism gene signatures (Hallmark fatty acid
metabolism signature, 158 genes, Broad Institute M5935; fatty
acid metabolic process signature
28, 47 genes) and observed an
enrichment of these two gene signatures in control-treated cells
compared to metformin-treated cells (Supplementary Fig. 2b),
indicating that these specific gene sets related to lipid metabolism
were downregulated upon metformin treatment. Moreover, high
OxPHOS gene signature that we have previously determined
18was negatively selected in metformin-treated cells
(Supplemen-tary Fig. 2c). Therefore, the inhibition of mitochondrial ETC
complexes was associated with a decrease in lipid metabolism,
supporting a link between mitochondrial activity and lipid
metabolism. An electron microscopy study further revealed that
metformin treatment induces the appearance of structures
cor-responding to LD that were entirely absent in control-treated cells
(Fig.
2
c, Supplementary Fig. 2d). Accordingly, level of
triglycer-ides was significantly increased in AML cells treated with
met-formin, as well as with a specific ETC complex III inhibitor
antimycin A (AA) compared with control cells (Fig.
2
d,
Supple-mentary Fig. 2e). To further investigate the relationship between
mitochondrial activity and lipid homeostasis, we performed
flow
cytometry analysis with BODIPY 493/503 and demonstrated that
lipid staining increased over time upon metformin or AA
treat-ment (Suppletreat-mentary Fig. 2f). We then assessed the number of
lipid droplets present after mitochondrial OxPHOS inhibition in
two AML cell lines, primary AML patient cells and normal
hematopoietic cells. As observed with autophagy inhibition
c
Ctrl Metformin
d
MOLM14 Ctrl Metformin Antimycin A
g
f
Triglycerides
(ratio to neutral lipids)
p = 0.019 p = 0.02 MOLM14 MOLM14 Bodipy 493-503 / DAPI p = 0.01 p = 0.02 p = 0.0002 p = 0.037 p < 0.0001 p = 0.015 p = 0.91 p = 0.17 MOLM14 U937 Healthy Primary Primary AML
Number of Bodipy dots
(per cell) Ctrl Met AA p = 0.0015 p = 0.013 p = 0.0019 p = 0.02 p = 0.04 p = 0.33 p = 0.09 MOLM14 U937 Healthy Primary Primary AML Ctrl Met AA
Area of Bodipy dots
(per cell)
p = 0.04
AML
a
b
0 2 4 6 8 10
Regulation of cell cycle Cellular response to stress Cell differentiation # Observed genes pValue 4.18E–05 Downregulated GO-term Downregulated genes 91 28 287
Lipid metabolic process
6.31E–03 9.69E–03
3.05E–03 Drug metabolic process
Cellular response to stress Apoptotic process Organelle organization # Observed genes pValue 8.88E–03 Upregulated GO-term Upregulated genes 93 33 205 9.86E–05 2.18E–03 1.67E–04 0 2 4 6 8 10 12 –2 –1 0 1 2 0 1 2 3 4 5 Upregulated (n=129) Downregulated (n=119) Non significant MOLM14 Metformin vs Control –Log 10 ( p value) –Log 10 ( p value)
Log2 (Fold change) Log2 (Fold change) –2 –1 0 1 2 0 1 2 3 4 5 Upregulated (n=245) Downregulated (n=315) Non significant U937 Metformin vs Control MOLM14 (119) U937 (315) MOLM14 (126) U937 (228) Ctrl Met AA
e
0.0 0.1 0.2 0.3 0.4 0 1 2 3 4 5 6 7 0 1 2 3 4 0.0 0.5 1.0 1.5 1.5 3.0 4.5Fig. 2 Inhibition of OxPHOS affects lipid metabolism. a Volcano plots displaying fold change versus adjustedp-values of MOLM14 (left) and U937 (right)
cells treated with 10 mM of metformin (Met) for 24 h (p-value < 0.05, absolute log2 fold change > 0.5, unpaired t-test). b Venn diagram representing
overlap between MOLM14 and U937 downregulated (left) and upregulated (right) genes. Enrichment analysis of Gene Ontology (GO) classification for
common downregulated (left) and upregulated (right) genes by Genomatics software analysis (Fisher’s exact test). c MOLM14 cells treated with Met (10
mM) for 24 h werefixed and processed for transmission electron microscopy analysis. Representative electron microscopy pictures from two independent
experiments are shown. Arrows indicate lipid droplets. Scale bar: 2µm. d MOLM14 cells were treated with Met or with antimycin A (AA) and processed for
triglycerides content analysis, (n = 3, unpaired t-test). e MOLM14 cells were treated with Met or with AA, fixed and stained for Bodipy 493/503 and DAPI.
Representative confocal pictures from three independent experiments are shown. Scale bar: 10µm. f, g MOLM14 (n = 3) and U937 (n = 3) AML cell lines,
primary AML patient cells (n = 14) and primary normal hematopoietic cells (PBMC n = 9; CD34+n = 4) were treated with Met or with AA for 48 h, fixed,
and stained for Bodipy 493/503 and DAPI. Histograms show the number (f) or the area (g) of Bodipy 493/503 dots per cell (unpairedt-test or paired
(Fig.
1
b–g, Supplementary Fig. 1f, h, i), mitochondrial respiratory
chain inhibition led to an accumulation of LD in AML cells and
had no impact on normal hematopoietic cells (Fig.
2
e–g,
Sup-plementary Fig. 2g). Of note, similar results were obtained with
cells grown in lipid-free serum medium, suggesting that the
increase in LD resulted from the accumulation of both
extra-cellular and endogenous lipids (Supplementary Fig. 2h, i).
Next, we examined whether this accumulation was due to an
increased lipogenesis or a decrease in degradation. As previously
reported
29, metformin strongly reduced de novo lipogenesis
(Supplementary Fig. 2j). Importantly, our transcriptomic analysis
did not reveal any increase in gene expression, and signatures
related to the biogenesis or the trafficking of LD, to the synthesis
of triglycerides, or to transcription factors regulating lipid
synthesis (Fig.
2
b, Supplementary Tables 3–5). In addition, no
change in the expression level of proteins implicated in LD
formation (i.e., ADRP; Supplementary Fig. 2k), or modification of
the subcellular localization of the transcription factor SREBP1/2
were observed upon metformin or AA treatment (Supplementary
Fig. 2l). Moreover, both metformin and AA markedly reduced
FAO (Supplementary Fig. 2m), suggesting that the inhibition of
OxPHOS also prevented the lipid degradation. Collectively, these
data indicate that mitochondrial OxPHOS is directly linked to the
lipid metabolism in AML cells by controlling the degradation of
LD and the availability of respiratory substrates.
Inhibition of OxPHOS reduces autophagic
flux. Based on
above-described results, we next sought to determine whether
mitochondrial function might regulate lipid degradation via the
control of the autophagy process. To address this possibility, we
evaluated if inhibiting the mitochondrial ETC could modulate
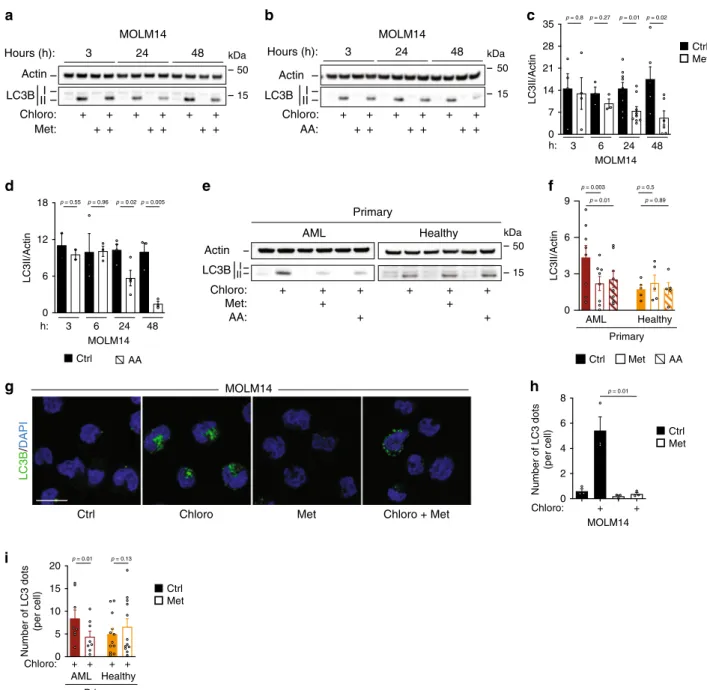
autophagy. To measure the autophagic
flux, the conversion of
LC3B-I to LC3B-II that reflects the number of autophagosomes
30was assessed by immunoblotting in presence or absence of
chloroquine (chloro), an inhibitor of lysosomal degradation.
These experiments revealed that LC3B-II accumulation was
sig-nificantly (>50% after 48 h) decreased in metformin- or
AA-treated AML cells from cell lines and primary patient specimens
(Fig.
3
a–f, Supplementary Fig. 3a–c), but not in normal
hema-topoietic cells (Fig.
3
e, f). We confirmed the impact of ETC on
autophagy with immunofluorescence studies of endogenous
LC3B. The number of autophagosomes per cell was significantly
decreased upon metformin treatment compared to controls in all
AML cells, without modification in number of autophagosomes
detected in healthy cells (Fig.
3
g–i, Supplementary Fig. 3d–f).
Furthermore,
flow cytometry analysis of autophagic vacuoles
using Cyto-ID assay fully confirmed this observation in AML
cells (Supplementary Fig. 3g). Altogether these approaches
con-sistently support the contention that mitochondrial ETC and
OxPHOS activity positively regulate autophagy in AML cells, but
not necessarily in normal hematopoietic cells.
OxPHOS regulates MERCs number and function. These
above-mentioned results demonstrate that the capacity of mitochondria
to regulate the lipid availability through autophagy seems unique
to tumor cells. Therefore, we next investigated how mitochondria
mechanistically control autophagy in AML cells. Electron
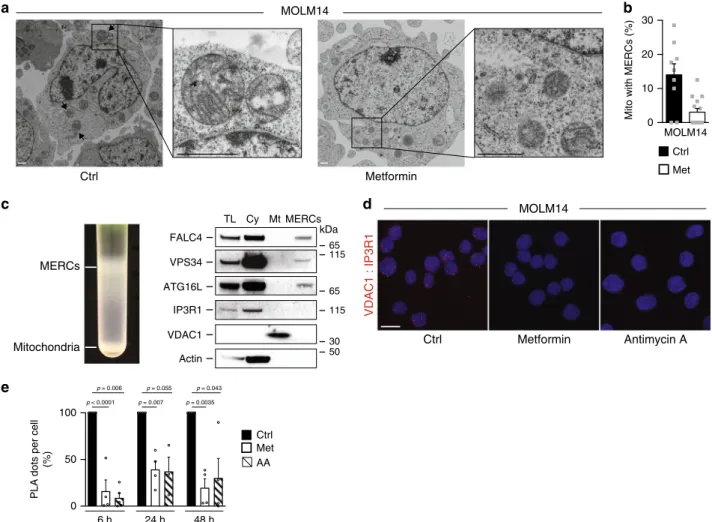
microscopy analysis of AML cell lines showed that ~20% of the
mitochondria were in close proximity to the ER (Fig.
4
a, b,
Supplementary Fig. 4a, b). These inter-organelle contacts between
mitochondria and the ER called MERCs are now recognized as
essential regulators of fundamental cellular processes, including
autophagy
31, bioenergetics
32, and as key players in oncogenesis
33.
Interestingly, metformin markedly reduced the number of these
MERCs (Fig.
4
a, b, Supplementary Fig. 4a, b) without affecting
the length (MOLM14: 204 nm ± 22; MOLM14
+ Met: 228 nm ±
20; U937: 361 nm ± 36; U937
+ Met: 253 nm ± 27), the number
or mass of mitochondria (Supplementary Fig. 4c, d). Expectedly,
since one of the key functions of MERCs is to regulate calcium
homeostasis, both metformin and AA reduced the mitochondrial
calcium content. This thus suggests a MERCs-dependent
diminished Ca
2+transfer from ER to mitochondria
(Supple-mentary Fig. 4e). In addition, MERCs support autophagy by the
recruitment of protein–protein complexes implicated in the
autophagosome formation
34,35. To next validate the role of
MERCs in autophagosome formation in AML cells, we developed
a protocol based on Wieckowski et al. subcellular fractionation
procedure
36. We fractionated extracts of AML cells and
char-acterized the MERCs fraction by the presence of FALC4 (Fig.
4
c).
Of note, the absence of detection of VDAC1 and IP3R1 in this
fraction was likely due to the relative low amount of proteins
obtained at the end of the procedure. This analysis allowed us to
determine the presence of two proteins implicated in
autopha-gosome biogenesis in these enriched MERCs fractions by Western
blotting, Vps34 and ATG16L (Fig.
4
c). We therefore
hypothe-sized that the inhibition of autophagy observed upon ETC
inhi-bition in AML cells was due to a reduction of MERCs. To explore
this, we
first used the proximity ligation assay (PLA) to
investi-gate mitochondria–ER contacts as described by Tubbs et al.
37. We
used one antibody targeting the inositol trisphosphate receptor
(IP3R1) located on the ER, and another one targeting the
voltage-dependent anion channel (VDAC1) present in the outer
mem-brane of mitochondria, both proteins (IP3R1 and VDAC1) are
located at MERCs. Interactions between the two organelles were
visualized by red dots as observed in control cells (Fig.
4
d).
Consistent with our electron microscopy data, we confirm that
metformin or AA significantly decreased the number of MERCs
compared to vehicle-treated cells (Fig.
4
e). Interestingly, this loss
of contact sites rapidly occurred, as early as 6 h after
mitochon-drial inhibition (Fig.
4
e), prior to detection of autophagy
inhibi-tion (Fig.
3
a–d). Importantly, this was not due to the decrease in
VDAC1 and IP3R1 expression upon metformin and AA
treat-ment (Suppletreat-mentary Fig. 4f).
MERCs regulate lipophagy to sustain OxPHOS. These
findings
suggest that mitochondrial function appears to regulate MERCs
formation and are consistent with the notion that the inhibition
of autophagy and the subsequent accumulation of LD observed
upon ETC inhibition was due to the loss of MERCs. To validate
this possibility and to prevent MERCs formation, we generated
AML cells expressing an shRNA directed against VDAC1 or cells
depleted for mitofusin2 (Mtfn2) protein by siRNA, a critical
player in the formation of MERCs
38. Electron microscopy studies
performed on cells depleted for Mtfn2 or VDAC1 showed that
the percentage of mitochondria in close contact with the ER was
decreased compared to control cells (Fig.
5
a, b, Supplementary
Fig. 5a). Of note, the number of mitochondria per cell and the
mitochondrial mass between cells depleted or not for Mtfn2 or
VDAC1 were roughly the same (Supplementary Fig. 5b, c).
Moreover, Mtfn2-depleted cells displayed a significant decrease in
PLA dots compared to control cells (Fig.
5
c). These results
therefore indicate that a loss of Mtfn2 in AML cells led to a
reduction of MERCs. We next investigated whether these contact
sites modulate autophagy and subsequently lipid metabolism in
AML cells. In accordance with the literature
34, the decrease in
MERCs resulting from Mtfn2 or VDAC1 depletion decreased the
number of autophagosomes (Fig.
5
d, e) and the autophagic
flux
(Supplementary Fig. 5d, e) in AML cells. In addition, the silencing
of an ER protein, IP3R1, rather than a mitochondrial protein,
expected from our hypothesis,
fluorescent microscopy analysis
showed that both Mtfn2 or VDAC1 depletion led to an
accu-mulation of LD compared to control cells (Fig.
5
f, g).
Accord-ingly, electron microscopy analysis showed that Mtfn2- or
VDAC1-silenced AML cells accumulated LD (Fig.
5
a,
Supple-mentary Fig. 5a). Moreover, since the expression of FASN, ACLY,
and ADRP was not modified and no change in the subcellular
localization of the transcription factor SREBP1/2 was observed
upon Mtfn2 depletion (Supplementary Fig. 5g, h), LD biogenesis
is likely not affected with MERCs inhibition. All of these results
phenocopied the effects observed upon metformin treatment
(Fig.
2
c, Supplementary Fig. 2k, l). Collectively, these data
indi-cate that autophagy inhibition observed upon mitochondrial
respiration inhibition was due to a reduction in the number of
MERCs and is consistent with mitochondria regulating
autop-hagy through mitochondria–ER contact sites in AML cells.
Similar to autophagy inhibition (Fig.
1
j, k, Supplementary
Fig. 1m–p), the decrease of MERCs upon VDAC1 or Mtfn2
depletion resulted in a decreased OCR (Fig.
5
h, Supplementary
Fig. 5i, j) and mitochondrial ATP production-linked OCR
Chloro: III LC3B Actin + + + + + + Met: + + + + + + 3 24 48 MOLM14 Hours (h):
a
Actin III LC3B Chloro: AA: Hours (h): 3 24 48 + + + + + + + + + + + + 3 6 Ctrl Metb
24 48 LC3II/Actin AAc
e
LC3B / DAPI Ctrl Metf
MOLM14 LC3II/Actin Ctrl Met AA MOLM14 p = 0.8 h: p = 0.27 p = 0.01 p = 0.02 3 6 24 48 h: LC3II/Actin Ctrl p = 0.55 p = 0.96 p = 0.02 p = 0.005d
Number of LC3 dots (per cell)g
Chloro: + + Primary Healthy AML p = 0.13 p = 0.01 p = 0.01 Number of LC3 dots (per cell)h
Chloro: + + + + MOLM14 Ctrl Met Ctrl Met Primary Healthy AML p = 0.003 p = 0.01 p = 0.5 MOLM14 MOLM14Chloro Chloro + Met
LC3B Actin Met: Chloro: Primary AA: III + + + + +
i
Healthy + + + + + AML 0 7 14 21 28 35 0 6 12 18 0 3 6 9 p = 0.89 kDa 50 15 kDa 50 15 kDa 50 15 0 2 4 6 8 0 5 10 15 20Fig. 3 Inhibition of OxPHOS reduces autophagicflux. a, b Western blots of LC3B and actin from at least three independent experiments of MOLM14 cells
treated with metformin (Met) (a) or with antimycin A (AA) (b) ± chloroquine (chloro) for the indicated times are shown. c, d LC3B-II/actin ratios identified
by densitometries from Western blots shown ina, b in MOLM14 cells treated with Met (c) or with AA (d) in presence of chloro. Data are means ± s.e.m,
(at leastn = 3, unpaired t-test). e Western blots of LC3B and actin from primary AML (n = 8) or normal (n = 5) cells treated with Met or with AA ± chloro.
f Primary AML patient cells (n = 8 with Met, n = 8 with AA) and primary normal hematopoietic cells (PBMC) were treated with Met (n = 5) or AA (n = 5)
for 48 h in presence of chloro followed by immunoblotting for LC3B and actin. Histograms represent the LC3B/actin ratios obtained by densitometric
analysis of Western blots (pairedt-test). g, h Representative confocal pictures from three independent experiments of MOLM14 cells treated with Met for
48 h ± chloro,fixed and stained for LC3B and DAPI. Scale bar: 10 µm. g Histograms represent the number of LC3B puncta per cell (h), (n = 3, unpaired
t-test). i Primary AML patient cells (n = 8) and primary normal hematopoietic cells (PBMC n = 8, CD34+n = 4) were treated or not with Met for 48 h ±
compared to control cells (Supplementary Fig. 5k). Furthermore,
when autophagy was inhibited (siBeclin1) or MERCs were
dis-rupted (siMtfn2), mitochondria of AML cells pulsed with a
fluorescent fatty acid lipid (RC
12) exhibited less overlap with this
lipid
,due to the accumulation of RC
12into the cytoplasm (Fig.
5
i,
j). These results indicate that lipids upon autophagy inhibition or
MERCs disruption were not utilized and oxidized by
mitochon-dria. Furthermore, the addition of exogenous fatty acids upon
autophagy inhibition or MERCs disruption restored
mitochon-drial respiration (Fig.
5
k). Altogether, these results suggest that
MERCs through autophagy regulation control lipid catabolism
that supports mitochondrial OxPHOS in AML cells. Since ETC
inhibitors reduced MERCs number and functions (Fig.
4
,
Sup-plementary Fig. 4), we confirmed that autophagy inhibition and
subsequent accumulation of LD in metformin-treated cells are
due to the loss of MERCs by using an organelle linker, as
per-formed by Csordas G. et al.
39. Expression of this organelle linker
in MOLM14 cells (OMM-ER) reactivated calcium
flux from ER
into mitochondria and therefore restored MERCs upon
metfor-min treatment (Supplementary Fig. 5l). This prevented autophagy
inhibition and lipid accumulation induced by metformin
treat-ment (Fig.
5
l–o). Altogether, these data highlight the role of
MERCs formation regulated by mitochondria activity in
autop-hagosome formation to promote lipid degradation and
mito-chondrial OxPHOS in AML cells.
MERCs support the dialog between autophagy and OxPHOS.
Finally, to test the functional relevance of the role of
autophagy-dependent MERCs formation, we monitored the proliferation of
VDAC1-depleted cells in vitro and in vivo, or we daily treated
NOD-SCID-gamma (NSG) immunodeficient mice engrafted with
AML MOLM14 cells, with an oral potent ETC complex I
inhi-bitor, the IACS-010759
40. We
first validated that this ETC
complex I inhibitor phenocopied in vitro the results observed
with other ETC inhibitors metformin or AA on lipid metabolism
and autophagy. As expected, IACS-010759-treated cells
accu-mulated LD (Supplementary Fig. 6a, b) and displayed a reduction
of the autophagic
flux (Supplementary Fig. 6c–f). These
experi-ments showed that VDAC1 depletion or IACS-010759 treatment
significantly affected cell proliferation in vitro (Supplementary
Fig. 6g, h) and tumor growth in vivo (Fig.
6
a, c). Mice engrafted
with shVDAC1 AML cells or treated with IACS-010759 displayed
a marked reduction of the total tumor cell burden and a
sig-nificant increase in overall survival compared to mice injected
a
b
Ctrl
MOLM14
Metformin
Mito with MERCs (%)
MOLM14 Ctrl Met
c
Ctrl Metformin VDAC1 : IP3R1 Antimycin A MOLM14 Ctrl Met AA PLAdots per cell
(%) 6 h 24 h 48 h p = 0.006 p < 0.0001 p = 0.055 p = 0.007 p = 0.043 p = 0.0035
e
0 10 20 30d
FALC4 TL VPS34 ATG16L IP3R1 VDAC1 Actin Cy Mt MERCs MERCs Mitochondria kDa 65 115 65 50 30 115 0 50 100Fig. 4 OxPHOS regulates MERCs number and function. a MOLM14 cells treated with metformin (Met, 10 mM) for 24 h werefixed and processed for
electron microscopy analysis. Representative electron microscopy pictures from two independent experiments are shown. Arrows indicate MERCs. Scale
bar: 1µm. b Histograms represent the % of mitochondria that are in contact with endoplasmic reticulum per cell treated or not with Met from pictures
displayed ina. Data are means ± s.e.m with each dot corresponding to one cell. c Protein components of subcellular fractions (left panel) from two
independent experiments prepared from MOLM14 cells revealed by immunoblot analysis (right panel). TL: total lysate, Cy: cytosol, Mt: pure mitochondrial
fraction, MERCs: mitochondria–ER contact site fraction. d Representative orthogonal confocal projections of Z sections of PLA (red signal) between VDAC1
and IP3R1 from MOLM14 cells treated or not with Met or antimycin A (AA) for 48 h (at leastn = 3). Scale bar: 10 µm e Quantitative analysis of PLA signal
with control cells (Fig.
6
b, d). Furthermore, we observed an
increase of lipids (Fig.
6
e–g), a decrease in autophagy (Fig.
6
h)
along with a reduction of MERCs (Fig.
6
i) in human AML cells
from mice treated with IACS-010759, confirming that the
observed impact of IACS-010759 in vivo is due to MERCs
disruption with subsequent autophagy inhibition and lipid
accumulation. Thus, proliferation and tumorigenicity of AML
cells are linked to their ability to produce FFAs via autophagy to
ensure mitochondria function that controls in turn autophagy
through MERCs formation (Fig.
6
j). In conclusion, our data
reveal the existence of a
finely tuned interplay between
mito-chondria and autophagy occurring in tumor cells to supply FFAs
shCtrl shVDAC1 siCtrl siMtfn2
d
Number of LC3 dots (per cell) shCtrl shVDAC1 siCtrl siMtfn2 MOLM14f
siCtrl siMtfn2 Bodipy 493-503 / DAPINumber of Bodipy dots
(per cell)
Area of Bodipy dots
(per cell) siCtrl siMtfn2 shCtrl shVDAC1 siCtrl siMtfn2 VDAC1 : IP3R1
c
MOLM14h
MOLM14 MOLM14 MOLM14 p = 0.02 LC3B / DAPI p = 0.004 p = 0.012 MOLM14 shCtrl shVDAC1 MOLM14 p = 0.04 p = 0.002 MOLM14g
p = 0.04 p = 0.025 p=0.027 p = 0.021 MOLM14 PLA dots (%) 100 23.7 +/– 11.2a
b
e
Mito with MERCs (%)
siCtrl siMtfn2 0 20 40 60 80 Actin III LC3B Chloro: Met: MOLM14 + + + + + + + + OMM OMM-ER shCtrl shVDAC1 siCtrl siMtfn2 shCtrl shVDAC1 siCtrl siMtfn2
i
j
k
m
TOMM 20 / RC 12 MOLM14siCtrl siBeclin1 siMtfn2
0.0 0.2 0.4 0.6 0.8 1.0 M2:fraction of RC 12 overlapping T OMM20 p < 0.001 p = 0.005 p < 0.001 p < 0.001 p = 0.42 p < 0.44 Basal OCR (%) siMtfn2 siBec siCtrl Oleate: + + + siMtfn2 siBec siCtrl MOLM14
l
n
LC3II/Actin p = 0.003 p = 0.15 OMM OMM-ER OMM OMM-ER OMM OMM-ER Ctrl Met Ctrl Metformin Ctrl Metformin OMM OMM ERo
Number of Bodipy dots
(per cell)
p = 0.025 p = 0.68
p = 0.03 p = 0.63
Area of Bodipy dots
(per cell) Ctrl Met MOLM14 kDa 50 15 0 2 4 6 0 1 2 3 4 0 1 2 0 100 200 300 400 p = 0.027 0 70 140 0.0 0.5 1.0 0 1 2 3 4 0 1 2 Basal OCR (pmol/min/2.10 5 cells) Bodipy 493-503 / DAPI
to support OxPHOS, and the role of lipids as an essential
sub-strate for AML cell proliferation both in vitro and in vivo (Fig.
6
j).
Discussion
Autophagy is frequently activated in cancer and largely associated
with metabolic reprogramming and oncogenesis. Our
findings
show that autophagy occurring at a specific subcellular location,
namely the interconnection between mitochondria and the ER,
supplies FFAs to maintain mitochondrial energy metabolism that
enables cell proliferation in vitro and in vivo. Furthermore, we
found that mitochondrial respiratory chain activity supports
autophagy through the regulation of MERCs formation.
Alto-gether these data support a model depicting a bidirectional
relationship between autophagy and mitochondria metabolism, in
which mitochondria regulates its supply of FFAs by regulating
autophagosome formation at MERCs. This relationship allows for
the physical and functional integration of LD degradation with
the supply of FFAs to fuel the TCA cycle in adjacent
mito-chondria, and supports the notion that lipid transfer proteins
could be located at MERCs (Fig.
6
j).
Autophagy could degrade LD
25and release FFAs that are then
oxidized via mitochondrial FAO. ETC inhibitors including
formin are known to regulate autophagy. However, while
met-formin is mainly described as an autophagy inducer through its
agonist action on AMPK
41,42, we report here alongside with two
studies
43,44, the unexpected
finding that OxPHOS inhibitors such
as metformin can interfere with and inhibit autophagosome
formation. Moreover, as opposed to what it was shown in
adi-pocytes and hepatocytes
45,46, we showed that metformin inhibits
lipid degradation and FAO in AML cells. This occurred at less
extend in normal hematopoietic cells.
Cumulatively, our results indicate that the inhibition of
autophagy and the subsequent accumulation of LD observed
upon ETC inhibition are a consequence of MERCs disruption.
Upon ETC inhibition, MERCs alteration is an early event (6 h)
before the reduction of autophagy (24 h) and the accumulation of
LD at later stage (48 h). In addition, restoring MERCs formation
and calcium uptake by the mitochondria using the
mAKAP1-mRFP-yUBC6 (i.e., OMM-ER) organelle linker
39prevented
metformin-induced autophagy inhibition and LD accumulation.
MERCs have been previously reported as an important site of
autophagosome formation in cancer cells
34,
fibroblasts
35, and in
epithelial cells
47. However, the role of MERCs in autophagosome
formation was not yet described in AML cells. Then, the
con-stitutive presence of key molecules involved in the early events of
autophagic
flux (Vps34 and ATG16L, two proteins located on the
isolation membrane during the
first step of autophagosomes
formation) in purified MERCS confirms their crucial roles in
autophagosome formation and in AML autophagy.
Cancer cells usually exhibit an exacerbated metabolism
com-pared to their normal counterpart. Even if this metabolic
repro-gramming, known as the Warburg effect, originally consisted to
use the glycolysis to produce energy, a vast majority of cancer
cells rely rather on mitochondrial oxidative metabolism
48. Several
solid and blood cancers have dependency on OxPHOS and/or
FAO pathways either in steady state
28,49,50and in metastasis
51,52,
but also upon treatments
17,18. This suggest that understanding
better the contribution of respiratory sources, such as FFAs to
mitochondrial OxPHOS
44will be crucial to deeper
fight against
cancer, drug resistance, and relapse. Therefore, our study
iden-tified the interplay between mitochondrial metabolism and
autophagy as a critical regulator in AML cell proliferation, and
could represent a potential therapeutic target for AML patients.
This should be further explored in other cancers that rely on
mitochondrial metabolism
53,54.
Methods
AML cell lines. The human myeloid leukemia cell lines, MOLM14 and U937 were purchased from the Leibniz Institute DSMZ-German Collection of Microorgan-isms and Cell Cultures (Leibniz, Germany). MOLM14 shATG12 were previously generated in our laboratory. MOLM14 CRISPR CTL or AMPK-KO were a gift from Prof. Jérome Tamburini (University of Geneva, Switzerland). Cells were
grown in minimum essential medium-α medium with Glutamax (Gibco, Life
Technologies) supplemented with 10% fetal calf serum (Sigma).
Primary AML cells and normal hematopoietic cells. Primary AML patient cells from peripheral blood have been collected during routine diagnostic procedures at the Toulouse University Hospital, after informed consent and stored at the HIMIP collection (BB-0033-00060). According to the French law, HIMIP collection has been declared to the Ministry of Higher Education and Research (DC 2008-307 collection 1) and obtained a transfer agreement (AC 2008-129) after approbation
by the“Comité de Protection des Personnes Sud-Ouest et Outremer II” (ethical
committee). PBMC were obtained from blood samples of healthy donors (Eta-blissement Français du Sang, EFS, Toulouse, France). CD34 positive cells were obtained after sorting from umbilical cord blood samples (Etablissement Français
du Sang, EFS, Besançon, France). Normal hematopoietic cells (PBMC and CD34+)
were obtained from EFS that is a governmental agency collecting and delivering blood products, all procedures in use at EFS are defined by the Law. For samples
aimed at research use a personal“informed consent” form is signed at the time of
collection. This form was validated by the“Agence de la Biomedecine” the body
that, in France, rules all type of samples of human origin, on ethical and practical aspects, for research or clinical applications. Clinical and biological annotations of the samples have been declared to the CNIL (Comité National Informatique et Libertés, i.e., Data processing and Liberties National Committee). Briefly, mono-nuclear cells were separated by Ficoll–Hypaque density gradient centrifugation and incubated in RBC lysis buffer (ammonium chloride solution) to remove red blood
cells. CD34+cells isolation was performed using manufacturer’s instructions
(EasySepTM, STEMCELL). Primary AML, PBMC, and CD34+samples were
Fig. 5 MERCs regulate lipophagy to sustain OxPHOS. a MOLM14 cells transfected with siRNA control (Ctrl) or mitofusin2 (Mtfn2) were processed for
electron microscopy analysis. Electron microscopy pictures from one experiment are shown. Scale bar: 1µm. b Histograms represent the % of mitochondria
in contact with ER. Each dot corresponding to one cell.c Images of proximity ligation assay between VDAC1 and IP3R1 from MOLM14 transfected with Ctrl
or Mtfn2 siRNAs (n = 3). Scale bar: 10 µm. Numbers represent the % of dots in cells transfected with siRNA Mtfn2 compared with cells transfected
with siRNA Ctrl.d, e MOLM14 cells were transduced with Ctrl or VDAC1 shRNAs (n = 4) or transfected with Ctrl or Mtfn2 siRNAs (n = 6), and stained
for LC3B and DAPI. Confocal sections (at least four independent experiments) are shown. Scale bar: 10µm (d). Histograms represent the number of
LC3B puncta per cell (e) (unpairedt-test). f, g MOLM14 cells transduced with Ctrl or VDAC1 shRNAs (n = 3) or transfected with Ctrl or Mtfn2 siRNAs
(n = 6) were stained for Bodipy and DAPI. Scale bar: 10 µm, (f). Histograms show the number or the area of Bodipy dots per cell (g) (unpaired t-test).
h Measurement of basal oxygen consumption rate (OCR) in MOLM14 cells transduced with Ctrl or VDAC1 shRNAs (n = 6) or transfected with Ctrl or
Mtfn2 siRNAs (n = 6, unpaired t-test). i, j MOLM14 cells transfected with Ctrl or Beclin1 (Bec) or Mtfn2 siRNAs and incubated with RC12, were stained for
TOMM20 and confocalZ-stacks were acquired (three independent experiments). Scale bar: 10 µm (i). Fraction of RC12overlapping TOMM20 staining (j).
siCtrl (n = 17), siBec (n = 18), and siMtfn2 (n = 13, unpaired t-test). k Measurement of OCR in MOLM14 cells transfected with Ctrl (n = 8), Bec (n = 7), or
Mtfn2 siRNAs (n = 8) ± Oleate-BSA. l–o MOLM14 cells were transduced with the mitochondria–ER organelle linker (OMM-ER) and its control (OMM),
treated ± metformin, and subjected to Western blot analysis for actin and LC3B (l, m) or stained for Bodipy and DAPI (n, o) (three independent
experiments). Scale bar: 10µm. Histograms represent the number of LC3B puncta (m) or the area of Bodipy dots per cell (o) unpaired t-test. Data are
maintained in Iscove’s Modified Dulbecco’s Medium supplemented with 20% fetal calf serum.
Antibodies and reagents. The following antibodies from Cell Signaling Tech-nology were used: rabbit antibodies against LC3B (#2775), ATG12 (#4180), FASN (#3180), Beclin1 (#3738), and mouse antibodies against HSP90 (#4874). Mouse antibodies from Santa Cruz Biotechnology against IP3R1 (sc-271197) and E2F1 (KH95), from Millipore against actin, rabbit antibody from Abcam against VDAC1 (ab15865), from PROGEN against ADRP (610102), from R&D System against FABP4 (AF3150), from Atlas Antibodies against ACLY (HPA022434), from Novus Biologicals against SREPB1 (NB600-582), from Invitrogen against SREBP2 (PA1-338), and from GeneTex against TOMM20 (GTX133756) were also used. Sec-ondary antibodies labeled with horseradish peroxidase were purchased from
Pro-mega and those coupled withfluorophores were purchased from Invitrogen. Rabbit
anti-LC3B from MBL (#PM036) was used for immunofluorescence analysis. For
flow cytometry studies, the antibodies anti-hCD45-APCH7 (BD Biosciences; 641417), CD33-PE (BD Biosciences; 555450), Annexin-V-V500 (BD Biosciences;
561501), and BD Via-ProbeTM(BD Pharmingen) were used. Bafilomycin (20 nM)
and 3-MA (5 mM) were purchased from InvivoGen. Chloroquine (20μM),
met-formin (10 mM), antimycin (10μM), and lalistat2 (20 μM) were obtained from
Sigma Aldrich. BodipyTM493/503 probe was purchased from
Thermo-FisherScientific. Etx (3 μM, HY-50202A) was purchased from Medchem. EBSS (24010-43, Gibco) was used to induce autophagy.
Subcellular fractionation. Buffer A: 20 mM Hepes pH7.4, 10 mM NaCl, 1.5 mM MgCl2, 0.2 mM EDTA, 20% glycerol, 1 mM DTT, 0.1% NP-40, and protease inhibitors.
Buffer B: 20 mM Hepes pH7.4, 500 mM NaCl, 1.5 mM MgCl2, 0.2 mM EDTA, 20% glycerol, 1 mM DTT, 0.1% NP-40, and protease inhibitors.
a
0 5 10 15 CD45+ CD33+ cells (millions) Mice survival (%) shVDAC1 shCtrl MOLM14b
Daysc
p=0.004 p < 0.0001 0 20 40 60 0 50 100 shCtrl shVDAC1d
0 5 10 15 20 25 CD45+ CD33+ cells (millions) IACS Ctrl MOLM14 Mice survival (%) Days p < 0.0001 Ctrl IACS p = 0.003 0 10 20 30 40 0 50 100g
e
LC3II/Actin: III LC3B Actin IACS: + 1 0.68f
–Number of Bodipy dots
(per cell)
Area of Bodipy dots
(per cell) p = 0.04 MOLM14 MOLM14 Ctrl IACS MOLM14 p = 0.18
h
i
MOLM14 Ctrl IACS VDAC1 : IP3R1 IACS IACS Ctrl Ctrlj
mitoCa2+ Autophagy FFA FAO OCR mitoATP Basal oxidative phosphorylationAML cell proliferation
Inhibition of oxidative phosphorylation AML cell proliferation
Calcium Grp75 IP3R1 VDAC1 Mfn2 CPT1/2 Free fatty acid Electron Transfer Chain (ETC) Lipid catabolism MERCs Autophagosome formation ETC inhibition Lipid droplet accumulation MERCs disruption Autophagy inhibition Ca2+ NADH I II III IV V I II III IV V TCA
cycle Acetyl-CoA FAO FA-CoA
ATP LD Autophagosome Autolysosome Lysosome NADH TCA
cycle Acetyl-CoA FAO
ATP FA-CoA LD Lysosome p = 0.02 PLA dots/ cell 1.5 +/– 0.3 kDa 50 15 0 2 4 6 8 10 0 2 4 6 2.5 +/– 0.25 Bodipy 493-503 / DAPI
Cells were washed with ice-cold phosphate-buffered saline (PBS) pH 7.4. After
centrifugation, cell pellets were resuspended in 250μL of ice-cold buffer A and kept
for 10 min in ice. A total of 20μL of the lysate were removed as “total lysate” and
nuclei were pelleted by centrifugation at 500 × g for 5 min at 4 °C.
The supernatant was removed as the“cytosolic fraction” and the pellet of nuclei
was gently washed with 350μL of buffer A and centrifuged at 500 × g for 5 min.
The supernatants were discarded. The nuclear pellets were resuspended in 100μL
of hypotonic buffer B and allowed to swell on ice for 30 min. The extract was separated by centrifugation at 21,000 × g for 15 min at 4 °C. The supernatant was
collected and designated as“nuclear fraction”. All fractions were resuspended in
Laemmli sample buffer and“nuclear fractions” and “total lysate” that contained
DNA were sonicated.
Isolation of mitochondria-associated membranes. MERCs fractions were
iso-lated according to the Nature Protocols from Wieckowski et al.36. The cell number
and the cell lysis method were adapted for AML cells. Briefly, 2.5 billion of
MOLM14 cells were washed with PBS (with Ca2+ and Mg2+) and centrifuged at
600 × g 5 min at 4 °C, twice. Cells were resuspended at 200 millions of cells per mL with the buffer 1 (225 mM mannitol, 75 mM sucrose, 0.1 mM EGTA, and 30 mM Tris HCl pH 7.4) and disrupted using a nitrogen cavitation chamber (PARR Instrument, 7 min at 35 psi). Nuclei and unbroken cells were pelleted by cen-trifugation at 600 × g for 5 min at 4 °C. After two cencen-trifugations, the pellet was discarded. The supernatant was collected and centrifuged at 7000 × g for 10 min at 4 °C to separate crude mitochondria (pellet) from microsome and ER fractions (supernatant). The crude mitochondrial fraction was suspended in 1 mL of buffer 2 (225 mM mannitol, 75 mM sucrose, and 30 mM Tris HCl pH 7.4). Mitochondrial suspension was centrifuged at 7000 × g for 10 min at 4 °C, and the supernatant was discarded. Mitochondrial pellet was suspended into 1 mL of buffer 2 and cen-trifuged at 10,000 × g for 10 min at 4 °C. The crude mitochondrial pellet was sus-pended into 2 mL of MRB buffer (250 mM mannitol, 5 mM HEPES, and 0.5 mM EGTA pH 7.4), layered on top of 8 mL Percoll medium (225 mM mannitol, 25 mM HEPES, pH 7.4, 1 mM EGTA, and 30% Percoll (v/v)), and centrifuged at 95,000 × g for 30 min at 4 °C. The MERCs fraction was collected from Percoll gradient, was washed to remove the Percoll by centrifugation at 6300 × g for 10 min followed by further centrifugation of the supernatant at 100,000 × g. Likewise, the pure mito-chondria fraction was collected from the bottom of Percoll gradient, washed twice with MRB and centrifuge at 6300 × g for 10 min at 4 °C to obtain a pellet. All the
fractions wereflash frozen and kept at −20 °C until use.
Western blot analysis. Proteins were separated using 4–12% gradient
poly-acrylamide SDS–PAGE gels (Life Technologies) and electrotransferred to 0.2 µm
nitrocellulose membranes (GE Healthcare). After blocking in Tris-buffered saline with 0.1% Tween and 5% bovine serum albumin, membranes were blotted over-night at 4 °C with the appropriate primary antibodies. Primary antibodies were detected using the appropriate horseradish peroxidase-conjugated secondary antibodies. Immunoreactive bands were visualized by enhanced chemilumines-cence (PI32209; Thermo Fisher Scientific) with a Syngene camera. Densitometric analyses of immunoblots were performed using the GeneTools software. All full
scans of uncropped blots are available in the Supplementaryfile (Supplementary
Fig. 8).
LC3flux assay. LC3B-II/actin ratios identified by densitometric analysis from
Western blots were subtracted between ±chloro to get the net LC3flux between
control and treated conditions30.
Immunofluorescence analysis. For LC3B staining, cells were seeded onto glass
slides (Fisher Scientific) coated with 0.01% poly-L-lysine (Sigma), then fixed in 4%
formaldehyde for 8 min. After PBS washes, cells were incubated in 0.01% saponin containing 3% BSA for 30 min and then incubated with anti-LC3B antibodies (MBL, 1/700) for 45 min. Cells were then washed before incubation with an anti-rabbit Alexa-488 secondary antibody (Invitrogen) for 30 min, followed by PBS and
distilled H2O washes and mounting in ProLongTMGold antifade medium with
DAPI (4′6-diamidino-2-phenylindole, Invitrogen). Images were acquired using a
confocal Zeiss LSM 780. For quantification, fields were chosen arbitrarily based on
DAPI staining, and the number of LC3B dots per cell of at least 100 cells per independent experiment was determined with Image J software.
Lipid chase. For lipid chase experiments, AML cells were labeled with 1 mM of the
fluorescent fatty acid BODIPY 558/568 C12(RC12Thermo Fisher Scientific)
over-night in complete culture medium. After two washes, AML cells were seeded on
coverslips,fixed, and stained for mitochondrial network with TOMM20 (Genetex,
133756) like for LC3B staining. For imaging of the mitochondrial network and
RC12distribution, 6–8 µm Z-stacks at 0.18 µm were used. Fluorescence signals were
analyzed using high resolutionfluorescence microscopy. Images were taken with a
Zeiss LSM 880 FAST Airyscan using a 63× Plan-Apochromat objective with 1.4
aperture under immersion oil. The Manders 2 (M2) coefficient, or fraction of RC12
signal overlapping mitochondrial network, was determined from Z-stack
projec-tions of RC12and mitochondrial network using the Fiji JACoP plugin.
Duolink PLA. Duolink II PLA (Sigma) enables the detection of protein interactions
(<40 nm) as an individualfluorescent dot by microscopy. Cells were fixed 10 min
with 4% paraformaldehyde and permeabilized for 15 min with PBS 0.1% Triton
X100. The proximity ligations were performed according to the manufacturer’ s
protocol. Preparations were mounted and analyzed similarly to immunofluorescence.
Flow cytometry (FACS) analysis. Flow cytometry experiments were performed on
CytoFLEXflow cytometer (Beckman Coulter) instrument. After harvesting,
sus-pensions of murine bone marrow and spleen were stained with 2 µl of CD45-APCH7 (BD Biosciences; 641417), 2 µl of CD33-PE (BD Biosciences; 555450) for 20 min, and cells were washed in PBS and resuspended in Annexin-V binding buffer (BD biosciences; 556454) plus 2 µl of Annexin-V-V500 (BD Biosciences; 561501).
Absolute cell numbers of viable human blasts (CD45+/CD33+/Annexin-V−) were
quantified using CountBright™ (Invitrogen). FACS analysis was also used to determine mitochondrial mass of AML cells. Cells were washed with PBS and
stained with MitoTracker™ Green FM (MTG, 1/10,000) for 20 min at 37 °C. Cells
were then washed and resuspended in Annexin-V binding buffer (BD biosciences; 556454) plus 2 µl of Annexin-V-V500 (BD Biosciences; 561501).
Cell lipid content was measured byflow cytometry using the Bodipy 493/503
probe. Briefly, cells were washed, incubated with Bodipy (0.5 µg/mL) for 30 min at 37 °C, then washed and resuspended with Annexin binding buffer (BD bioscience; 556454) and stained with Annexin-V APC (BD bioscience; 550474) to exclude apoptotic cells. Data were analyzed with FlowJo v10 software (Tree Star Inc., Ashland, OR, USA).
Cyto-ID®. Autophagic flux was assessed using the Cyto-ID®-based procedure
according to the manufacturer’s instructions (Enzo Life Sciences, Switzerland). The fluorescence of the Cyto-ID® dye incorporated into the different AML cells was
analyzed by afluorescence-activated cell sorter on a Macsquant (Miltenyi Biotec,
Paris, France)flow cytometer.
Fig. 6 MERCs support the dialog between autophagy and OxPHOS. a, b NSG mice (n = 31) were engrafted with MOLM14 cells expressing the Ctrl or
VDAC1 shRNAs by intravenous injection. Seventeen days post graft,five mice shCtrl and six mice shVDAC1 were killed, and the number of human cells
(hCD45+ and hCD33+) in the bone marrow and spleen was analyzed by flow cytometry. Graphs represent the number of human positive cells for hCD45
and hCD33 within the murine bone marrow and spleen from one experiment (a) (unpairedt-test). The remaining mice per group were used for overall
survival analysis (b). Graph represents the Kaplan–Meier survival curves (Log-rank test). c, d NSG mice (n = 39) were engrafted with MOLM14 cells and
daily treated with vehicle or IACS-010759 by gavage. Seventeen days post graft, nine mice vehicle group and 11 mice IACS-010759-treated group were
killed, and the number of human cells (hCD45+ and hCD33+) in the bone marrow and spleen was analyzed by flow cytometry. Graphs represent the
number of human positive cells for hCD45 and hCD33 within the murine bone marrow and spleen (c) (unpairedt-test). The remaining mice were used for
overall survival analysis (d). Graph represents the Kaplan–Meier survival curves (Log-rank test). e–g Viable bone marrow AML blasts from mice treated
with IACS-010759 were stained for Bodipy 493/503 and DAPI. Scale bar: 10µm (e). Histograms show the number or the area of Bodipy 493/503 dots per
cell (f, g) (unpairedt-test). h Viable bone marrow AML blasts from mice treated with IACS-010759 (one experiment) were subjected to Western blot
analysis for actin and LC3B. Numbers indicate ratios obtained by densitometric analysis.i Purified viable bone marrow AML blasts from mice treated with
IACS-010759 (one experiment) were subjected to PLA assay. Numbers represent the number of PLA dots per cell (minimum 130 cells, unpairedt-test).
Scale bar: 10µm (j). Schematic diagram depicting the interplay between the autophagy process and the mitochondria in AML cells. Autophagy appears as a
major regulator of mitochondria activity with the mitochondria controlling its supply of FFAs by regulating the number of autophagosomes via the formation MERCs. Data are means ± s.e.m.