HAL Id: hal-01249018
https://hal.archives-ouvertes.fr/hal-01249018
Submitted on 7 Jan 2016
HAL is a multi-disciplinary open access
archive for the deposit and dissemination of
sci-entific research documents, whether they are
pub-lished or not. The documents may come from
teaching and research institutions in France or
abroad, or from public or private research centers.
L’archive ouverte pluridisciplinaire HAL, est
destinée au dépôt et à la diffusion de documents
scientifiques de niveau recherche, publiés ou non,
émanant des établissements d’enseignement et de
recherche français ou étrangers, des laboratoires
publics ou privés.
Comparison of Stochastic and Variational Solutions to
ASL fMRI Data Analysis
Aina Frau-Pascual, Florence Forbes, Philippe Ciuciu
To cite this version:
Aina Frau-Pascual, Florence Forbes, Philippe Ciuciu. Comparison of Stochastic and Variational
Solutions to ASL fMRI Data Analysis. Medical Image Computing and Computer-Assisted
Inter-vention - MICCAI 2015, Oct 2015, Munich, Germany. pp.85-92, �10.1007/978-3-319-24553-9_11�.
�hal-01249018�
solutions to ASL fMRI data analysis
Aina Frau-Pascual1,3, Florence Forbes1, and Philippe Ciuciu2,3
p1qINRIA, Univ. Grenoble Alpes, LJK, Grenoble, France p2qCEA/DSV/I2
BM/NeuroSpin, Bˆat. 145, F-91191 Gif-sur-Yvette, France
p3q
INRIA/CEA Parietal team, NeuroSpin, Bˆat. 145, F-91191 Gif-sur-Yvette, France
Abstract. Functional Arterial Spin Labeling (fASL) MRI can provide a quantitative measurement of changes of cerebral blood flow induced by stimulation or task performance. fASL data is commonly analysed using a general linear model (GLM) with regressors based on the canon-ical hemodynamic response function. In this work, we consider instead a joint detection-estimation (JDE) framework which has the advantage of allowing the extraction of both task-related perfusion and hemodynamic responses not restricted to canonical shapes. Previous JDE attempts for ASL have been based on computer intensive sampling (MCMC) methods. Our contribution is to provide a comparison with an alternative varia-tional expectation-maximization (VEM) algorithm on synthetic and real data.
1
Introduction
Arterial Spin Labeling (ASL) [1] is a MRI modality that is able to provide a quantitative measurement of cerebral blood flow (CBF). ASL data consists of alternating pairs of control and magnetically tagged (“tag”) images. Local CBF or perfusion changes can be measured by considering the “control-tag” differ-ence. Many control-tag pairs (ą 50) need to be acquired to compensate for the low Signal-to-Noise Ratio (SNR) of this difference (»1-2%). Aside from its main use in static measurements, ASL has also been used in functional MRI (func-tional ASL or fASL) as an alternative quantitative imaging technique to the standard blood-oxygen-level-dependent (BOLD) [2] contrast imaging modality. fASL can provide more specific information about brain function but its lower SNR and temporal resolution make its analysis more challenging. The stan-dard approach for fASL data analysis is the general linear model (GLM) [3, 4]. It relies on the canonical hemodynamic response function (HRF) for defin-ing the hemodynamic and perfusion-related regressors, although the HRF has been calibrated in BOLD experiments only. Moreover, there has been strong ev-idence in the literature for space-varying and subject-specific HRF shape [5, 6]. To deal with this issue, a joint detection-estimation (JDE) framework, originally developed for BOLD data analysis [7, 8], has been extended in [9] to allow for the extraction of both task-related perfusion and hemodynamic responses while
2 A. Frau-Pascual, F. Forbes, P. Ciuciu
recovering perfusion-related and BOLD-related maps of evoked activity. Pre-vious JDE implementations for ASL have been based on Markov Chain Monte Carlo (MCMC) techniques. In this work, following the spirit of [8], we provide an alternative solution based on the variational expectation-maximization (VEM) algorithm and compare its performance to its MCMC alternative. In both solu-tions, prior knowledge is introduced on the relationship between perfusion and hemodynamic responses (resp. PRF and HRF) derived from physiological mod-els [10]. This prior allows us to benefit from a better estimation of the HRF due to higher SNR of the BOLD component in the ASL signal to inform the PRF estimation. As already observed in [8] for the BOLD case, JDE-VEM pro-vides comparable results to JDE-MCMC for a lower computational load. On top of that, JDE-VEM is more convenient to handle identifiability constraints (eg, unit norm or positivity constraint of the response shapes for solving the scale ambiguity issue in Eq. (1)).
2
Joint Detection Estimation model for fASL data
The JDE formalism is a region-based approach that considers hemodynamically homogeneous regions. In a region P comprising J voxels, the ASL JDE model [9, 11] defines voxel-specific ASL time series as the linear superposition of the M task-induced (or stimulus-specific) responses:
@j P P, yj“ M ÿ m“1 “am j X mh looomooon paq ` cmj W X mg looooomooooon pbq ‰ ` αjw loomoon pcq ` P `j loomoon pdq ` bj loomoon peq (1)
Each time series yj PRN is decomposed into (a) task-related hemodynamic and
(b) perfusion components, (c) a perfusion baseline term αjw1 which completes
the modelling of the perfusion component, (d) a drift component P `j and (e)
a noise term, assumed white Gaussian with variance σ2
j. The control/tag effect
is modelled in Eq. (1) by making use of w and W “ diagpwq. Vectors h and g represent the D-dimensional (D ă N ) unknown HRF and PRF shapes, constant within P. The magnitudes of activation or response levels for hemodynamic and perfusion components are a “ am
j ( and c “ cm j ( and referred to as HRLs and PRLs (hemodynamic and perfusion response levels) hereafter. X P RN ˆD is a binary matrix that encodes the lagged onset stimuli. The response
levels are assumed to follow different Gaussian mixture models but governed by M common binary hidden Markov random fields qm with qm
“ tqjm, j P Pu
encoding voxels activation states for each experimental condition m. HRLs and PRLs are assumed independent conditionally to these activation labels q “ tqm, m “ 1 : M u. For further details, please refer to [9].
As already mentioned, the perfusion component in the ASL signal has a very low SNR owing to its small size captured by the “control-tag” subtraction. To
1 Vector w is N -dimensional such that w
tn “ 1{2 if tn is even (control) and wtn “
address this issue, we make use of a link derived in [10] from physiological models between the two responses g “ Ωh. As a difference with [9], we then consider that HRF and PRF shapes follow prior Gaussian distributions h ∼ N p0, vhΣhq
and g|h ∼ N pΩh, vgΣgq, with covariance matrices Σh and Σg encoding a
con-straint on the second order derivatives so as to account for temporal smoothness of h and g, respectively. We also consider constraints on the response functions to enforce their L2-norm to be unitary.
3
Variational EM estimation
In a first attempt to estimate the ASL JDE model, an intensive sampling MCMC procedure has been used in a Bayesian setting [10]. This provides an elegant way to estimate the missing model variables a P A, h P H, c P C, g P G, q P Q via the sampling of the posterior distribution ppa, h, c, g, q|yq whose direct compu-tation or maximization is intractable. When the model involves a lot of missing variables, such an approach is not easy to monitor and not that flexible. Ad-ditional information or constraints on the response function shapes (i.e., unit L2-norm) cannot be easily integrated. Following the lead of [8], we propose an
alternative Expectation-Maximization (EM) framework. Let D be the set of all probability distributions on A ˆ H ˆ C ˆ G ˆ Q. EM can be viewed as an alternat-ing maximization procedure of a function F such that for any ˜p P D, F p˜p, θq “ Ep˜“log ppy, a, h, c, g, q ; θq‰ ` Ir˜ps where Ir˜ps “ ´Ep˜“log ˜ppa, h, c, g, qq‰ is the
entropy of ˜p, Ep˜“‰ denotes the expectation with respect to ˜p and θ is the set of
parameters. Maximizing function F is equivalent to minimizing the Kullback-Leibler divergence between ˜p and the true posterior of interest ppa, h, c, g, q|yq. This view of EM has led to a number of variants in which the E-step is solved over a restricted class of probability distributions, ˜D. The variational approach corre-sponds to choosing ˜D as the set of distributions that factorize over the set of miss-ing variables: ˜ppa, h, c, g, qq “ ˜papaq ˜phphq ˜pcpcq ˜pgpgq ˜pqpqq where ˜pa P DA,
˜
phP DH, ˜pc P DC, ˜pgP DGand ˜pqP DQ, the sets of probability distributions on
A, H, C, G, Q respectively. The E-step becomes an approximate E-step that can be further decomposed into five stages updating the different variables in turn. At iteration prq, with current estimates denoted byp˜pr´1qa , ˜ppr´1qh , ˜ppr´1qc , ˜ppr´1qg , ˜ppr´1qq
and θpr´1q, where θ “ α, `, σ2, µa,c, σa,c, vh, vg, β(, the updating formulae are
of the form:
E-H-step: ˜pprqh “ arg max
˜ phPDH F p˜ppr´1q a p˜hp˜pr´1qc p˜pr´1qg p˜pr´1qq ; θ pr´1q q (2) E-G-step: ˜pprqg “ arg max
˜ pgPDG F p˜ppr´1qa p˜ prq h p˜ pr´1q c p˜gp˜pr´1qq ; θpr´1qq (3)
with similar expressions for the other steps obtained by permuting the roles of the variables. Hereafter, for the ease of presentation, the prq and pr ´ 1q superscripts are omitted. In contrast to the standard setting, to introduce normalisation constraints on h and g, we modify the sought variational approximation into ˜
4 A. Frau-Pascual, F. Forbes, P. Ciuciu
functions. This reduces the search to pointwise estimates ˜h and ˜g. The E-H and E-G steps in Eqs. (2)-(3) then yield maximization problems which are easily constrained to account for normalisation:
E-H: ˜h “ arg max
h Ep˜ap˜cp˜q“log pph | y, a, c, ˜g, q; θq‰ (4)
E-G: ˜g “ arg max
g Ep˜ap˜cp˜q“log ppg | y, a, ˜h, c, q; θq‰ (5)
Solving Eqs. (4)-(5) amounts to minimizing a quadratic function under a quadratic constraint, namely }h}2
2 “ 1 and }g}22 “ 1 respectively. The other E-steps can
be derived from standard expressions in [8] replacing expectations over h and g by ˜h and ˜g, e.g. E-Q: ˜pqpqq9 exp ´ Ep˜ap˜c“log ppq | y, a, ˜h, c, ˜g; θq‰ ¯ , (6)
with similar expressions for the E-A and E-C steps. The corresponding M-step for the update of θ can be divided into separate M-substeps, as in [8]:
θ “ arg max
θPΘ
“Ep˜ap˜c“log ppy | a, ˜h, c, ˜g; α, `, σ
2 q‰` Ep˜ap˜q“log ppa | q; µa, σaq ‰ ` log pp˜h; vhq ` Ep˜cp˜q“log ppc | q; µc, σcq ‰ ` log pp˜g; vgq ` Ep˜q“log ppq; βq‰‰ . It follows a VEM procedure in which missing quantities are updated in turn. Compare to an MCMC solution, the variational approach is based on an approx-imation of the full posterior distribution. The dependencies between te random variables in the JDE model are reduced to dependencies between their moments that appear in the successive E-steps. No theoretical results exist that would guarantee the quality of such an approximation but the performance compar-ison provided in the next section suggests that VEM is still able to capture enough information amongst the original dependencies.
4
Results
Different data sets have been analysed to assess the performance of the VEM and MCMC approaches: first, artificial data synthesized with the generative model (1), and second real data acquired on different individuals from the AINSI initiative (http://thalie.ujf-grenoble.fr/ainsi).
4.1 Artificial data
N “ 292 ASL artificial images (i.e., 146 control/tag pairs) have been simulated using a realistic SNR (» 3 dB) according to Eq. (1) considering h and g as depicted in Fig.1(a)-(b) by dashed lines. To emulate the slow sampling rate of ASL images, Eq. (1) was synthesized at ∆t “ 1 sec and then undersampled at T R “ 3 sec. Here, we considered a fast event-related paradigm comprising two conditions (M “ 2). Drift coefficients and noise realizations were drawn
according to `j „ N p0, 10IOq and bj „ N p0, 2INq, respectively. HRLs were
generated with pamj |q m
j “ 1q „ N p2.2, 0.3q for active voxels and pa m j |q
m j “ 0q „
N p0, 0.3q for inactive ones. To make this synthetic setting realistic, PRLs were generated with a lower contrast than HRLs: pcmj |q
m
j “ 1q „ N p1.6, 0.3q and
pcmj |qmj “ 0q „ N p0, 0.3q. Activation states (assignment variables q) are set by a hand-drawn map, as illustrated on the first column maps of Fig. 2.
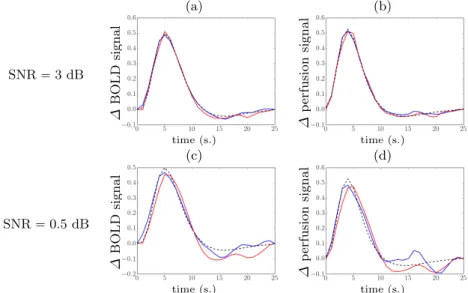
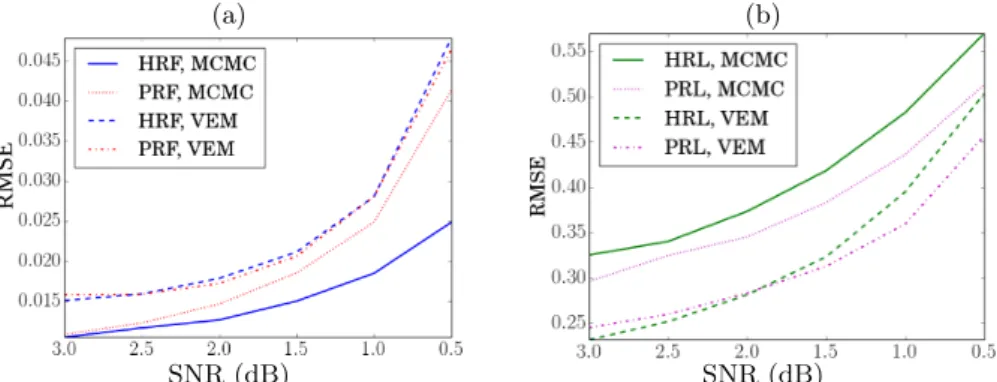
Fig. 1(a-d) shows the HRF and PRF estimates obtained for two different noise levels. Both response functions were well recovered with MCMC and VEM at 3 dB SNR with an acceptable degradation at lower SNR (i.e. 0.5 dB). In the latter case, MCMC recovers slightly better the peak. The labels (activated/non-activated) in Fig. 2 are well recovered with both MCMC and VEM at the higher SNR. At the lower one, both solutions fail to recover accurate label maps. As typical of VEM, labels maps are more contrasted than with MCMC which is likely to better estimate variability. Fig. 3 shows the root mean squared errors (RMSE) for a range of SNR levels. Response functions are well recovered with small RMSE in all cases (Fig. 3(a)) but with better estimations with MCMC. In contrast, response levels are better recovered with VEM (Fig. 3(b)). This is consistent with previous comparisons between VEM and MCMC on BOLD signals [8].
(a) (b) SNR “ 3 dB ∆ BOLD sign al ∆ p e rfusio n signal time (s.) time (s.) (c) (d) SNR “ 0.5 dB ∆ BOLD sign al ∆ p e rfusio n signal time (s.) time (s.)
Fig. 1. Artificial data with 2 noise settings: (a, b) SNR “ 3 dB, (c, d) SNR “ 0.5 dB. Ground-truth response curves (black dashed lines) and estimated hemodynamic (a, c) and perfusion (b, d) response functions with MCMC in blue and VEM in red.
4.2 Real data
Real ASL data were recorded during an experiment designed to map auditory and visual brain functions, which consisted of N “ 291 scans lasting TR “ 3000 ms, with TE “ 18 ms, FoV 192 mm, each yielding a 3-D volume composed of 64 ˆ 64 ˆ 22 voxels (spatial resolution of 3 ˆ 3 ˆ 7 mm3). The tagging scheme
6 A. Frau-Pascual, F. Forbes, P. Ciuciu
Ground MCMC VEM MCMC VEM truth SNR “ 3 dB SNR “ 3 dB SNR “ 0.5 dB SNR “ 0.5 dB
A
V
Fig. 2. Results on artificial data for labels q. The probability to be activated is shown for each voxel, for 2 experimental conditions, namely auditory (A) and visual (V) stim-uli. The ground truth as well as the MCMC and VEM activation probability estimates are shown in two different SNR scenarios.
(a) (b)
SNR (dB) SNR (dB)
Fig. 3. RMSE comparison between MCMC and VEM approaches. (a) Response func-tions HRF and PRF. (b) Mean over condifunc-tions of the RMSE of the response levels HRL and PRL.
used was PICORE Q2T, with pTI1, TI2q “ p700, 1700q ms. A fast event-related
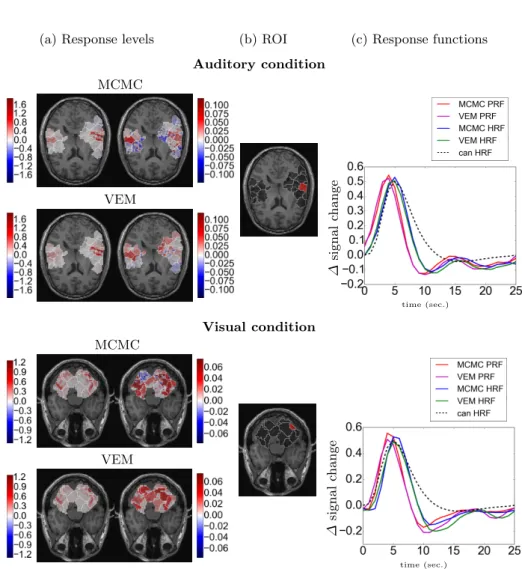
paradigm comprising sixty auditory and visual stimuli, randomly distributed according to a mean inter-stimulus interval of 5.1 sec, was run during acquisition. In Fig. 4, the MCMC and VEM results are shown in the left and right vi-sual and auditory cortices. The HRL maps in Fig. 4(a) are very similar for the two approaches and for A and V conditions in contrast to the larger variability reported in the PRL maps owing to the lower effect size. Interestingly, the PRL maps yielded by the two algorithms are consistent for the V condition in con-trast to what we observed for the A condition. The regions of interest (ROI) in Fig. 4(b) correspond to the parcels with stronger mean HRL and PRL values for each condition respectively. The HRF and PRF estimates in these ROIs have plausible shapes and both approaches recover similar profiles. For both condi-tions, the PRF peaks before the HRF, as enforced by the physiological prior.
Regarding computational times, a substantial decrease was observed for VEM as compared to the MCMC solution, which is consistent with previous reports [8].
5
Conclusion
A VEM algorithm has been proposed to address the issue of jointly detect-ing evoked activity and estimatdetect-ing the associated hemodynamic and perfusion responses from functional ASL data. Compared to MCMC, VEM delivers es-timations in analytic form for each latent variable. Although the VEM setting remains an approximation, it facilitates the inclusion of additional information such as constraints. Our results demonstrate a good performance of VEM when compared to MCMC at a significantly lower computation time. This suggests VEM as a fast and valid alternative for functional ASL data analysis.
References
1. D. Williams, J. Detre, J. Leigh, and A. Koretsky, “Magnetic resonance imaging of perfusion using spin inversion of arterial water,” Proceedings of the National Academy of Sciences, vol. 89, no. 1, pp. 212–216, 1992.
2. S. Ogawa, D.W. Tank, R. Menon, J.M. Ellermann, S-G. Kim, H. Merkle, and K. Ugurbil, “Intrinsic signal changes accompanying sensory stimulation: functional brain mapping with magnetic resonance imaging,” Proceedings of the National Academy of Sciences, vol. 89, pp. 5951–5955, 1992.
3. L. Hernandez-Garcia, H. Jahanian, and D. B. Rowe, “Quantitative analysis of arterial spin labeling fMRI data using a general linear model,” Magnetic resonance imaging, vol. 28, no. 7, pp. 919–927, 2010.
4. J. A. Mumford, L. Hernandez-Garcia, G. R. Lee, and T. E. Nichols, “Estimation efficiency and statistical power in arterial spin labeling fMRI,” Neuroimage, vol. 33, no. 1, pp. 103–114, 2006.
5. D. A. Handwerker, J. M. Ollinger, and D. Mark, “Variation of BOLD hemodynamic responses across subjects and brain regions and their effects on statistical analyses,” Neuroimage, vol. 21, pp. 1639–1651, 2004.
6. S. Badillo, T. Vincent, and P. Ciuciu, “Group-level impacts of within- and between-subject hemodynamic variability in fMRI,” Neuroimage, vol. 82, pp. 433–448, 15 Nov. 2013.
7. T. Vincent, L. Risser, and P. Ciuciu, “Spatially adaptive mixture modeling for analysis of within-subject fMRI time series,” IEEE Trans. on Medical Imaging, vol. 29, no. 4, pp. 1059–1074, Apr. 2010.
8. L. Chaari, T. Vincent, F. Forbes, M. Dojat, and P. Ciuciu, “Fast joint detection-estimation of evoked brain activity in event-related fMRI using a variational ap-proach,” IEEE Trans. on Medical Imaging, vol. 32, no. 5, pp. 821–837, May 2013. 9. T. Vincent, J. Warnking, M. Villien, A. Krainik, P. Ciuciu, and F. Forbes, “Bayesian Joint Detection-Estimation of cerebral vasoreactivity from ASL fMRI data,” in 16th Proc. MICCAI, Nagoya, Japan, Sept. 2013, vol. 2, pp. 616–623. 10. A. Frau-Pascual, T. Vincent, J. Sloboda, P. Ciuciu, and F. Forbes, “Physiologically
informed Bayesian analysis of ASL fMRI data,” in Bayesian and grAphical Models for Biomedical Imaging, pp. 37–48. Springer, 2014.
11. T. Vincent, F. Forbes, and P. Ciuciu, “Bayesian BOLD and perfusion source separation and deconvolution from functional ASL imaging,” in 38th Proc. IEEE ICASSP, Vancouver, Canada, May 2013, pp. 1003–1007.
8 A. Frau-Pascual, F. Forbes, P. Ciuciu
(a) Response levels (b) ROI (c) Response functions Auditory condition MCMC VEM ∆ signal change time (sec.) Visual condition MCMC VEM ∆ signal change time (sec.)
Fig. 4. Results on real fASL data for a single subject of the AINSI database for both conditions: Auditory (top) and Visual (bottom). (a) HRL on the left and PRL on the right; (b) region of interest (ROI) where the response functions in (c) are estimated. In (c) and as indicated in the legend, the red and blue curves represent the PRF and HRF respectively for the MCMC approach, and the magenta and green curves represent the PRF and HRF respectively for the VEM approach. As a reference, we depicted the canonical HRF with a black dashed line.