Publisher’s version / Version de l'éditeur:
Vous avez des questions? Nous pouvons vous aider. Pour communiquer directement avec un auteur, consultez la première page de la revue dans laquelle son article a été publié afin de trouver ses coordonnées. Si vous n’arrivez pas à les repérer, communiquez avec nous à [email protected].
Questions? Contact the NRC Publications Archive team at
[email protected]. If you wish to email the authors directly, please see the first page of the publication for their contact information.
https://publications-cnrc.canada.ca/fra/droits
L’accès à ce site Web et l’utilisation de son contenu sont assujettis aux conditions présentées dans le site LISEZ CES CONDITIONS ATTENTIVEMENT AVANT D’UTILISER CE SITE WEB.
Biomacromolecules, 6, 6, pp. 3404-3409, 2005-11-01
READ THESE TERMS AND CONDITIONS CAREFULLY BEFORE USING THIS WEBSITE. https://nrc-publications.canada.ca/eng/copyright
NRC Publications Archive Record / Notice des Archives des publications du CNRC :
https://nrc-publications.canada.ca/eng/view/object/?id=8c8f8f8f-90e1-4e44-aa55-2659dc9c3e79 https://publications-cnrc.canada.ca/fra/voir/objet/?id=8c8f8f8f-90e1-4e44-aa55-2659dc9c3e79
NRC Publications Archive
Archives des publications du CNRC
This publication could be one of several versions: author’s original, accepted manuscript or the publisher’s version. / La version de cette publication peut être l’une des suivantes : la version prépublication de l’auteur, la version acceptée du manuscrit ou la version de l’éditeur.
For the publisher’s version, please access the DOI link below./ Pour consulter la version de l’éditeur, utilisez le lien DOI ci-dessous.
https://doi.org/10.1021/bm050460q
Access and use of this website and the material on it are subject to the Terms and Conditions set forth at
Enzymatic surface erosion of poly(trimethylene carbonate) films
studied by atomic force microscopy
Enzymatic Surface Erosion of Poly(trimethylene carbonate)
Films Studied by Atomic Force Microscopy
Zheng Zhang,†Shan Zou,‡G. Julius Vancso,‡Dirk W. Grijpma,†and Jan Feijen*,† Institute for Biomedical Technology (BMTI) and Department of Polymer Chemistry and Biomaterials, Faculty of Science and Technology, University of Twente, and Materials Science and Technology of
Polymers, MESA+
Institute for Nanotechnology, University of Twente, P.O. Box 217, 7500 AE Enschede, The Netherlands
Received July 1, 2005; Revised Manuscript Received September 30, 2005
In this article, the surface erosion of spin-coated poly(trimethylene carbonate) (PTMC) films by lipase solutions from Thermomyces lanuginosus was studied using atomic force microscopy (AFM). PTMC films (23-48 nm thick) were stable in water at 37°C for 16 h, while after immersion in lipase solutions at 37°C for 30 s and 1 min, the average thickness of the film decreased in time at a rate of 11.0 ( 3.7 nm/min. The initially smooth films became significantly rougher during the erosion process. When the immersion time of the films in the lipase solutions was limited to less than 5 s, degradation of the surface was minimal and individual lipase molecules adsorbed on PTMC films could be discerned. By microcontact printing of the PTMC surfaces using a patterned PDMS stamp and lipase solution for 30 s, a predefined micropattern consisting of parallel, 5-µm-wide lines lying 5-nm deep and separated at a distance of 2 µm was formed. Friction images showed differences in surface properties between the recessed and protruding lines in the pattern.
Introduction
Biodegradable polymers are widely used as medical implants and in drug delivery and tissue engineering ap-plications. Most of the polymers used in these applications degrade by a bulk degradation and erosion process. Only few polymers show surface-eroding characteristics; examples are polyanhydrides,1poly(adipic anhydride),2poly(ethylene
carbonate),3 and poly(ortho esters).4 We found that, upon
implantation, high molecular weight poly(trimethylene car-bonate) (PTMC) degraded readily by surface erosion.5,6
When PTMC was incubated in lipase solutions (from Thermomyces lanuginosus) this behavior could also be observed.6 It should be noted that in the absence of this
enzyme at pH values ranging from 1 to 13 no degradation occurred at all.
The surface erosion behavior of biodegradable polymers has been studied using atomic force microscopy (AFM). Shakesheff et al. initially used AFM to investigate the hydrolytic surface erosion of poly(sebacic anhydride) films in water and in alkaline solutions (pH ) 9-12.5),7,8and of
poly(ortho ester) films in water and in a diluted HCl solution (pH ) 6).9Doi et al. reported AFM studies on the enzymatic
degradation of 100-nm-thick films of poly(ethylene succi-nate)10and of poly[(R)-3-hydroxybutyrate] (PHB) films11,12
by various PHB depolymerases. Recently, AFM was also
employed to study the enzymatic degradation of amorphous, 100-nm-thick poly(L-lactide) (PLLA) films by proteinase K.13
Furthermore, AFM enables the visualization of single enzyme molecules at the nanometer scale.14 The adsorption of
individual PHB depolymerase molecules15and proteinase K13
on the surface of PLLA films was reported as well. In recent years, lipases (EC 3.1.1.3) have become an important class of enzymes for a variety of applications in biotechnology.16,17In biomedical applications, lipases
cata-lyze the synthesis as well as the hydrolysis of polyesters and poly(ester-co-carbonates).18The hydrolysis activity of lipase
results from the catalytic triad Ser-His-Asp/Glu, which is buried under a short helical segment, termed the lid.19,20
When adsorbed on hydrophobic supports,21,22the
conforma-tion of the lipase molecule is open and the structure is hyperactive. The adsorption of lipase molecules on phos-pholipid self-assembled monolayers has been studied by AFM.23
Studies on the adsorption of individual lipase molecules on the surface of a biodegradable polymer film and its subsequent enzymatic degradation have not yet been re-ported. In this article, we report on an AFM study of the enzymatic surface erosion of spin-coated PTMC films by lipase solutions. Changes in morphology of the films upon degradation were illustrated, and rates of erosion were determined. To illustrate a potential biomedical use of this rapid enzymatic surface erosion, microcontact printing (µCP)24,25of a PTMC surface using a patterned PDMS stamp
and lipase solutions was performed and the PTMC surface after µCP was characterized by AFM as well.
* To whom correspondence should be addressed. Tel: +31 (0)53 4892968. Fax: +31 (0)53 4893823. E-mail: [email protected].
†Institute for Biomedical Technology (BMTI) and Department of
Polymer Chemistry and Biomaterials.
‡Materials Science and Technology of Polymers, MESA+Institute for
Nanotechnology.
10.1021/bm050460q CCC: $30.25 © 2005 American Chemical Society Published on Web 10/20/2005
Experimental Section
Materials.Polymer-grade 1,3-trimethylene carbonate (TMC) was purchased from Boehringer Ingelheim (Germany). Stannous octoate (SnOct2) and lipase from Thermomyces
lanuginosus (EC3.1.1.3, minimum 50 000 units/g) were purchased from Sigma (U.S.A.) and used as received. Sodium dodecyl sulfate-polyacrylamide gel electrophoresis (SDS-PAGE) of the lipase solution showed a single protein band at a molecular weight of 39.3 kD. The water used in this study was deionized using a Milli-Q water purification system (Millipore, France). High molecular weight poly-(trimethylene carbonate) PTMC (Mn )291 × 103g/mol,
Mw/Mn)1.46) was synthesized, purified, and characterized
as previously described.26PTMC is an amorphous polymer
with a low glass transition temperature of approximately -20
°C.
Thin PTMC films with thicknesses between 23 and 48 nm were prepared by spin-coating dilute chloroform solutions (3 mg/mL) on cleaned Si wafers at 3000 rpm. To determine the film thickness, cuts through the films that exposed the surface of the Si wafer were made by scratching with a needle. From atomic force microscopy (AFM) height profiles obtained in tenfold from each of the height images of three different places (see below), the thickness of the film could be determined by measuring the difference in height between the polymer film and the Si wafer substrate.
Poly(dimethylsiloxane) (PDMS) stamps were prepared from a Sylgard 184 silicone elastomer kit (Dow Corning, Germany) according to the manufacturer’s specifications. The mixture of prepolymer and curing agent was degassed and poured onto a patterned Si master and cured at 120 °C overnight. After curing, PDMS stamps with parallel channels 1 µm deep and 2 µm wide were obtained; the separation between the channels was 5 µm.
Enzymatic Degradation of PTMC. PTMC films on Si wafers were immersed in lipase solutions at 37°C for 30 s, 1 min, and 2 min, respectively. Upon removal from the enzyme solutions, the films were extensively rinsed with water and blown dry with a gentle N2 flow. The effect of
the enzymatic degradation on the surface morphology of the films was investigated by AFM. When the immersion time in the enzyme solution (at room temperature) was decreased to less than 5 s, enzyme degradation was limited and individual molecules could be clearly observed on the surface of the polymer film.
Patterned structures in the PTMC films were obtained by microcontact printing (µCP) using the PDMS stamps. The stamps were impregnated with the lipase solution, and then, the excess liquid was removed with a N2flow. The PDMS
stamp was carefully pressed onto the PTMC film for 30 s at ambient conditions; subsequently, the PTMC film was extensively rinsed with water and blown dry.
Control experiments using only water were carried out as well.
Atomic Force Microscopy (AFM).The surface morphol-ogy (height and phase images) and the thickness of the films were investigated by tapping-mode AFM in air using a NanoScope IIIa instrument (Digital Instruments, U.S.A.).
Silicon cantilevers/tips with a spring constant of 28-58 N/m were used (Nanosensors, Germany). The amplitude of oscillation at free vibration (A0) was set between 2.5 and
3.0 V. The operating set point ratio (A/A0), which is inversely
proportional to the damping of the cantilever, was set to relatively high values (0.75-0.85). These measurements were performed before and after treatment of the films with the lipase solution. In the latter case, the films were first extensively rinsed with water and dried.
Contact-mode AFM in lipase solution was used to investigate the enzymatic degradation of the thin PTMC films in real time. For this, a NanoScope IV instrument (Veeco Instruments, U.S.A.) was employed. As the surface erosion process in the lipase solution is quite fast, it is necessary to carry out the experiments rapidly. To do this, the cantilever tip was first brought close to the surface of the film, then several drops of lipase solution were added, and the tip was let to engage the wetted polymer film surface. This last step took approximately 80 s, scanning of an area of 10 × 10 µm2, then took ca. 260 s (256 lines, 1 Hz). The contact-mode AFM scans were carried out with a load of 3 nN using V-shaped Si3N4cantilevers with a spring constant of 0.1 N/m
(Nanoprobes, Veeco Instruments).
Contact-mode AFM in air was also employed to obtain height and friction images of the surface of the PTMC film after µCP. For this experiment, a NanoScope IIIa instrument (Digital Instruments, U.S.A.) was used.
Results and Discussion
Enzymatic Degradation of PTMC Films.Recently we reported the rapid enzymatic surface erosion of high mo-lecular weight PTMC using lipase solutions from Thermo-myces lanuginosus.6 During degradation of 750-µm-thick
compression-molded PTMC disks, the mass and thickness simultaneously decreased linearly in time. The erosion rate was 6.7 µm/d.
To investigate the enzymatic surface erosion process on a nanometer scale, AFM is the most suited technique, as it allows direct visualization of surface features at this level of detail. Furthermore, the technique allows determination of other characteristics of the surfaces such as rigidity and friction properties. In this study, we employed various AFM techniques to investigate the enzymatic surface erosion behavior of spin-coated high molecular weight PTMC films with thicknesses of 23-48 nm.
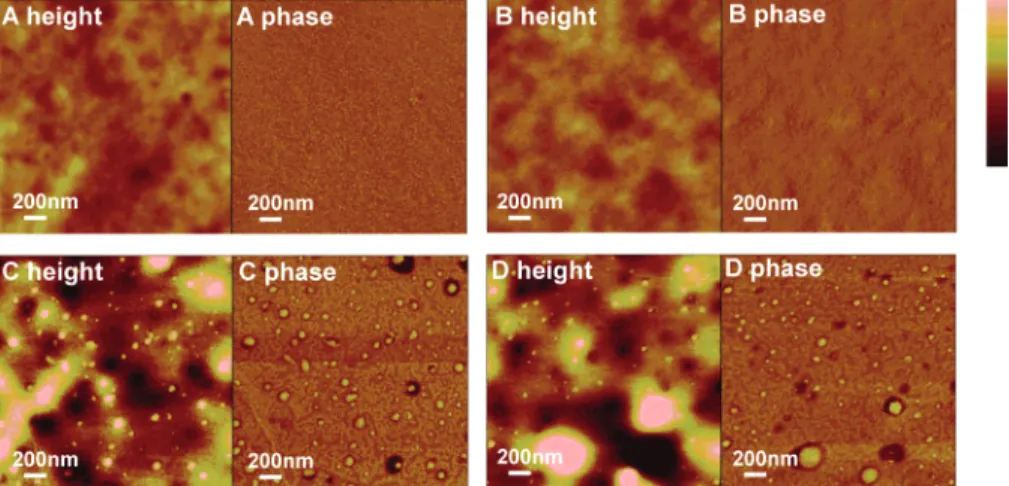
The morphology of the film surfaces before and after immersion in the enzyme solution (or in water) at 37 °C was studied by tapping-mode AFM in air. Tapping-mode AFM allows us to simultaneously obtain height and phase images of the surface, as Figure 1 shows. Initially, the surface of the spin-coated PTMC film was very smooth, as can be seen in Figure 1A. From the height image, a mean roughness (Ra) of only 0.7 nm was determined. The phase image shows
a homogeneous polymer phase, as can be expected for an amorphous PTMC homopolymer. Treatment of the polymer film with water at 37°C for 16 h did not significantly change the morphology (Figure 1B); the film remained very smooth (Ra ) 0.6 nm, averaged over the scanned area) and
homogeneous. PTMC films are very stable in water.
After conditioning the PTMC film in the lipase solution at 37°C for only 1 min, the surface of the film had become significantly rougher (Figure 1C, average Ra)2.5 nm). The
height image shows the presence of pits and particles, with depths and heights of, respectively, 5-10 nm and 1-20 nm; their diameters were 20-160 nm. In Figure 1C, the phase image which corresponds to the height image shows that regions that are pits in the height image have a phase equal to that of the surrounding background. The regions that are particles in the height image have a phase that differs from the background. This follows from the color scale ac-companying the figure.
Treating the PTMC film for 2 min with the lipase solution resulted in a further increased roughness of the film surface (Figure 1D, average Ra ) 3.1 nm). Now, the sizes of the
pits and particles had further increased, and features with diameters of 450 nm were distinguished. The raw data shows that the maximal depth and height of the pits and particles were, respectively, ca. 30 and 40 nm. In the corresponding phase image, the phase of the pits can be distinguished from that of the surrounding background: this suggests that at these places the polymer film had been eroded completely so that the surface of the Si wafer was exposed.
Clearly, immersion of PTMC in the lipase solution leads to greatly increased surface roughness. In water, the surface does not change significantly; therefore, this roughening is due to an enzymatic degradation process of the polymer. We have shown that the chain scission of PTMC upon enzymatic degradation is random along the polymer chain and that the degradation products are TMC monomer, 1,3-propanediol, and oligomeric PTMC.6 TMC, 1,3-propanediol, and an
oligomeric fraction with an average degree of polymerization of 2.6 were found to be soluble in water. Oligomers with higher degrees of polymerization were not soluble in water.6
Upon enzymatic degradation of the spin-coated PTMC films, the water-soluble degradation products go into solution, forming the pits on the film surface. The higher molecular weight, insoluble oligomeric degradation products have low viscosities and could aggregate on the film surface and form the observed big particles. Nevertheless, it cannot be excluded that enzyme molecules may aggregate by them-selves or with PTMC oligomers as well.
Although in time the roughness of the film surface increases upon enzymatic degradation, the average thickness of the spin-coated PTMC film decreases in time. The film thickness is determined from the height profiles across a scratch in the film, which exposes the Si surface. Typical height profiles across a scratch before and after immersing the film in the lipase solution for 1 min are shown in Figure 2A. Figure 2B shows the decrease in thickness of the films during the enzymatic degradation in the lipase solution within 1 min. From these determinations, an average erosion rate of 11.0 ( 3.7 nm/min was determined. This value is in the same range as we previously reported for compression-Figure 1. Tapping-mode AFM height and phase images of PTMC films spin-coated on Si wafers before treatment (A); conditioned in water at 37°C for 16 h (B); conditioned in lipase solution at 37°C for 1 min (C); and conditioned in lipase solution at 37°C for 2 min (D). The full color scale represents 15 nm in height and 30°in phase, respectively.
Figure 2. (A) Tapping-mode AFM height profiles across the edge of a scratch in a PTMC film before and after immersion in the lipase solution at 37°C for 1 min. (B) Decrease in thickness of PTMC films immersed in the lipase solution at 37°C (n)30; (sd).
molded PTMC disks (750-µm thick) degraded by the same lipase solution (6.7 µm/d ) 4.7 nm/min).6
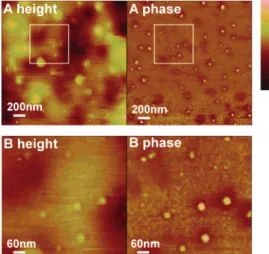
Lipase Molecules Adsorbed on PTMC Films.When the immersion time in the enzyme solution (at room temperature) and the subsequent rinsing with water was only a few seconds, enzymatic degradation of the polymer surface was limited, and in principle, we could observe individual molecules on the surface of the polymer film. Figure 3A shows the tapping-mode AFM height and phase images of the PTMC film after immersion in the enzyme solution for less than 5 s. In comparison to the untreated films described previously, the average roughness of the scanned surface increased slightly to a value of Ra )1.6 nm. In the height
image and at the same positions of the corresponding phase image, very small particles can be discerned. From the phase image, it can be deduced that the modulus values of these particles differ significantly from that of the background PTMC film, suggesting that these particles are not PTMC. Figure 3B shows expanded (600 × 600 nm2) AFM height
and phase images obtained from a new scan of the selected area as shown in Figure 3A.
A typical height profile across an individual particle is shown in Figure 4. From such profiles, the apparent radius of a particle (rAFM) and its relative height (h) can be
determined. The profiles of 200 particles were analyzed, giving rAFMand h values ranging from 7.8 to 21.5 nm and
1.0 to 4.0 nm, respectively. Average rAFMand h values were
rAFM)15.3 ( 2.9 nm and h ) 2.3 ( 0.7 nm.
The smallest particles observed on the film surface have dimensions of rAFM)7.8 nm and h ) 1.0 nm; these approach
the sizes of single macromolecules. For native lipase molecules in aqueous solutions, a radius of approximately 3.5 nm was reported.23,27
The apparent radii of small particles on the surface as determined by AFM are larger than their true radii because of the relatively large size of the AFM tip, and corrections need to be applied.28-30For flattened particles on a surface,
the true radius (r) of the particle can be calculated from the apparent radius (rAFM) and the relative height of the particle
(h) determined by AFM, and the radius of curvature of the AFM tip (Rtip), using the following equation:30
In our case, we observed particle dimensions of rAFM)15.3
(2.9 nm and h ) 2.3 ( 0.7 nm, while Rtipof the cantilevers was 17.5 ( 7.5 nm. After correction, the true radius (r) of the particles ranges from 4.7 to 20.9 nm with an average value of 12.4 ( 6.0 nm. If a radius of 3.5 nm is assumed for a spherical lipase molecule in solution, its volume can be calculated to be 180 nm3. For a single, disc-shaped lipase
molecule, which has been flattened by adsorption on the surface and has a height of 2.3 nm, a radius of 6.1 nm can be calculated by assuming its volume has not changed. This value corresponds very well with the true size of the smallest particles on the film surface; from this and from the difference in phase with the PTMC background (Figure 3), it is suggested that these small particles could be lipase molecules. The average radius of the particles we measured by AFM was slightly larger (12.4 nm). This could be caused by differences in the Rtip of the cantilevers employed and,
as lipase can be obtained from different sources, by differ-ences in size of the lipase molecules themselves when comparing with literature values. Also, the larger radius of the enzyme molecule as determined by AFM could be due to compression of the lipase by the AFM tapping force. Such deviations in size have previously been reported in other systems by Doi et al..13,15
It is interesting to compare the adsorption behavior of the individual lipase molecules on PTMC films with that of PHB depolymerase and proteinase K on PLLA films as investi-gated previously.13,15In all cases, the enzymes could not be
washed off the surface with water. Upon adsorption, these enzymes deformed and flattened significantly on the polymer surfaces. These results suggest strong interactions between the enzymes and the polymers.
Enzymatic Surface Erosion of PTMC in Real Time.
The enzymatic surface erosion behavior was investigated in real time by performing contact-mode AFM of a PTMC film onto which a small amount of lipase solution was dropped. Contact-mode AFM was employed, as it allows a good resolution to be obtained when scanning relatively rough samples with large variations in height.
Figure 3. Tapping-mode AFM height and phase images of a PTMC film after rapid immersion in the lipase solution (immersion time was less than 5 s) and rinsing with water (A); and those images from a new scan of the selected area (B). The full color scale represents 15 nm in height and 30°in phase, respectively.
Figure 4. A typical height profile across an individual particle as presented in Figure 3B.
r )
x
rAFM2-2Rtiph
Figure 5 shows the AFM height images of the surfaces during erosion of the film. After the lipase solution was dropped onto the film surface, it took approximately 80 s to engage the AFM tip onto the film surface and start the scanning. The AFM scan rate was 1 Hz; therefore, scanning of the images (256 lines) required another 260 s, during which the specimen was exposed to the lipase solution and subjected to degradation. Figure 5A therefore shows the surface of the PTMC film in real time as it was being degraded from 80 to 340 s. At approximately 90 s, the thickness of the film had decreased to 10-13 nm. At this time, perforations of the film became visible, exposing the underlying Si surface. At later time points, the size of the perforations increased and noticeable rims appeared.
From approximately 240 s onward, the size of the perforations had so greatly increased that the polymer film was not continuous anymore. Instead, high mounds of polymeric material (up to 120 nm in height) had been formed on the Si wafer. After the scan from 80 to 340 s was finished, the same area was immediately scanned for a second time in the opposite direction. The obtained height image is shown in Figure 5B. The figure shows that with increasing degrada-tion time the area corresponding to polymeric mounds decreased, while their height increased. The polymer was completely degraded after 600 s. (Please note that in the figure the full height scale represents 200 nm; this allows visualization of the large differences in height.)
These scans visualize the erosion of the surface of PTMC films in real time. The formation of rimmed holes suggests that during degradation dewetting of the PTMC film on the Si surface could also have occurred. This phenomenon does not occur when the film is immersed in water for 16 h (see Figure 1B).
Micropatterned Structures.PTMC is well-suited for the culture of cells, as we have shown previously.31,32
Micro-and nanopatterned PTMC surfaces have great potential in applications where the patterning of cells is desired, such as tissue engineering, biochips, and biosensors. We investigated the possibility of utilizing the rapid enzymatic surface erosion to form a micropatterned structure on PTMC films by the µCP technique using lipase solutions.
Patterned PDMS stamps, consisting of 2-µm-wide recessed lines spaced by 5-µm-wide protruding lines, were impreg-nated with the lipase solution. After removing the excess liquid, the patterned structure was carefully pressed onto the
PTMC film for 30 s; subsequently, the PTMC film was extensively rinsed with water and blown dry.
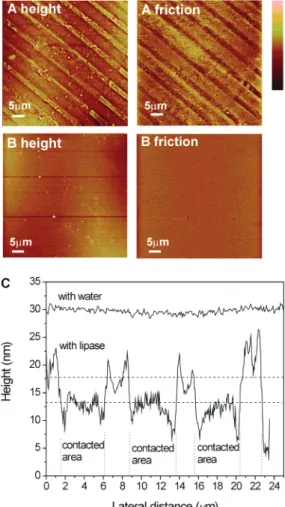
The resulting pattern on the surface of the PTMC films was probed using contact-mode AFM to obtain height and friction images (Figure 6A). From the height image, alternat-ing and parallel lines, which were approximately 2- and 5-µm wide, could be distinguished. The 5-µm-wide lines, which had been in contact with the lipase solution on the PDMS stamp, were lower in height. A typical height profile across the patterned surface of the film is shown in Figure 6C. The profile shows that the 5-µm-wide lines are approximately 5 nm lower than the 2-µm-wide lines. From the height profile in Figure 6C, it can also be seen that the middle parts of the protrusions are lower than the edges. This is probably caused by capillary forces between PTMC (which is in the melt at room temperature) and the cross-linked, patterned PDMS stamp. Similar height profiles were obtained during capillary force lithography of polystyrene films at 150 °C (Tg of
polystyrene is 101°C).33
Simultaneously, the AFM friction image after µCP was obtained. The pattern of the friction image corresponds very well with that of the height image (Figure 6A). Alternating lines with relatively high friction are approximately 5-µm wide and can readily be distinguished from relatively low friction lines 2 µm in width. The 5-µm-wide lines with higher friction correspond to the area that has been contacted with Figure 5. Contact-mode AFM height images of a PTMC film during
degradation in lipase solution at room temperature from 80 to 340 s (A) and from 340 to 600 s (B). The full color scale represents 200 nm in height. The arrows indicate the direction of the scan, and the given times correspond to degradation time points.
Figure 6. Contact-mode AFM height and friction images of PTMC films after µCP using lipase solution (A) and using water as control (B), and height profiles of the surfaces of PTMC films after µCP using lipase solution and using water (C). The full color scale represents 25 nm in the height images and 2 V in the friction images.
lipase solution; their higher friction is possibly due to higher hydrophilicity in these lines.34Control experiments showed
that, after µCP of the PTMC films with only water, a patterned surface was not obtained; the height and friction images (Figure 6B) and the height profile (Figure 6C) did not show any features.
These results demonstrate that, by µCP using lipase solution, a micropatterned PTMC surface with differences in height and in friction properties can be readily formed simultaneously. This is a novel strategy to form predefined micropatterned structures on a biocompatible and biodegrad-able polymeric surface.
Conclusions
The surface erosion of spin-coated PTMC films (23-48 nm thick) by lipase solutions was studied using AFM. After immersion in lipase solutions for 30 s to 2 min, the roughness of the films increased, and their average thickness decreased in time. The rate of the enzymatic surface erosion of the PTMC film within 1 min was 11.0 ( 3.7 nm/min, which is comparable to that of the much thicker, compression-molded disks. When the contact time of the films with the lipase solutions was limited to less than 5 s, degradation of the surface is minimal and individual lipase molecules adsorbed on PTMC films could be discerned.
The erosion of the surface of PTMC films was visualized in real time. During the process, rimmed holes were formed in the thin films. These holes exposed the underlying substrate and expanded in time. The film was completely eroded in 10 min.
Microcontact printing of a PTMC film surface using a PDMS stamp and lipase solution allowed the patterning of the film surface with predefined microstructures of varying heights and surface properties. Since PTMC is biocompatible, such micropatterned surfaces have a great potential for applications where cell patterning is required.
Acknowledgment. This study was financially supported by NWO, The Netherlands Organization for Scientific Research. We thank H. ten Hoopen for assistance in the AFM work.
Supporting Information Available. Histograms of radius and height values of 200 particles. This material is available free of charge via the Internet at http://pubs.acs.org.
References and Notes
(1) Tamada, J.; Langer, R. J. Biomater. Sci., Polym. Ed. 1992, 3, 315-353.
(2) Albertsson, A.-C.; Eklund, M. J. Appl. Polym. Sci. 1995, 57, 87-103.
(3) Dadsetan, M.; Christenson, E. M.; Unger, F.; Ausborn, M.; Kissel, T.; Hiltner, A.; Anderson, J. M. J. Controlled Release 2003, 93, 259-270.
(4) Heller, J. Biomaterials 1990, 11, 659-665.
(5) Peˆgo, A. P.; Van Luyn, M. J. A.; Brouwer, L. A.; Van Wachem, P. B.; Poot, A. A.; Grijpma, D. W.; Feijen, J. J. Biomed. Mater. Res.,
Part A 2003, 67A, 1044-1054.
(6) Zhang, Z.; Kuijer, R.; Bulstra S. K.; Grijpma, D. W.; Feijen, J.
Biomaterials, in press.
(7) Shakesheff, K. M.; Davies, M. C.; Roberts, C. J.; Tendler, S. J. B.; Shard, A. G.; Domb, A. Langmuir 1994, 10, 4417-4419. (8) Shakesheff, K. M.; Davies, M. C.; Domb, A.; Jackson, D. E.; Roberts,
C. J.; Tendler, S. J. B.; Williams, P. M. Macromolecules 1995, 28, 1108-1114.
(9) Shakesheff, K. M.; Davies, M. C.; Heller, J.; Roberts, C. J.; Tendler, S. J. B.; Williams, P. M. Langmuir 1995, 11, 2547-2553. (10) Gan, Z.; Abe, H.; Doi, Y. Biomacromolecules 2000, 1, 713-720. (11) Kikkawa, Y.; Murase, T.; Abe, H.; Iwata, T.; Inoue, Y.; Doi, Y.
Macromol. Biosci. 2002, 2, 189-194.
(12) Fujita, M.; Takikawa, Y.; Teramachi, S.; Aoyagi, Y.; Hiraishi, T.; Doi, Y. Biomacromolecules 2004, 5, 1787-1791.
(13) Yamashita, K.; Kikkawa, Y.; Kurokawa, K.; Doi, Y.
Biomacromol-ecules 2005, 6, 850-857.
(14) Radmacher, M.; Fritz, M.; Hansma, H. G.; Hansma, P. K. Science 1994, 265, 1577-1579.
(15) Kikkawa, Y.; Fujita, M.; Hiraishi, T.; Yoshimoto, M.; Doi, Y.
Biomacromolecules 2004, 5, 1642-1646.
(16) Jaeger, K.-E.; Reetz, M. T. Trends Biotechnol. 1998, 16, 396-403. (17) Theil, F. Chem. ReV. 1995, 95, 2203-2227.
(18) Kobayashi, S.; Uyama, H.; Kimura, S. Chem. ReV. 2001, 101, 3793-3818.
(19) Brady, L.; Brzozowski, A. M.; Derewenda, Z. S.; Dodson, E.; Dodson, G.; Tolley, S.; Turkenburg, J. P.; Chritiansen, L.; Huge-Jensen, B.; Norskov, L.; Thim, L.; Menge, U. Nature (London) 1990, 343, 767-770.
(20) Brzozowski, A. M.; Derewenda, U.; Derewenda, Z. S.; Dodson, G. G.; Lawson, D. M.; Turkenburg, J. P.; Bjorkling, F.; Huge-Jensen, B.; Patkar, S. A.; Thim, L. Nature (London) 1991, 351, 491-494. (21) Bastida, A.; Sabuquillo, P.; Armisen, P.; Ferna´ndez-Lafuente, R.; Huguet, J.; Guisa´n, J. M. Biotechnol. Bioeng. 1998, 58, 486-493. (22) Fernandez-Lafuente, R.; Armise´n, P.; Sabuquillo, P.;
Ferna´ndez-Lorente, G.; Guisa´n, J. M. Chem. Phys. Lipids 1998, 93, 185-197. (23) Yang, Z.; Yu, H. Langmuir 1999, 15, 1731-1737.
(24) Kumar, A.; Whitesides, G. M. Appl. Phys. Lett. 1993, 63, 2002-2004.
(25) Mrksich, M.; Whitesides, G. M. Trends Biotechnol. 1995, 13, 228-235.
(26) Zhang, Z.; Grijpma, D. W.; Feijen, J. Macromol. Chem. Phys. 2004,
205, 867-875.
(27) Noble, M. E. M.; Cleasby, A.; Johnson, L. N.; Egmond, M. R.; Frenken, L. G. J. FEBS Lett. 1993, 331, 123-128.
(28) Chicon, R.; Ortuno, M.; Abellan, J. Surf. Sci. 1987, 181, 107-111. (29) Markiewicz, P.; Goh, M. C. Langmuir 1994, 10, 5-7.
(30) Santos, N. C.; Ter-Ovanesyan, E.; Zasadzinski, J. A.; Prieto, M.; Castanho, M. A. R. B. Biophys. J. 1998, 75, 1869-1873. (31) Peˆgo, A. P.; Vleggeert-Lankamp, C. L. A. M.; Deenen, M.; Lakke,
E. A. J. F.; Grijpma, D. W.; Poot, A. A.; Marani, E.; Feijen, J. J.
Biomed. Mater. Res., Part A 2003, 67A, 876-885.
(32) Peˆgo, A. P.; Siebum, B.; Van Luyn, M. J. A.; Van Seijen, X. J. G. Y.; Poot, A. A.; Grijpma, D. W.; Feijen, J. Tissue Eng. 2003, 9, 981-994.
(33) Suh, K. Y.; Yoo, P. J.; Lee, H. H. Macromolecules 2002, 35, 4414-4418.
(34) Wang, R.; Hashimoto, K.; Fujishima, A.; Chikuni, M.; Kojima, E.; Kitamura, A.; Shimohigoshi, M.; Watanabe, T. Nature (London) 1997, 388, 431-432.
BM050460Q