HAL Id: hal-02348668
https://hal.archives-ouvertes.fr/hal-02348668
Submitted on 15 Nov 2019
HAL is a multi-disciplinary open access
archive for the deposit and dissemination of
sci-entific research documents, whether they are
pub-lished or not. The documents may come from
teaching and research institutions in France or
abroad, or from public or private research centers.
L’archive ouverte pluridisciplinaire HAL, est
destinée au dépôt et à la diffusion de documents
scientifiques de niveau recherche, publiés ou non,
émanant des établissements d’enseignement et de
recherche français ou étrangers, des laboratoires
publics ou privés.
Development of a photovoltaic driven thermodynamic
chiller. Application to solar air conditioning and cooling
storage
Philippe Esparcieux, Olivier Baup, Daniel Mugnier, Christophe Weber,
Christophe Marvillet
To cite this version:
Philippe Esparcieux, Olivier Baup, Daniel Mugnier, Christophe Weber, Christophe Marvillet.
De-velopment of a photovoltaic driven thermodynamic chiller. Application to solar air conditioning and
cooling storage. EuroSun, Sep 2018, Rapperswil, Switzerland. pp.1-12, �10.18086/eurosun2018.04.07�.
�hal-02348668�
Development of a photovoltaic driven thermodynamic chiller
Application to solar air conditioning and cooling storage
Philippe Esparcieux1, Olivier Baup1, Daniel Mugnier2, Christophe Weber3, Christophe Marvillet3,4
1
Atisys Concept, Toulon (France) 2
Tecsol, Perpignan (France) 3
NeoTherm Consulting, Le Bourget du Lac (France) 4
CNAM/IFFI, Paris (France)
Abstract
This paper presents a smart design named PV COOLING to produce solar cooling using low GWP heat pump system coupled with a standard photovoltaic plant. A maximum of self-consumption is promoted by means of a light bank of batteries and chilled water tank. For this, a test bench has been installed on the building roof in the south of France with the originality to be entirely controllable in terms of building load injected. Thereafter, this new system aims to be used for air-conditioning and/or dehumidification in the tertiary sector and positive cold storage in the industrial sector in countries where climatic, regulatory and technical conditions are suitable. PV COOLING potential is developed within a market study. The aim of this study is to assess the thermal / electrical performances of our test bench with the purpose to air-conditioning a building by means of several sensors and meters.
Keywords: solar cooling, air-conditioning, cold storage, food preservation photovoltaic, heat pump, self-consumption, batteries, thermal tank, glycol water, low GWP, R290,
1. Introduction
Until now, traditional PV economic model was based on feed-in tariff. However this trend is currently moving toward on-site self-consumption. PV self-consumption can be used in a straightforward manner for domestic purposes: lighting, heating, domestic hot water heating (DHW), cooking, domestic appliances, etc. An example of application consists in using solar power to directly drive a thermodynamic device with a target to produce cooling or refrigeration. It can be noted that PV production perfectly matches cooling needs during the day. Besides, in many countries all over the world, the summer comfort in buildings becomes necessary in order to allow employees to work in good condition.
The use of renewable energy for powering heat pumps can solve environmental problems due to the ways of producing energy (e.g. CO2 emissions by coal thermal plants in China). Even if the energy problem is settled, it remains the issue of refrigerant fluid leakage which represents a non-negligible share of the greenhouse effect. Therefore, the use of low global warming potential (GWP) fluid in thermodynamic system allows to reduce the device carbon footprint.
2. The adopted strategy
At first glance, compressor power shall be adapted with PV output power. This may work within a certain range until a minimum threshold where chiller compressor has to be stopped. When PV output power is back, the main issue is to be sure that power remains sufficiently stable and reliable to start compressor again and avoid short-cycle. Indeed, the problem of driving a chiller compressor with PV lies in the fact that it may happen that irradiation may be temporary obstructed by some peculiar clouds.
International Solar Energy Society EuroSun 2018 Conference Proceedings
© 2018. The Authors. Published by International Solar Energy Society Selection and/or peer review under responsibility of Scientific Committee doi:10.18086/eurosun2018.04.07 Available at http://proceedings.ises.org
Using variable-frequency drive can solve the problem of high inrush current during compressor run-up. For the intermittent energy problem, storage using batteries or other electricity supply can easily sort this problem out. It’s also possible to mix with thermal storage system which is a shorter-term storage mode. Both electricity and thermal storage allow to store a sufficient energy when the PV production exceeds and use it when the need becomes higher than the PV production.
To contribute to an environmentally friendly device, propane (R290) has been chosen as refrigerant for this project. This very low GWP refrigerant (GWP < 10) combined with an original configuration allows a significant reduction of refrigerant amount. To maximize the self-consumption, the inverter has to allow both electric powers issued from PV and batteries.
This research aims to study a test bench using PV cooling, installed on the building roof in the south of France. For a better understanding of the system behaviour, instead of cooling the building, cooling is distributed into a chilled water tank in which is fitted a power controlled heating resistor which simulated all sorts of building thermal load configurations.
3. Promoting solar photovoltaic on new market segments
3.1. Air-conditioning for the tertiary sector
To avoid an unfair competition with cheap traditional heat pump produced at ten millions samples yearly, PV cooling will be suitable for medium / high power in the tertiary sector and according to certain criteria. The criteria to lead the market study are classified into three main contextual families (climatic, economic and regulatory) and are summarized through a “bubble chart” (Fig. 1). These criteria are expressed inside the chart as:
- The cooling demand expressed in cooling degree days (CDD) on the x-axis. - The annual global horizontal irradiation (GHI) per square meter on the y-axis.
- The market size of mid-sized / large heat pump in the tertiary sector is expressed by the percentage of the worldwide unit demand through the surface size of the bubble.
- The electricity price in the tertiary sector as a driver of renewable investment is expressed by the colour of the country, with cheap costs in light and high costs in black.
- Finally, self-consumption policy and fiscal incentives which are positive for renewables (e.g. feed-in-tariffs, subsidies, solar obligations) are marked with (+); others with (-) and unclear situation with (?).
Figure 1 shows only the final result of an ambitious market study. Indeed, several countries have been removed from previous “bubble charts” because of following weaknesses. First of all, many countries in Europe have an insufficient radiation like Germany and even if the radiation is enough like in South Europe, the cooling needs are only present during summer. Among countries which gather good natural conditions (both radiation and cooling needs), the low electricity price doesn’t allow for photovoltaic to be profitable (e.g. Saudi Arabia).
Countries that appear qualitatively as the most mature to accommodate a short-term photovoltaic air-conditioning system according to Figure 1 are mainly countries with a tropical climate. Indeed, under this kind of climate, the cooling needs are constant during the full year. Electricity price appears as an important criterion which participates to have a return on investment the most quickly possible.
The market size is not an essential criterion because PV COOLING can find its place in a market niche where the tertiary sector is not developed like high-income countries (for instance, the air-conditioning for a cybercafe in Africa which doesn’t have access to a reliable electrical grid). Indeed, more and more African cities have the means to propose services moving towards European standard for a category of population which are increasingly financially secure.
The self-consumption policy and fiscal incentives are the last criterion which may help PV solutions to be more attractive especially the right to self-consume. But it is difficult to be entirely exhaustive in each country because the PV policy changes quickly. PV outlooks show that each government will pass laws to tend towards a smarter way to consume photovoltaic which is self-consumption model. Besides, a lot of PV self-consumption projects take place in countries where no PV policy exists particularly in Western Africa. That means PV policy is not a necessary criterion to have the right to self-consume.
Fig. 1: Graph illustrating the attractiveness of cooling markets for PV COOLING
3.2. Cold room for perishables foods in industrial sector
The industrial sector which matches quite well with the natural condition is agri-food industry and more specifically storage for perishable food items with positive cold storage or refrigerated warehouse. The perishable foodstuffs which require positive cold storage to maintain a longer lifetime are mostly fruits & vegetables and roots & tubers. Countries with tropical climate appear to be regions where food harvest are significant and represent a considerable share of GDP. The majority of countries with tropical climate are low or middle-income, so the food cold chain is not developed as high-income countries. This is why due to
economic and climate problems (hot and damp), tropical climate regions have a significant food losses share caused by a lack of cold storage (Gustavsson et al., 2011).
As the air-conditioning study market, the “bubble chart” underlines the fact that tropical countries appear to be the most attractive for PV COOLING usage for positive cold storage food.
We can notice all the same a slight difference, with the apparition of very low-income countries in Africa in the “bubble chart” owing to the fact that agriculture is the only source of revenue.
4. R&D carried out for a properly sized system
Actual PV COOLING innovation mainly consists of setting together in a clever way, components which actually are highly improved, but never have been set together in a single goal system: PV plant dedicated to driving a thermodynamic fluid chiller as shown in Figure 2.
This is the fruit of two years co-operation with four French companies, with several decades’ expertise in solar energy (Tecsol), heat exchangers technology & design (NeoTherm Consulting), designing special thermodynamic equipment (EED) and designing & implementing innovative systems (Atisys).
Besides, the R&D project has also an academic dimension in France with an expert in cold industry from the Conservatoire National des Arts & Métiers (CNAM-Paris).
4.1. Overall PV COOLING architecture
Fig. 2: Schematic architecture of PV-COOLING system
4.2. Layout description
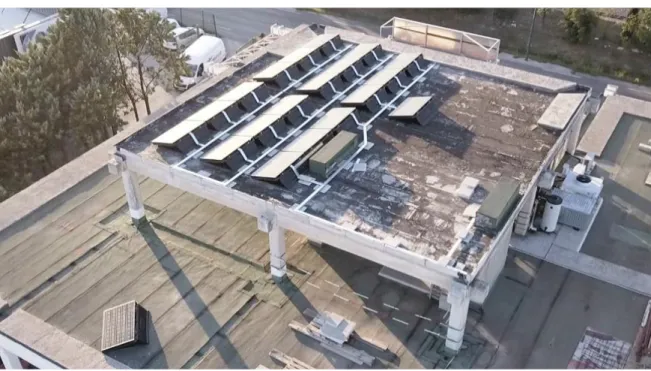
The first test bench, installed on the ATISYS head-office roof-top, is located in Toulon area (South East of France, lovely site in French Riviera).
Fig. 3: Global view of 18 mono-crystalline PV plant and chiller unit on ATISYS roof
Fig. 4: PV COOLING control and management system
In the pilot testing system, electrical production is delivered by 18 mono-crystalline photovoltaic modules (280 Watts peak (Wp) for each module) as illustrated on Figure 3, which represents a total power of 5.0 kWp. This power is quite enough for driving chiller compressors and all ancillary equipment dimensioned for 10 kWth chilling power (condenser fan and chilled water circulation pump).
These photovoltaic panels are connected to a three-phase wired inverter along with batteries bank. The four selected 12-Volt batteries are connected in series to obtain a voltage of 48V. Their 150Ah capacity each with a 50% depth of discharge (DOD) allows to obtain a useful electrical storage energy about 3.6kWh. This is enough to drive the full load power installation at least for one hour.
For a real operational system, battery capacity may be chosen according to actual need.
In order to limit the inrush current during compressor run-up, a variable-frequency drive has been installed downstream from the inverter which makes possible to divide the inrush current by 6.
Figure 4 presents the complete electrical setting.
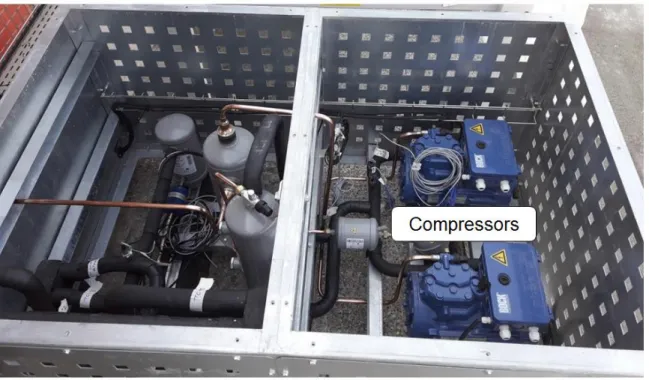
Two parallel-mounted semi-hermetic compressors were selected and adapted for propane. Each compressor can provide from 2.4 to 5.4 kW of cooling by varying its rotation frequency from 30 to 70 Hz. This allows a cooling capacity between 2.4 and 10.8 kW. For the future, commercial PV cooling systems will be able to reach high cooling power till 300 kW using bigger compressors. It is enough to size the other equipment accordingly.
Fig. 5: Picture of the Two parallel-mounted semi-hermetically compressors
The condenser is an air/R290 type heat exchanger, also called air-cooled condenser. In order to reduce refrigerant load, a microchannel type condenser has been chosen.
The evaporator selected for the project is brazed plate heat exchangers, also suitable for propane.
The major innovation regarding the heat pump system lies in the use of low Global Warming Potential (GWP) refrigerant.
The choice fell on propane (R290) with (<10) GWP, which is considerably low compared to a common refrigerant (e.g. 1300 GWP for R134a).
The only drawback with using propane is the necessity of additional security due to propane flammability. In our case and according with French safety regulation, setting the chiller outdoor (see Fig. 6) is considered as sufficient. Thus, no additional security is necessary.
The fluid that transports the refrigerating capacity from the cold unit to the chilled water tank is water/methyl propylene glycol (MPG) mixture, so as to avoid any freezing risk.
Fig. 6: Picture of the global chiller installation installed on the Atisys top roof
For this test bench, the chilled water tank is representative of a typical building whose thermal load is simulated with an electrical resistor heating the 180L chilled water tank (see heater on Fig. 6). That gives the advantage to fully control the building loads and consequently simulate several conditions which correspond to different building utilization/insulation and climate conditions.
A monitoring system has been set up with a view to monitoring performances of the system according to the needs throughout the year. Monitoring is powered by PV-COOLING itself.
4.3. PV COOLING management
Building thermal load is estimated as follows:
(
)
(
)
(
)
(
)
)
(
.
t
G
V
T
t
T
t
K
S
P
t
t
P
Build Load ext set Build SolIr (eq. 1)With:
-
T
ext : outdoor temperature-
T
set: indoor set point temperature- G : volume heat loss coefficient [W/m3.°C] chosen as G=2.5 (poorly insulated building in our case) - V: the cooled volume. V=325 m3
- PSol.Ir
: Power of solar irradiation [W/m
2]- SBuild
: time average wall surface of building exposed to solar irradiation (chosen to 40 m
2) - K: solar power absorption sensitivity of building walls [non-dimensional, 0
K
1], chosen to 0.20 -
(t-
) : delay function (Dirac), corresponds to thermal inertia of building to solar irradiation (
= 1 hour) For the automatic control of heat pump management, several approaches are tested between two main paradigms.The first one is the economy mode (also designated as “eco” mode) in which compressor driving power is adapted to PV output power.
The second one is the comfort mode in which set point value consists in keeping constant chilled water feedback temperature (12°C) and if necessary take complementary power from the grid when both PV and batteries power are insufficient.
5. Results and discussion
PV COOLING test bench has been tested during several months with monitoring sequences of several days from June to September 2017. The electrical resistance of the heater has been controlled to model a 350 m3 building (i.e. 135m² with a high ceiling of 2.60m). To correspond to reality, an outside temperature sensor has been installed.
PV COOLING major monitoring data and performance results are presented hereby, for both “eco” and
“comfort” modes, and under both sunny and intermittently disrupted sunny/cloudy conditions.
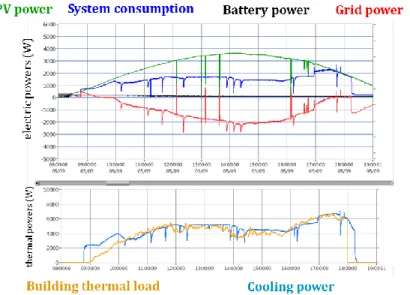
On graphical displays of fig. 7 to 11, negative values of grid electric powers means that power in injected by PV system into the grid (red curve). For battery (black curve), it is the opposite (this was done for legibility). Data and performances results are obtained on a daily basis, from 8 a.m. up to 7 p.m. Those data may permit one to appreciating PV COOLING efficiency (fig. 12), especially EER (ratio of thermal energy produced to grid energy consumption, from 8 a.m. up to 7 p.m.).
5.1. “eco” mode
Figure 7 below shows PV COOLING monitoring data captured on Sept 5th. Although this was a very sunny
day, weather was quite windy due to a northern dry and cold wind, designated as “Mistral” (quite typical of south of France) : Mistral blows clouds away and also pushes Mediterranean sea thermocline offshore, such that sometimes even in summer, swimming on the French Riviera is a matter of bravery !
That explains why despite of sunny conditions, thermal load is far below classical figure in this period of the year. Therefore, PV-COOLING power remains far below PV power until late afternoon (5:30 p.m.) and no any external source is required. This case gives EER = 106.3 ! (see fig. 12).
Fig. 7: Electric and thermal powers time history (Sept 5th 2017 – TOULON) – “eco” mode
It can be noticed that if PV-COOLING manager was configured as “comfort” mode, results would have been identical.
Figure 8 displays a much more significant case of ”eco” mode efficiency : Sept 6th was quite a disrupted sunny/cloudy day until 4:00 p.m. and in can be seen that system consumption (and thus cooling power) is limited by both PV power and thermal load.
One can notice that despite disrupted conditions, Sept 6th conditions show a much higher building thermal load than eve, and even in “eco” mode, cooling power matches quite well thermal load history. This case gives EER = 44 (see fig. 12).
Fig. 8: Electric and thermal powers time history (Sept 6th 2017 – TOULON) – “eco” mode
5.2.”comfort" mode
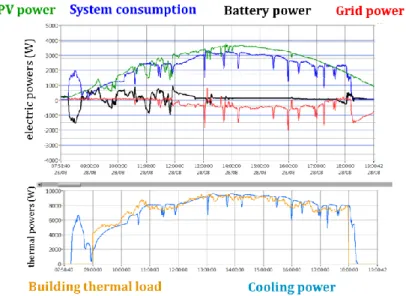
Figure 9 displays PV-COOLING results obtained on Aug. 28th 2017, quite a sunny day and with high thermal load (71.15 kWh), a high cooling production (75.46 kWh) and a low grid consumption (0.47 kWh) which yields to EER = 161.93 (see fig. 12).
Figure 10 displays following day (Aug 29th) which much more disrupted than previous example and still exhibits high thermal load (72.04 kWh) a high cooling production (75.14 kWh) and a low grid consumption (0.78 kWh). Here EER = 95.82 (see fig. 12).
Similar comments can be done regarding Aug. 30st (fig. 11) where cooling power matches quite well building thermal load history. One may notice that battery power was limited to 1.5 kW as a security barrier set up to save battery lifetime, which yields to grid consumption (3.15 kWh) and consequently degrades performances to EER = 24.71 (see fig. 12).
On all those examples, one can see that priority is given to battery as external supply (at the condition that battery charge level is sufficient).
Fig. 9: Electric and thermal powers time history (Aug. 28th 2017 – TOULON) – “comfort” mode
Fig. 10: Electric and thermal powers time history (Aug. 29th 2017 – TOULON) – “comfort” mode
Fig. 11: Electric and thermal powers time history (Aug. 30th 2017 – TOULON) – “comfort” mode
Fig. 12 below is a synthetic table of significant values which permit one to appreciating PV-COOLING performances.
Fig. 12: Summary off significant values for different weather and management conditions DATA sept 5th sept 6th Aug. 28th Aug. 29th Aug. 30th
overall electric consumption(kWh) 14,52 17,87 22,62 22,22 25,24 PV electric consumption (kWh) 14,11 16,64 21,29 19,26 15,95 PV energy production (kWh) 26,56 19,94 25,88 22,94 18,72
consumption from battery (kWh) 0,00 0,01 0,87 2,18 6,13
Qgrid: consumption from GRID (kWh) 0,40 1,22 0,47 0,78 3,15
building thermal load (kWh) 38,64 51,74 71,15 72,04 75,99
Qth: cooling production (kWh) 43,03 53,87 75,46 75,14 77,89
compressor COP 3,40 3,36 2,91 2,96 2,82
"PV COOLING" COP 2,96 3,02 2,72 2,76 2,64
PV COOLING "EER" (Qth/Qgrid)
106,34 44,11
161,93 95,82 24,71
SELF CONSUMPTION RATE (%)
53
83
82
84
85
SELF PRODUCTION RATE (%)
97
93
94
87
63
"ECO" mode "COMFORT" mode
Surprisingly high values of EER are the result of very low grid consumption and have to be interpreted with humility: in fact, comparing EERs on Aug. 28th and 29th (respt. 162 and 96) is only du to 0.31 kWh
difference in 11 hours !
However, as a result of those examples, it may be concluded that PV-COOLING concept can be considered as efficient and quite acceptable values of EER were obtained which demonstrate possibility to run PV-COOLING independently from grid.
5.3. Estimate of environmental and economic benefit
From 2017 summer measurements, an attempt has been done with a view to estimating environmental and economic benefit due to PV COOLING. This was done considering thermal cooling need for days when cooling is required, and the monthly rate of days of for which cooling is needed. This yields to monthly cooling energy (kWh).
(a) (b)
Fig. 13: Elements of estimate of the environmental and economic benefit (a): in southern France (French Riviera) ; (b): in southern Europe (southern Italy)
Figure 13(a) above shows the result in terms of cooling energy (kWh) and electricity induced CO2 (kg) during the period from april to September for our 135 m2 office building in south of France (French riviera): 232 kg; although Figure 13(b) produces same results considering southern Italy : 1270 kg.
A transposition is done considering a 1000 m2 office building over a 15 years duration, and by considering 2 hypothesis : (1) PV COOLING COP = 3 and (2) one may expect a 3 % annual increase in electric energy cost.
In France (fig.13(a)), the required 7.7 MWh induces 232 kg CO2 and in southern Italy (fig.13(b)), 12 MWh correspond nearly to 1.3 ton of CO2.
Transposition to a 1000 m2 office building shows the following:
COa saving of 25,8 tons in France and 141 tons in Italy
Energy saving cost of 30 k€ in France and 121 k€ in Italy.
The disparity is due to the fact that in Italy, as a lot of Europeans countries (and unkike France), grid power rests upon embodied energy and consequently carbon footprint is much higher than in France.
Similar remarks may be done and for the same reasons regarding cost considerations where PV COOLING may induce 121 k€ in Italy although the same PV COOLING may only induce 30 k€ in southern France.
kWh(th) per day Nb days rate of use (%) kWh (thermal) kg CO2/kWh (elec) CO2 benefit (kg) april 20 30 20% 120 0,09 4 may 40 31 50% 620 0,09 19 june 60 30 85% 1 530 0,09 46 july 75 31 100% 2 325 0,09 70 aug. 65 31 90% 1 814 0,09 54 sept. 50 30 70% 1 050 0,09 32 oct. 30 31 30% 279 0,09 8 TOTAL 7 738 232 kWh(th) per day Nb days rate of use (%) kWh (thermal) kg CO2/kWh (elec) CO2 benefit (kg) april 30 30 30% 270 0,32 29 may 50 31 70% 1 085 0,32 116 june 80 30 100% 2 400 0,32 256 july 95 31 100% 2 945 0,32 314 aug. 80 31 100% 2 480 0,32 265 sept. 75 30 80% 1 800 0,32 192 oct. 50 31 60% 930 0,32 99 TOTAL 11 910 1 270
6. Conclusion
To conclude, the developed and tested PV-COOLING concept allows bringing following conclusions:
PV-COOLING demonstrates that it is possible to combine improved technologies which are
photovoltaic (PV) power plant to drive vapor compression thermodynamic system for the sake of producing cooling energy ;
Securing PV plant with external power supply to drive thermodynamic system was successfully demonstrated ;
Part of efficiency results in possibility to real-time adapting cooling power to solar irradiation ;
EER obtained values shows that only a limited amount of grid supply is necessary and consequently, external generator may efficiently be substituted to grid ;
Proper management permits one to consider fully autonomous systems disconnected from grid ;
Technically, existing system is planned to further investigate clever ways of using PV excessive power. This concerns mainly investigating cold storage (as shown on fig.2), but also electric storage and compare which is better to improve autonomy of PV-COOLING.
Comparison of Italy vs France benefits of PV COOLING shows that energy cost and current grid power carbon footprint is a drastic parameter for environmental and economic efficiency. In this respect, France is far from holding the best position for developing a renewable energies policy.
The marketing plans carried out target PV COOLING as a development tool in sunny and/or tropical regions for both air-conditioning system and positive food storage. Eventually, PV-COOLING concept open wide perspective for insulated areas and may constitute a tool for land-use planning, and especially in the developing world.
7. References
Gustavsson J., Cederberg C., Sonesson U., van Otterdijk R., Meybeck A., 2011. Global food losses and food waste – Extent, causes and prevention. Report of Food and Agriculture Organization of the United Nations (FAO).