Publisher’s version / Version de l'éditeur: Applied Acoustics, 29, 3, pp. 193-205, 1990
READ THESE TERMS AND CONDITIONS CAREFULLY BEFORE USING THIS WEBSITE. https://nrc-publications.canada.ca/eng/copyright
Vous avez des questions? Nous pouvons vous aider. Pour communiquer directement avec un auteur, consultez la première page de la revue dans laquelle son article a été publié afin de trouver ses coordonnées. Si vous n’arrivez pas à les repérer, communiquez avec nous à [email protected].
Questions? Contact the NRC Publications Archive team at
[email protected]. If you wish to email the authors directly, please see the first page of the publication for their contact information.
NRC Publications Archive
Archives des publications du CNRC
This publication could be one of several versions: author’s original, accepted manuscript or the publisher’s version. / La version de cette publication peut être l’une des suivantes : la version prépublication de l’auteur, la version acceptée du manuscrit ou la version de l’éditeur.
Access and use of this website and the material on it are subject to the Terms and Conditions set forth at
Impulse-response and reverberation-decay measurements made by
using pseudorandom sequence
Chu, W. T.
https://publications-cnrc.canada.ca/fra/droits
L’accès à ce site Web et l’utilisation de son contenu sont assujettis aux conditions présentées dans le site LISEZ CES CONDITIONS ATTENTIVEMENT AVANT D’UTILISER CE SITE WEB.
NRC Publications Record / Notice d'Archives des publications de CNRC: https://nrc-publications.canada.ca/eng/view/object/?id=bfd5f02d-7254-4e62-bda1-cd74f019def0 https://publications-cnrc.canada.ca/fra/voir/objet/?id=bfd5f02d-7254-4e62-bda1-cd74f019def0
Ser
TH1 National Research Conseil national N21 d
!+I
Council Canada de mherches Canadano, 1683
c. 2 Institute for lnstitut de
B L D G
Research in Construction construction recherche enImpulse-Response and
.
Reverberation-Decay
Measurements Made by Using
Pseudorandom Sequence
by W.T. Chu
Reprinted from
Journal ADDlied Acoustics Vol. 29, NO: 3,1990
p. 193-205
(IRC Paper No. 1683)
NRCC 32353
N R C
-
CISTIL'auteur expose de fawn ddtaillee la mdthode de corrdlation aoisde comportant l'utilisation d'une dquence pseudo-aldatoire firiodique de mesures de la rdponse en impulsion et da l'affaiblissement de la r4verMration.
Il
p r h t e aussi les rbultats d'wriences visant B rnontrerque cette mdthade permet d'effectuer des mesures dans un e n m e m e n t t r b bruyant.
Applied Acoustics 29 (1990) 193-205
Impulse-Response and Reverberation-Decay
Measurements Made by Using a Periodic
Pseudorandom Sequence
W. T.
ChuAcoustics Section, Institute for Research in Construction, National Research Council of Canada, Ottawa, Ontario, Canada KIA OR6
(Received 6 October 1989; accepted 9 November, 1989)
ABSTRACT
A detailed account of the cross-correlation method involving the use of a periodic pseudorandom sequence for impulse-response and reverberation- decay measurements is presented. Experimental results are also provided to demonstrate the potential of this method for making measurements in a very noisy environment.
INTRODUCTION
The most fundamental physical descriptor in room acoustics is the impulse response between a source and a receiver position in the room. All the acoustical measures for subjective evaluations of rooms, including reverberation time, can be derived from the impulse response. With the advent of microcomputers and digital-signal processing, more efficient and accurate techniques for measuring impulse responses become feasible. A general review of both the conventional and the modern techniques has been given by Otshudi, Guilhot, and Charles.'
Among the modern techniques, the one originated by Schroeder and his colleages at G ~ t t i n g e n ~ , ~ has gained widest acceptance by
acoustician^^-^
and, in this author's opinion, is the most powerful method available. The technique uses a periodic pseudorandom sequence (also known as a maximum-length sequence or m-sequence) as the source signal, and the impulse response is determined by a cross-correlation method based on193 0 1990 Canadian Government
194 W. T. Chu
techniques developed in Hadamard spectroscopy. Since this technique effectively uses a very large number of pulses limited only by the length of the sequence chosen, it offers a significant improvement of the signal-to-noise ratio. In addition, the cross-correlation process minimizes the influence of background noise. With adequate averaging, it is possible to use signal levels that are significantly below background-noise level, making this technique very useful for acoustical measurements in auditoria, offices, factories, or construction sites. Computer plug-in boards and software for implementing this measuring technique are now commercially available.
An understanding of the method, including the special signal processing involved, is essential for proper utilization (or to design one's own system). However, a simple and coherent treatment of the subject is lacking in the acoustical literature. In this paper, a review of the basics will be given, together with examples of measurements in a simulated noisy environment. Problems related to characteristics of the source driver, the receiver, and any intervening electronics on the 'fidelity' of the measured impulse response will not be addressed here. As suggested by K ~ t t r u f f , ~ this should not be an important issue for reverberation-decay measurements in rooms of simple shapes if an omni-directional receiver is used. This is certainly the case for most residential and industrial noise-control applications.
IMPULSE RESPONSE BY CROSS-CORRELATION
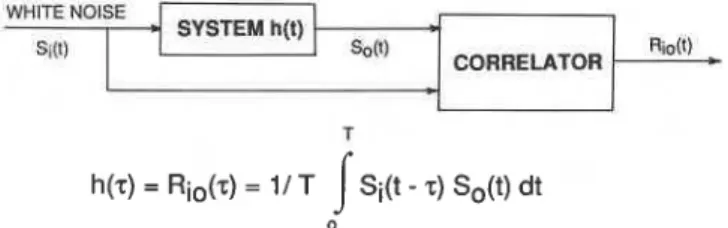
According to random-noise theory,'' the input-output cross-correlation, R,,, of a linear time-invariant system under white-noise excitation is proportional to the system impulse response, h(t) (Fig. 1). The technique proposed by Schroeder and his colleages involves replacing the random noise with an m-sequence. An m-sequence is a periodic binary sequence that has an approximately flat spectrum, and it can be generated fairly simply by a feedback arrangement of shift registers. Its periodic length, n, is equal to
2"- 1, where m is the number of stages used in the shift-register
arrangement. A detailed discussion about its generation and properties has been given elsewhere by the present a ~ t h o r . ~
WHITE NOWE
SIN) Rio(t)
h ( ~ ) = R i ~ ( ~ ) = l l T
j
Si(t-z)So(t)dtImpulse-response and reverberation-decay measurements
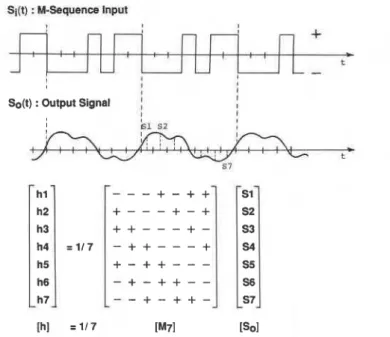
Sl(t) : M-Sequence Input
I I
I I
So(t) : Output Signal I I I
I I
C t
57
[h] =I17 [Mi'] [SO]
Fig. 2. Example of a matrix representation of the cross-correlation method with an m- sequence used as the input signal.
Figure 2 shows an example of an m-sequence of length 7 as the input signal Si and a hypothetical output signal So. Since the m-sequence is periodic, the output is also periodic. For signal processing, the binary states of 0 and 1 of the sequence have to be mapped into f 1 by changing 1 to - 1 and 0 to
+
1. Only the signs+
and - are used for f 1 in the figure and subsequent discussions.If So is sampled at the clock frequency of the sequence, one has in matrix form the following relationship for the cross-correlation:
Chl = 7 - 'CM71 [Sol (1)
where [ M 7 ] is a 7 x 7 matrix containing the right circularly delayed version of the sequence M ( - ) with a period equal to seven times the clock period. For this special case, the number of stages, m, used in the shift-register arrangement is 3. Since the elements of [ M , ] are all f 1, only additions and subtractions are required to perform the matrix multiplication [ M , ] [So].
MATRIX MULTIPLICATION VIA FAST HADAMARD TRANSFORM
The computation of [ M , [ [ S , ] can be performed efficiently by using special techniques developed in Hadamard spectroscopy. These techniques involve
196 W . T. Chu I I
finding the permutation equivalence [MI = [PI [HI [ Q ] between the m- sequence matrix M and the Sylvester-type Hadamard matrix H such that the fast Hadamard transform can be applied to obtain [ M 7 ] [ S 0 ] . Specific procedures for constructing the permutation matrices P and Q can be found in earlier ~ o r k , ~ , " , ' ~ but the one presented by Cohn and Lempel13 is the easiest to follow and will be discussed in the following sections by using the example of Fig. 2.
Fast Hadamard transform
1
Analogous to the fast Fourier transform, the fast Hadamard transform is an efficient algorithm for performing a Sylvester-type Hadamard-matrix multiplication. The elements of a Hadamard matrix are all f 1. An account on the construction of these matrices of orders 1, 2, 4, 8, 16, . . .
,
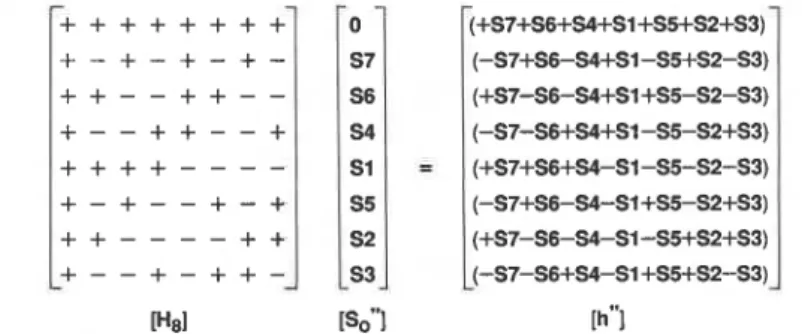
2" can be found in a book by Harwit and Sloane.12 For example, a Sylvester-type Hadamard matrix of order 8 has the following form:and a direct evaluation of the following matrix multiplication
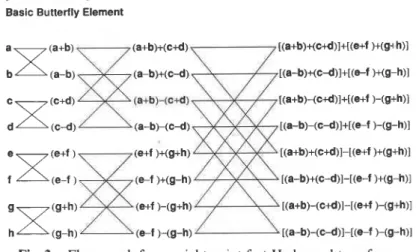
will require 56 operations. The fast Hadamard transform does this in three steps, since m equals three for the above Hadamard matrix of order 8. The procedure can simply be expressed by the flow graph shown in Fig. 3 adapted from the work of Borish and Angell." The total number of
Impulse-response and reverberation-decay measurements 197
y 43 cx-y, ' Basic Butterfly Element
[(a-b)-(c-d)l+[(e-f )-(g-h)l
[(a-b)+(c-d)l-[(e-f )+(g-h)l [(a+b)-(c+d)l-[(e+f )-(g+h)l [(a-b)-(c-d)l-[(e-f )-(g-h)l
Fig. 3. Flow graph for an eight-point fast Hadamard transform.
operations for this case is only 24. In general, the fast Hadamard transform requires L(log,L) instead of L(L - 1) operations.12 A Fortran code for this transform is given by
and^.^
Permutations
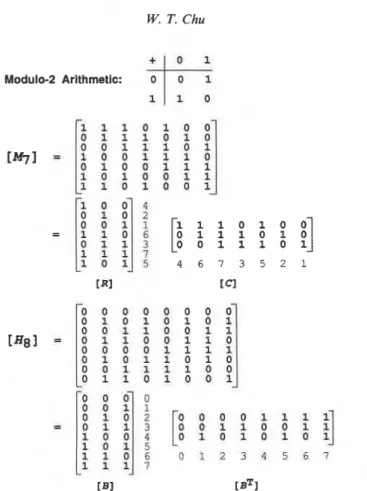
Except for the extra first row and first column, the matrix H , of eqn (2) is similar to the matrix M , of Fig. 2. The essence of the current technique is that, by adding a row and a column of
+
1 to the matrix M,, one can reorder the rows and columns of the augmented matrix to transform it into [ H , ] .Using the binary representation (i.e. 0 and 1 instead of f 1) and modulo-2 arithmetic, Cohn and Lempel13 have shown that any m-sequence matrix M (of dimension n x n) can be factored into two matrices: a matrix R (of dimension n x m) and a matrix C(of dimension m x n) where
[ q
is formed by the first m rows of [ M J . The matrix R is chosen from the columns of [MJ such that the first m rows of [ R ] form an m x m unit matrix. An example based on the matrix M , of Fig. 2 is shown in Fig. 4.Similarly, the Sylvester-type Hadamard matrix H (of dimension L x L) can also be factored into two matrices: a matrix B(of dimension L x m) and a matrix BT (of dimension m x L) where BT is the transpose of B. The ith row of
[a
is the m-bit base-2 representation of the integer i, i = 0,1,. . . , L - 1. An example of the matrix H, is also shown in Fig. 4. If the rows of [ R ] and the columns of[ q
are tagged according to the integer equivalence of their m-bit digits as shown in Fig. 4, it is obvious that [ M , ] and [ H , ] contain the same elements in a different order. Note that the tags of the rows and columns ofW. T. Chu
Modulo-2 Arithmetic:
+fx
Fig. 4. Factorization of the m-sequence matrix and the Sylvester-type Hadamard matrix. Beside each factored matrix are the corresponding 'tags' for each row or column.
the matrices Band BT are always in ascending numerical order. Thus, using the tags of [R] and
[a,
one can transform [M,] into [H,] in three steps. (1) Use the tags of[q
to reorder the columns of [M,] of Fig. 2 (i.e. move the seventh column of [M,] (whose tag= 1) into the first- column position, and the sixth column (whose tag = 2) into the second-column position, etc.) to form the permuted matrix M;, whereImpulse-response and reverberation-decay measurements I99
(2) Use the tags of [R] to reorder the rows of [ M ; ] (i.e. move the third row of [ M ; ] (whose tag = 1) into the first-row position, the second row (whose tag = 2) into the second-row position, and the fifth row (whose tag = 3) into the third-row position, etc.).
(3) Add a row and a column of
+
to the last matrix to transform it into CHsl.OUTLINE OF THE CROSS-CORRELATION PROCESS Having established the transformation between [M,] and [H,], one can formulate the following procedure to compute [h] by using [H,] instead of [M71.
(1) Generate the matrix M from one period of the m-sequence. (2) Factor [MI into [ R ] and
[q
(Fig. 4).(3) Obtain the row tags of [R] and the column tags of
[a
according to the integer equivalence of their rn-bit binary digits. If a triggerable m- sequence generator is used, the permutation tags can be generated once and stored for all subsequent experiments by using the same sequence.(4) Reorder the elements of [So] by using the column tags of
[a
and add a zero element to the permuted column matrix SA to form [S:] (Fig. 5).(5) Apply the fast Hadamard transform to [S:] to give [h"] (Fig. 5). ( 6 ) Omit the first element of [h"] and reorder the elements of the
resulting matrix, h', by using the row tags of [R] given in Fig. 4 to give the impulse response [h]. However, the reordering process will be reversed. Here, one takes the fourth element of [h'] as the first element, the second element of [h'] as the second element, and the first element of [h'] as the third element, etc.
+
-
+ + + + + + + +
+ - + - + - + -
+ + - - + + - -
+ - - + + - - +
+ + + +
- - - -+ - + - - + - +
+ + - - - - + +
+ - - + - + + -
--
[Hd [So"] [h"lFig. 5. Illustration showing the product of the Hadamard matrix and the permuted matrix of the output signal.
- - (+S7+S6+ss+Sl +S*S2+S3) (-S7+S6-S4+Sl-SS+S2-S3) (+S7-S6-S4+S1 +S5-S2-S3) (-S7-S6+S4+S1 -S5-S2+S3) (+S7+S6+s4-Sl-SS-S2-S3) (-S7+S6-S4-S1+S5--S2+S3) (+S7-S6-S4-Sl -S5+S2+S3) (-S7-S6+S4-S1 +S5+S2-S3) - v -0 S7 S6 S4 Sl S5 S2 S3 b -=
200 W . T. Chu
The reader can easily verify the procedure by using the example given in Figs 2, 4, and 5.
REVERBERATION DECAY
According to Schroeder,14 the ensemble average (s2(t)) of the squared decaying-sound pressure at a receiving point in a room excited by a white- noise signal is equal to a certain integral over the squared impulse response
h2(z) of the room. Mathematically, the relation can be written as follows:
where N is proportional to the power-spectral density of the noise in the measured frequency range. For narrow-band applications, one can either use filtered white-noise excitation or perform a narrow-band filtering on the broad-band impulse response. Aoshima15 suggested another approach, involving the use of the Fourier transform of the impulse response. His method requires one Fourier transform for each data point in the decay curve. For reasonable resolutions in both the time and the frequency domains, this approach requires one to compute and store in computer memory at least fifty l0k-point transforms. This is beyond the capabilities of most microcomputers.
EXPERIMENTS
Some preliminary results for impulse-response and reverberation-decay measurements have been reported by the present a ~ t h o r , ~ using the cross- correlation technique based on a recipe given by Harwit and Sloane,12 which was modified later according to the procedure given in the previous section. These results showed that the decay curve obtained by the present method compared well with the curves determined by the traditional method.
Additional experiments have been performed to demonstrate that impulse-response and reverberation-decay measurements can be obtained in very noisy environments. These measurements were taken for one fixed microphone and source position in a model reverberation chamber with dimensions 3.2 m x 2.6 m x 1.96 m. The chamber was equipped with fixed diffusers only. High-level non-stationary background music was deliberately introduced into the room by using a radio. For this series of experiments, an IBM AT-compatible microcomputer was used together with an A/D board (Microway A2D-160), which has a built-in m-sequence generator and a software package written in assembly language that can perform the impulse-response calculation efficiently.
Impulse-response and reverberation-decay measurements 20 1
For impulse-response and reverberation-decay measurements, the period of the m-sequence should be at least as long as the reverberation time to cover a 60-dB decay range. Thus, a sequence of length n = 216 - 1 = 65 535, operating at a clock frequency of 20 kHz, was used for our experiments. The test signal was fed into a power amplifier and radiated into the room through a loudspeaker. The acoustical signal at one chosen location in the room was measured with a 25.4-mm B&K microphone, whose output was sampled at the same clock frequency of 20 kHz. The microphone signal was averaged over a predetermined number of periods to enhance the signal-to-noise ratio before the impulse-response and the decay curve were computed.
RESULTS AND DISCUSSIONS
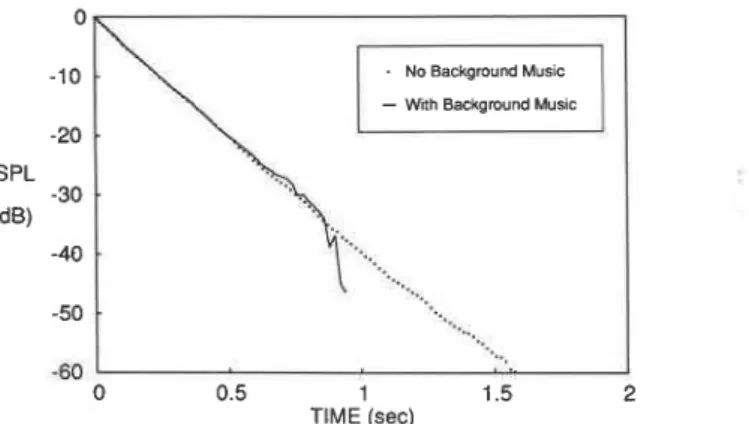
Figure 6(a) shows the measured broad-band impulse response for the chosen microphone and source position with no background music. The signal used was at least 50dB above the ambient background noise. Five averages were used to reduce the influence of this ambient background noise in the room to establish base-line results for comparisons. The impulse response was normalized by its maximum value. A similar broad-band impulse response measured in a simulated noisy environment by using music from a radio is presented in Fig. 6(b). The signal used was 9 dB below the background music. By using 100 averages for this case, the recovered impulse response compared well with that of Fig. 6(a) as indicated by the differences plotted in Fig. 6(c), whose axes of ordinates have been magnified ten times.
A comparison of the decay curves computed from these impulse responses by using eqn (5) is shown in Fig. 7. Agreement to within 1 dB was obtained for the initial 27-dB range of decay. Better dynamic range can be obtained if more averages are used. In general, one can expect a gain in signal-to-noise ratio of 10 log,, N, N being the number of averages used. However, this gain will not be fully reflected in the dynamic range of the decay curve because of the accumulative effect inherent in the summation process of eqn (5). More detailed investigation is required to establish criteria for choosing the appropriate number of averages to achieve a certain dynamic range of the decay curves. The number of averages required will depend on the length of the m-sequence used, the characteristics of the background noise present, and the band-width of the analysis.
To show that the current method is also applicable for narrow-band analyses, the impulse response of Fig. 6b was digitally filtered by using a 6- pole Butterworth digital filter whose response satisfies the requirements of ANSI S1.11-1966 class I1 for a 2-kHz octave-band filter. A comparison of its
W. T. Chu TIME (ms) -1 0 200 400 600 800 TlME (ms) (b) 0.1 -0.1 0 200 400 600 800 TlME (ms) ( 4
Fig. 6. Comparison of the broad-band impulse responses measured with different signal-to- noise ratio: (a) with no background music and signal more than 50dB above background; (b) with background music and signal 9dB below background (100 averages); (c) difference
between the two impulse responses of (a) and (b).
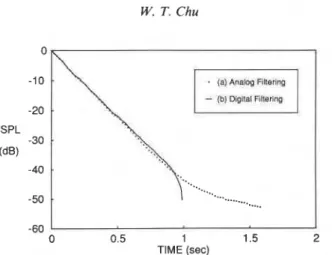
filter characteristic with that of a Bruel & Kjaer type 1613 analog octave filter is shown in Fig. 8, and the computed decay curve is shown in Fig. 9. For comparison, a decay curve obtained by exciting the room with a filtered m- sequence signal and using the Bruel & Kjaer analog octave-band filter is also depicted in Fig. 9. No background music was introduced in this
Impulse-response and reverberation-decay measurements 203
SPL (dB)
- With Background Music
-30 . -40 . -50 . ... -60 0 0.5 1 1.5 2 TIME (sec)
Fig. 7. Comparison of the broad-band decay curves computed from the impulse responses
of Fig. 6. 0 -20 - dB -
.
. 100 1000 10000 FREQUENCY (Hz)Fig. 8. Comparison of the filter characteristics of the six-pole Butterworth digital-octave
filter and the Bruel & Kjaer Type 1613 2-kHz analog octave filter.
SPL -30 (dB) - (b) Oigiral mering *._.
-.-..
... .... '... ...Fig. 9. Comparison of the 2-kHz octave-band decay curves: (a) from the impulse response
obtained by exciting the room with analog-filtered m-sequence signal and no background music; (b) from digitally filtering the broad-band impulse response of Fig. 6(b).
204 W. T. Chu SPL -30 (dB) -60
0
0 0.5 1 1.5 2 TIME (sec)Fig. 10. Comparison of the 2-kHz octave-band decay curves: (a) from the impulse response
obtained by exciting the room with analog-filtered m-sequence signal and no background music; (b) from digitally filtering the broad-band impulse response of Fig. 6(a).
measurement. Agreement to within 1 dB was obtained for the initial 24-dB range of decay.
Better dynamic range for the case with digital filtering can be expected if a broad-band impulse-response curve with less contamination of background noise is used as input. This is shown by a similar comparison in Fig. 10 with the impulse-response curve of Fig. 6a used as the input. The agreement of the decay curves is fairly good (within 1 dB for the initial 30-dB range of decay), which indicates that narrow-band results can be obtained from the broad- band impulse response by using digital filtering.
CONCLUSION
A fairly detailed account of the cross-correlation method involving the use of a periodic pseudorandom sequence for impulse-response and reverberation-decay measurements has been given. Experimental results are also provided to demonstrate its potential for making measurements in very noisy environments. Good signal-to-noise ratio can be obtained because of the immunity of the cross-correlation method to unrelated background noise and the possibility of using long sequences and averaging. The existence of an efficient algorithm based on the fast Hadamard transform for performing the cross-correlation has made this method a very powerful
measuring technique. At t = 0, eqn (5) gives the mean-square pressure. Thus, I the current method can also be used for attenuation or transmission-loss
Impulse-response and reverberation-decay measurements
1
ACKNOWLEDGEMENT
The author wishes to thank Dr R. E. Halliwell for supplying him with the digital-filtering program and Dr J. D. Quirt for his valuable comments and suggestions.
L
REFERENCES
1. Otshudi, L., Guilhot, J. P. & Charles, J. L., Overview of techniques for measuring impulse response in room acoustics. Proc. Inst. Acoust., 10 (1988) 407- 14.
2. Schroeder, M. R., Integrated impulse method measuring sound decay without impulses. J. Acoust. Soc. Am., 66 (1979) 497-500
3. Alrutz, H. & Schroeder, M. R., A fast Hadamard transform method for the evaluation of measurements using pseudorandom test signals. In Proc. 11th
Congress Acoust., Paris (GALF, France, 1983) 6 (1983) 235-8.
4. Eriksson, P., Measurement of reverberation decay function and acoustical impulse response using maximum-length sequences and FFT. Report TVBA-
3005, Department of Building Acoustics, Lund Institute of Technology,
Sweden, 198 1.
5. Ando, Y., Concert Hall Acoustics. Springer-Verlag, Berlin, 1985.
6. Palmer, E. P., Price, R. D. & Burton, S. J., Impulse-response and transfer- function measurements in rooms by m-sequence cross correlation. J. Acoust.
Soc. Am., 80(S1) (1986) S56(A).
7. Malcurt, C. & Jullien, J. P., Sound field prediction in a variable acoustic hall. In
12th ZCA, Toronto, Canada, 1986, paper E5-1.
8. Chu, W. T., A deterministic broad-band signal for acoustical measurements.
Inter-Noise 87 1199-202.
9. Kuttruff, H., Room Acoustics. Applied Science Publishers Ltd, London, 2nd Edition, 1979, p. 209.
10. Lee, Y. W., Statistical Theory of Communication. John Wiley & Sons, New York, 1960.
1 1 . Borish, J. & Angell, J. B., An efficient algorithm for measuring the impulse response using pseudorandom noise. J. Audio Engng Soc., 31 (1983) 478-87. 12. Harwit, M. & Sloane, N. J. A., Hadamard Transform Optics. Academic Press,
New York, 1979.
13. Cohn, M. & Lempel, A., On fast M-sequence transforms. IEEE Trans. In$
Theory IT-23 (1977) 135-7.
14. Schroeder, M. R., New method of measuring reverberation time. J. Acoust. Soc.
Am., 37 (1965) 409-12.
15. Aoshima, N., New method of measuring reverberation time by Fourier transforms. J. Acoust. Soc. Am., 67 (1980) 1816-17.
This paper is being distributed in reprint form by the Institute for Research in Construction. A list of building practice and research publications available from the Institute may be 0btained.b~ writing to Publications Section, Institute for Research in Construction, National Research Council of Canada, Ottawa,
Ontario, KIA OR6.
Ce document est distribu6 sous fonne de MA-part par
1'Institut de recherche en construction.
O n
peut obtenir une liste des publications de 1'Institut portant sur les techniques ou les recherches en mati* de bgtiment enkrivant A la Section des publications, Institut de recherche en construction, Conseil national de recherches du Canada, Ottawa (Ontario),