HAL Id: hal-02635741
https://hal.archives-ouvertes.fr/hal-02635741
Submitted on 27 May 2020HAL is a multi-disciplinary open access archive for the deposit and dissemination of sci-entific research documents, whether they are pub-lished or not. The documents may come from teaching and research institutions in France or abroad, or from public or private research centers.
L’archive ouverte pluridisciplinaire HAL, est destinée au dépôt et à la diffusion de documents scientifiques de niveau recherche, publiés ou non, émanant des établissements d’enseignement et de recherche français ou étrangers, des laboratoires publics ou privés.
Distributed under a Creative Commons Attribution - NonCommercial - NoDerivatives| 4.0 International License
Megan Bennett, Heather Dion, Ryan Fitzgerald, Amy Gaffney, Alkiviadis
Gourgiotis, Amelie Hubert, et al.
To cite this version:
Richard Essex, Jacqueline Mann, Ronald Colle, Lizbeth Laureano-Perez, Megan Bennett, et al.. New determination of the 229Th half-life. Journal of Radioanalytical and Nuclear Chemistry, Springer Verlag, 2019, 318 (1), pp.515-525. �10.1007/s10967-018-6032-9�. �hal-02635741�
Manuscript Title Page
1
Special Issue (SI): MARC XI
2
Log Number of Paper: 369
3
Names of authors: Richard M. Essex1, Jacqueline L. Mann1, Ronald Collé1, Lizbeth Laureano-4
Perez1, Megan E. Bennett 2, Heather Dion3, Ryan Fitzgerald1, Amy M. Gaffney4, Alkiviadis 5
Gourgiotis5, Amélie Hubert6, Kenneth G. W. Inn7, William S. Kinman3, Stephen P. Lamont3, 6
Robert Steiner3, Ross W. Williams4 7
Title: New determination of the 229Th half-life 8
Affiliation and addresses of authors:
9
1 National Institute of Standards and Technology, 100 Bureau Drive, Mail Stop 8462,
10
Gaithersburg, MD 20899, USA 11
2 Shine Medical Technologies, 101 East Milwaukee Street, Janesville, WI 53545, USA
12
3 Los Alamos National Laboratory, Los Alamos, NM 87545, USA
13
4 Lawrence Livermore National Laboratory, P.O. Box 808, L-231, Livermore, CA 94551-0808,
14
USA 15
5 Institut de Radioprotection et de Sûreté Nucléaire (IRSN), PSE-ENV/SEDRE/LELI, 31 avenue
16
de la Division Leclerc, Fontenay-aux-Roses 17
6 CEA/DAM-Ile de France, Bruyères-le-Châtel, 91297 Arpajon Cedex, France
18
7 K&E Innovations, Ewa Beach, HI 96706, USA
19
Corresponding Author: Richard.essex@NIST.gov 20
New determination of the
229Th half-life
21Richard M. Essex1, Jacqueline L. Mann1, Ronald Collé1, Lizbeth Laureano-Perez1, Megan E.
22
Bennett 2, Heather Dion3, Ryan Fitzgerald1, Amy M. Gaffney4, Alkiviadis Gourgiotis5, Amélie 23
Hubert6, William S. Kinman3, Stephen P. Lamont3, Robert Steiner3, Ross W. Williams4 24
1 National Institute of Standards and Technology, 100 Bureau Drive, Mail Stop 8462,
25
Gaithersburg, MD 20899, USA 26
2 Shine Medical Technologies, 101 East Milwaukee Street, Janesville, WI 53545, USA
27
3 Los Alamos National Laboratory, Los Alamos, NM 87545, USA
28
4 Lawrence Livermore National Laboratory, P.O. Box 808, L-231, Livermore, CA 94551-0808,
29
USA 30
5 Institut de Radioprotection et de Sûreté Nucléaire (IRSN), PSE-ENV/SEDRE/LELI, 31 avenue
31
de la Division Leclerc, Fontenay-aux-Roses 32
6 CEA/DAM-Ile de France, Bruyères-le-Châtel, 91297 Arpajon Cedex, France
33
34
Abstract
35A new determination of the 229Th half-life was made based on measurements of the 229Th massic 36
activity of a high-purity solution for which the 229Th molality had previously been measured. 37
The 229Th massic activity was measured by direct comparison with SRM 4328C using 4παβ 38
liquid scintillation counting, NaI counting, and standard addition liquid scintillation counting. 39
The 229Th massic activity was confirmed by isotope dilution alpha spectrometry measurements. 40
The 229Th half-life calculated from the activity measurements is (7825 ± 87) years (k = 2). 41
Key Words
42229Th, half-life, liquid scintillation counting, NaI counting, isotope dilution alpha spectrometry
43
Introduction
44The 229Th isotope is a relatively long-lived nuclide in the 237Np decay series and primarily occurs 45
as a decay product of 233U [1]. The isotope decays by α emission to 225Ra which, in turn, decays 46
to 225Ac followed by a series of short-lived nuclides to 209Bi (Fig. 1). The 229Th isotope does not 47
occur in nature making it useful to the environmental and geological sciences where it is used as 48
a yield tracer for thorium α spectrometry [2] and as an isotope dilution mass spectrometry 49
(IDMS) spike for thorium amount measurements [3]. In addition, 229Th is a source of high-purity
50
225Ac for research in nuclear medicine [4] and is being evaluated for use as a high accuracy
51
nuclear clock [5]. The nuclide is particularly important for nuclear forensics where it is used as 52
an IDMS spike for 230Th “dating” of uranium materials associated with the nuclear fuel cycle, 53
e.g. [6,7]. Due to ongoing interest in the radionuclide, the National Institute of Standards and 54
Technology (NIST) has produced four issues of 229Th Standard Reference Material (SRM) 55
certified for massic activity (Bq g-1). These standards are SRM 4328 issued in 1984, SRM 56
4328A issued in 1995, SRM 4328B issued in 1996, and SRM 4328C issued in 2008 [8-11]. 57
58
Fig 1. Simplified decay scheme for 229Th. The uncertainties for the half-lives are standard 59
uncertainties. Half-life and decay mode data for 229Th are from [12]. Half-life and decay mode 60
data for all other isotopes are from [13]. 61
62
To date, four half-life measurements have been published for 229Th, but these values have been 63
somewhat inconsistent. Hagemann et al. [1] published a 229Th half-life of (7340 ± 160)1 years as 64
part of a study of the 233U decay chain. This value is significantly shorter than subsequent 65
1Uncertainties for values in text are combined standard uncertainties (u
c) unless otherwise indicated with
measurements (≈ 7%) with the discrepancy attributed to a combination of factors including a 66
biased 233U half-life value used to calculate the quantity of 229Th in the analysis samples, a 67
possible underestimate of 228Th contributions to 229Th activity measurements, or 233U 68
interference in 229Th activity measurements [14-15]. Goldstein et al. [14] performed a study to 69
refine the 229Th half-life value by measuring the molality of 229Th in a solution with a well-70
characterized massic activity, SRM 4328. The resulting measurement indicated a half-life of 71
(7880 ± 120) years (k = 2). More recently, Kikunaga et al. [15] calculated a half-life of (7932 ± 72
55) years (k = 2) based on measured A(233U)/A(232U) and A(229Th)/A(228Th) activity ratios. 73
Finally, Varga et al. [16] measured the molality of the SRM 4328C massic activity standard by 74
IDMS using two different Th spikes. One spike was a commercially prepared natural Th solution 75
[Method A: (7889 ± 32) years] and the second spike was a high purity U material with a 76
calculated quantity of ingrown 230Th [Method B: (7952 ± 36) years]. The half-lives calculated for 77
each set of IDMS measurements were combined for a reported half-life value of (7917 ± 48) 78
years (k = 2). 79
Fitzgerald et al. [17] describe a massic activity calibration for the 229Th Master (M) solution used 80
to prepare SRM 4328C. To produce the stock solution for the SRM, an aliquot of the M solution 81
was quantitively diluted by a factor (DS) of 308.85 ± 0.09. The 229Th massic activity of the M
82
solution was then measured by live-timed 4παβ-γ anticoincidence counting. The massic activity 83
of the SRM solution was calculated using the measured massic activity of the M solution and the 84
gravimetrically determined dilution factor. Relative liquid scintillation (LS) counting of the M 85
and SRM 4328C solutions was used to verify the gravimetric dilution factor for the SRM, with 86
the relative difference between the activity ratio and the dilution factor of 0.04 % and a 87
combined standard uncertainty of about 0.4 % in the activity ratio. The calculated activity value 88
for the SRM was also confirmed by four additional radioactivity measurement methods, 89
including LS counting with 3H CIEMAT/NIST efficiency tracing2, triple-to-double coincidence 90
counting (LS TDCR), 2πα proportional counting, and α spectrometry. 91
In a separate project, two ampoules of the M solution were combined and diluted by a factor (DX)
92
of approximately 56.03 to produce a new reference material that was characterized for 229Th 93
molality (229Th mol g-1) and Th isotopic composition [18]. The 229Th molality of the new 94
reference material was measured by IDMS on a total of 14 sample units in two measurement 95
campaigns. To minimize potential systematic bias, three separate 232Th IDMS spike solutions 96
were prepared for the measurements and mass spectrometric analyses were distributed between 97
three different laboratories. The resulting 229Th molality value for the reference material solution, 98
(0.11498 ± 0.00008) nmol g-1, was verified using the SRM 4342A 230Th massic activity standard 99
as an independent IDMS spike. 100
101
The following describes the determination of the massic activity of the new 229Th molality 102
reference material (referred to here as 229Th RM) by direct comparison with the SRM 4328C 103
massic activity standard and the confirmation of the measured value by isotope dilution alpha 104
spectrometry (IDAS). A new value for the 229Th half-life is calculated from the measured 229Th 105
massic activity and the previously measured 229Th molality. 106
2 The acronym CIEMAT/NIST refers to the two laboratories that collaborated in developing the protocol
for this LS tracing methodology; viz., the Centro de Investigaciones Energéticas, Medioambientales y Tecnológicas (CIEMAT) and the National Institute of Standards and Technology (NIST).
3The dilution factor for the 229Th RM (D
X) is only used for comparison purposes. During the
dilution of the M solution to create the 229Th RM stock solution, the masses measured on a large-capacity Jupiter 3000 balance appear to be inconsistent with normal operation of the balance. Accordingly, the calculated dilution factor value is an approximation.
107
Direct Activity Comparison
108A massic activity value for 229Th in the 229Th RM was determined by measuring the ratio of 109
relative activities (i.e. activity per gram solution) for the 229Th RM solution and the SRM 4328C 110
activity standard. Three counting methods were used to make the relative activity 111
measurements. The first method compared the relative LS counting rates for carefully prepared 112
sources of the two solutions. Then, the relative integral photon emission rates of the LS counting 113
sources were directly compared using a NaI(Tl) well counter. Finally, a standard addition LS 114
counting method was used to determine the activity ratio from a series of mixtures of the two 115
reference materials. 116
Relative LS Counting
117
The 229Th decay series consists of a seven-nuclide-long decay chain (Fig. 1) with an LS 118
efficiency of > 6.9 s-1 Bq-1. To achieve accurate results for the comparative LS counting 119
measurements, it is imperative that the two 229Th solutions are in identical states of radioactive 120
equilibrium and that the solutions were counted with identical detection efficiency. Nearly 121
identical counting efficiency was achieved by gravimetrically determining all of the components 122
in the counting source cocktails to assure similar quenching. Identical radioactive equilibrium is 123
also a reasonable assumption when the history and handling of the solutions are considered. 124
Both 229Th solutions were prepared from quantitative dilutions of aliquots from the same M 125
solution; both solutions were diluted with 1 mol L-1 HNO3; and no additional separations or
126
processing were performed on either solution prior to sealing in glass ampoules. Ampoules of 127
both reference materials were opened specifically for the activity measurements performed in 128
April 2017, however, the SRM 4328C solution was prepared, dispensed into ampoules, and 129
sealed in October 2007 while the 229Th RM was prepared and sealed in March 2012. Although it 130
is not possible to categorically rule out chemical fractionation of the sealed M solution aliquots 131
over the 4.5 year period between preparation of the 229Th solutions (e.g., preferential adsorption 132
or precipitation of an element in the 229Th decay chain), there is no a priori reason to suspect a 133
difference in the radioactive equilibrium of the two solutions. 134
Counting sources for high precision LS were prepared from the 229Th RM and SRM 4328C 135
solutions (Table 1). Two different scintillation fluids were used to create liquid scintillation 136
sources for both 229Th solutions, Ultima Gold AB4 (PerkinElmer, Waltham, MA) and Ecoscint
137
(National Diagnostics, Tampa, FL). Three sources were gravimetrically prepared in 20 mL glass 138
LS vials for each scintillant-229Th solution combination, resulting in a total of 12 sources. To 139
prepare the sources, aliquots from ampoules of the SRM and 229Th RM were dispensed using 140
polyethylene aspirating pycnometers with masses measured on an electronic microbalance 141
(AT20, Mettler Toledo, USA). Other cocktail components were weighed with a mechanical 142
analytical balance (Mettler B5, Mettler Toledo, USA). Close matching of the aqueous mass 143
fraction in the sets of cocktails was achieved by the addition of 1 mol L-1 HNO3 to some of the
144
sources. In addition, each cocktail contained approximately 60 mg of di-(2-ethylhexyl) 145
phosphoric acid (DEHPA or HDEHP), (C8H17O)2PO2H, which is a complexing agent. Matched
146
blank sources of similar composition over the same quench range were also prepared for 147
background subtraction. 148
4Certain commercial equipment, instruments, software, or materials are identified in this paper to foster
understanding. Such identification does not imply recommendation or endorsement by the National Institute of Standards and Technology, nor does it imply that the materials or equipment identified are necessarily the best available for the purpose.
Each source was counted in triplicate on a LS 6500 counter (Beckman Coulter, Fullerton, CA, 149
USA) and on an Accuflex LSC-8000 (Hitachi Aloka Medical Ltd., Tokyo, Japan). Two LS 150
counters were used for this set of experiments to demonstrate that results are independent of the 151
operating characteristics of a particular instrument (detection threshold, photomultiplier 152
efficiency, deadtime, amplification, signal conversion, etc.). Individual LS measurements 153
consisted of integrating the entire LS spectrum, and were of sufficient duration to accumulate 154
over 106 counts, such that the relative Poisson counting statistics on each was < 0.1 %. In 155
addition to closely matching quenching conditions and cocktail compositions in counting 156
sources, both instruments use quench indicating parameters (QIP) to monitor quenching. The 157
Accuflex LSC-8000 (Counter H) uses the External Standard Channel Ratio (ESCR) quench 158
parameter, which relates quenching to the ratio of two counting windows in the Compton 159
spectrum of 133Ba. The Beckman LS 6500 (Counter B) uses a Horrocks Number (H#) to monitor 160
the quench level, which is based on the downward spectrum shift of the Compton edge of an 161
external 137Cs source with increasing quenching in the cocktail. 162 163 LS Source Series Mass of Scintillant (g) Mass of 229Th Solution Aliquot (g) Mass of Blank HNO3 (g) Total Mass Cocktail (g) ƒaq (%) H# 229Th RM UGAB 9.850 (3) 0.2039 (9) 0.798 (23) 10.912 (19) 9.18 (19) 89.0 (3) 4328C UGAB 9.852 (1) 0.9909 (10) --- 10.906 (11) 9.09 (8) 91.2 (5) 229Th RM ECOS 8.916 (17) 0.1993 (40) 0.790 (26) 9.969 (42) 9.92 (2) 118.4 (3) 4328C ECOS 8.910 (7) 1.0103 (26) --- 9.987 (8) 10.12 (2) 121.1 (3)
Table 1 229Th RM and SRM 4328C LS source preparation details and characteristics. Each LS 164
Source Series consisted of 3 separately prepared counting sources. UGAB and ECOS refer to the 165
Ultima Gold AB and Ecoscint scintillation solutions, respectively. The values for the masses (g) 166
and aqueous mass fraction faq (in %) are averages for the three sources in the series with the
values in parentheses representing the standard deviation of the means. H# is the average quench 168
indicating parameter (as measured in Counter B) which is an additional indicator of the close 169
composition matching. 170
171
Relative Photon Emission
172
As an independent measurement of the 229Th RM and SRM 4328C activity ratio, relative photon 173
emission rates were measured on the LS sources described above. Six replicate measurements of 174
each source were made on a NaI (Tl) well-type counter (2480 WIZARD2, PerkinElmer, 175
Waltham, MA). The detector crystal is 75 mm in diameter with a height of 80 mm and is 176
shielded with a minimum of 50 mm of lead. A total of 6 trials for each source were measured 177
sequentially, alternating between SRM and 229Th RM vials and the spectrum for each 178
measurement was accumulated for an interval of 10800 s (live time). Stability between trials was 179
monitored with a 1.97 kBq 129I check source (Half-life = 1.6 x 10⁷ years). The region from, 180
nominally, 20 keV to 2000 keV was integrated to obtain an integral counting rate that was 181
corrected for background. The Poisson counting statistics on any single measurement was 182
approximately 0.13 %. 183
Results for LS and Photon Emission Counting Rates
184
The measurement results are provided in terms of grand-means and great-grand-means of the 185
massic count ratios (Table 2). The measured count rates from the LS and NaI(Tl) experiments 186
are proportional to the massic activity of the respective solutions. Therefore, if 229Th decay chain 187
equilibrium is the same for both solutions, then the ratio of the massic count rates is equivalent to 188
the 229Th relative activity ratio (AX / AS) which, in turn is equivalent of the inverse ratio of M
solution dilution factors (DS / DX) for the two reference materials. The uncertainty values for the
190
grand-mean massic count ratios in Table 2 are computed precision estimators, equivalent to a 191
standard deviation of the mean (S ), that consider both the within-source and between-source
192
components of variance. The within-source component is a “typical” (i.e., average) value for the 193
standard deviation of the replicate source measurements and the between-source component is 194
the standard deviation of the mean values for the three sources. The two variance components are 195
combined in quadrature to calculate the standard deviation of the mean for each counter-196
scintillant combination. Separate great grand-means are calculated for the LS and Na(Tl) 197
measurements with a relative precision estimator calculated as described above. 198
199
LS Counters NaI(Tl) Counter
Counter Scintillant Grand Mean Massic Count Ratio S Scintillant Grand Mean Massic Count Ratio S
B UGAB 5.5186 0.0121 UGAB 5.5148 0.0143 B ECOS 5.5199 0.0155 H UGAB 5.5216 0.0088 ECOS 5.5303 0.0166 H ECOS 5.5301 0.0166
Great Grand Mean 5.5226 0.0109 5.5226 0.0170
Table 2 Count Ratios of 229Th RM - SRM 4328C as measured byLS and NaI(Tl) counters. 200
Counters H and B are as described in the text. UGAB and ECOS are as previously defined. S is
201
a relative precision estimator equivalent to the standard deviation of the mean. 202
Activity Ratio by LS Standard Addition
203
A LS standard addition experiment was performed using a series of counting sources prepared as 204
scintillation cocktails that contain mixtures of SRM 4328C and the 229Th RM in varying 205
proportions (Table 3). A total of five standard addition LS sources were prepared using the 206
Ecosint scintillation solution. Aliquots of both SRM 4328C and the 229Th RM were added to 207
each source but source preparation was, otherwise, as previously described. The LS counting 208
rate (Rc) for the mixtures of the SRM 4328C, with massic activity (AS), and the 229Th RM, with
209
massic activity (AX), can be given by
210
( ) (1)
211
where mS and mX are the respective aliquot masses of the two solutions in the cocktail and where
212
is the overall 229Th decay chain detection efficiency for the mixture in matched cocktails.
213
Simple rearrangement, by normalization of each term in Eq. (1) by mS, yields a linear function
214
( ⁄ ) (2)
215
with intercept AS and slope AX. From a series of matched counting sources with rates Rc for
216
varying mS and mX, a linear fit of Rc /mS as a function of mX /mS will determine slope and
217
intercept parameters whose ratio gives AX/AS. Additionally, the linear equation, in two
218
independent variables of Eq. (1), can be fit by multiple regression to yield AS and AX directly.
219
The two calculational approaches give identical results, though extraction of the covariance 220
between AS and AX from the covariance matrix is easier with multiple regression.
221
Ten (10) replicate measurements of the five sources were made in both Counter B and Counter 222
H. The counting rates for the sources integrated over the entire LS spectrum ranged from about 223
520 s-1 to 950 s-1. So, a duration of 3600 s was used for the measurements in order to accumulate 224
approximately 1.9 106 to 3.4 106 integral counts in each spectrum (corresponding to relative 225
Poisson counting statistics of about 0.07 % to 0.05 % for each of the 10 measurements). 226
227
Table 3 Standard Addition Source Preparation Details and Characteristics. Mass values have a
228
standard uncertainty of < 0.01 %. H# is a quench indicating parameter (as measured in Counter B 229
for n = 10 replications) which is an additional indicator of the close composition matching. The 230
values in parentheses represent the numerical values of the standard deviation of the mean for the 231
quoted H#. 232
233
Results for LS Standard Addition Measurement
234
The standard deviation of the mean for the average of the 10 replicate measurements of a source 235
on Counter B ranged from 0.25 % to 0.37 %, and from 0.060 % to 0.083 % on Counter H. 236
Multiple regressions of the Counter B and Counter H data sets for the Rc (mX, mS)
two-237
independent-variable function of Eq. (3) were performed with the LAB Fit code [19]. Table 4 238
summarizes the results of these regressions. The ratio AX/AS was obtained from the fitted
239
parameters AX and AS and its relative standard deviation was computed from
240 [ ( ) ( ) ] (3) 241
where SX and SS are the standard deviations on AX and AS, respectively, and where SXS is the
242
covariance between AX and AS (refer to Table 4). The reduced 2 values for the two regressions
243 Source ID Mass of Scintillant (g) Mass of 229Th RM Aliquot (g) Mass of SRM 4328C Aliquot (g) Mass of Blank HNO3 (g) Total Mass Cocktail (g) faq (%) H# 2 SA1 13.5365 0.076775 1.697757 0 15.3669 11.54 123.5 (5) SA2 13.5657 0.201698 1.304430 0.2647 15.3962 11.50 123.2 (4) SA3 13.5808 0.348458 0.995254 0.4289 15.416 11.50 123.6 (4) SA4 13.5832 0.476746 0.600704 0.6948 15.4124 11.50 122.9 (4) SA5 13.5711 0.632714 0.327851 0.8073 15.4002 11.48 123.1 (3)
for = 3 degrees of freedom were 3.1 and 0.61, with corresponding percentile points of p = 244
0.024 and p = 0.61 for Counters B and H data, respectively. 245
246
Quantities Counter B Counter H
AX 1347.9 1369.4 AS 245.57 249.98 SX2 0.08892 0.6583 SS2 0.008953 0.03474 SXS -0.01646 -0.07668 AX / AS 5.4888 5.4780 S 0.0030 0.0067
Grand Mean Massic Activity Ratio 5.4834 Standard Deviation 0.0087
Table 4 Standard Addition Activity Ratio Measurement Results. The fitted parameters AX and
247
AS are for the 229Th RM and SRM 4328C solutions, respectively, with corresponding variances
248
SX2 and SS2 and covariance SXS. The estimator S is the propagated standard deviation of the AX /
249
AS massic activity ratio.
250 251
252
Isotope Dilution Alpha Spectrometry
253The massic activity of the 229Th RM was measured on five subsamples that were prepared for 254
IDAS from a single unit of the reference material. This measurement method is independent of 255
the three activity ratio methods and is not reliant upon comparison with SRM 4328C. The IDAS 256
analysis is a nuclide-specific measurement of 229Th activity so any perturbation of the radioactive 257
equilibrium of the decay chain for the isotope will not bias the measurement results. 258
Accordingly, the analyses represent a robust verification of massic activity calculated from the 259
previously described relative activity measurements. 260
The IDAS analysis samples were prepared by transferring aliquots of the SRM 4342A 230Th 261
activity standard to 5 separate beakers as an isotope dilution spike, followed by aliquots of the 262
229Th RM (Table 5). The masses of the SRM 4342A and 229Th RM aliquots were measured by
263
difference on XP 205 balance (Mettler, Toledo USA). Approximately 2 mL of 0.4 mol L-1 264
NaHSO4 (Fisher Scientific, Hampton, NH) and 2 mL 2 mol L-1 HNO3 were also added to sample
265
beakers which were then refluxed on a hotplate for roughly 1 hour. Additional 2 mol L-1 HNO3
266
was added to each beaker, as necessary, to yield 10 mL of solution in preparation for ion 267
exchange separation using UTEVA resin (Eichrom Technologies, Chicago, USA). Prior to 268
loading, approximately 1 mg of Zr in a 4 mol L-1 nitrate solution (SPEX Industries, Metuchen, 269
NJ) was added to each sample to assist in the recovery of Th from the UTEVA columns. The Th 270
was eluted from the columns into a beaker using 20 mL of 6 mol L-1 HCl. Approximately 1 mL 271
concentrated H2SO4 was added to the samples to break down any organic compounds that may
272
have washed through the UTEVA column during elution and the solution was heated until the 273
sulfuric acid was completely fumed off. Once dry, the samples were cooled and then re-274
dissolved in 10 mL of 2 mol L-1 HNO3. Preparation of the samples for counting on the alpha
275
spectrometer entailed co-precipitation of the Th with ≈50 µg of NdF3, (Lindsay Rare Earth
276
Chemicals, West Chicago, IL) in 1 mol L-1 HCL and collection of the sample on a 0.1 µm 277
Metricel filter (Pall Corp. Baltimore, USA). The α-decays from 230Th and 229Th were counted 278
for approximately 106 seconds on anOrtec Octete alpha spectrometer (Ortec, Oak Ridge, USA) 279
with silicon detectors. The measured α activities for 230Th and 229Th were corrected for peak 280
tailing, background, and decay probability. The ratio of the corrected activities in conjunction 281
with the known aliquot weights were then used to calculate the 229Th massic activity using a 282
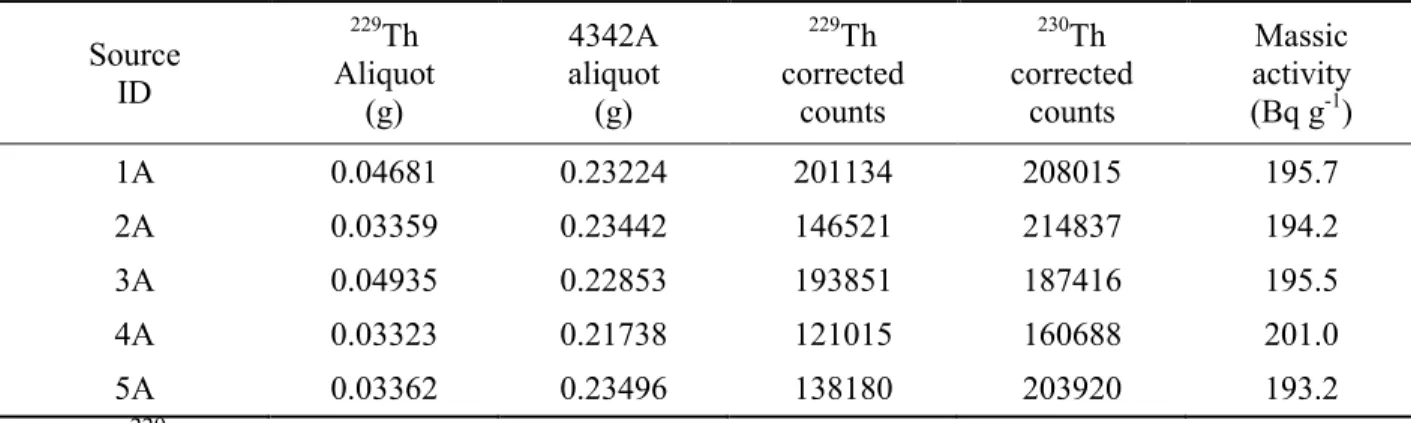
standard isotope dilution algorithm. 283 284 Source ID 229Th Aliquot (g) 4342A aliquot (g) 229Th corrected counts 230Th corrected counts Massic activity (Bq g-1) 1A 0.04681 0.23224 201134 208015 195.7 2A 0.03359 0.23442 146521 214837 194.2 3A 0.04935 0.22853 193851 187416 195.5 4A 0.03323 0.21738 121015 160688 201.0 5A 0.03362 0.23496 138180 203920 193.2
Table 5 229Th IDAS sample data. Mass values have a relative standard uncertainty of 0.3 %. 285
Results from IDAS
286
The combined IDAS measurement data indicate a 229Th massic activity of (195.9 ± 3.2) Bq g-1 (k 287
= 2) for a measurement date of March 5, 2012. The uncertainty of the measured value is 288
dominated by the variability of the replicate massic activity measurements (Table 6) with the 289
uncertainty for solution masses, the SRM 4342A tracer, and peak tail corrections representing 290
minor contributions. 291
292
Component Comment Type ui %
Massic Activity Standard uncertainty of replicate IDAS measurements of 229Th massic activity A 0.69
Weighing Estimated relative uncertainty for potential bias in mass of IDAS solution aliquots B 0.30 Peak Tail Estimated uncertainty of
229Th peak tail
correction applied to the α count data B 0.21
230Th Spike Combined standard uncertainty of the massic
activity for SRM 4342A B 0.20
Background Estimated uncertainty of
229Th and 230Th
Relative combined standard uncertainty (uc) 0.81 % 229Th Massic Activity (Bq g-1) Expanded Uncertainty (Bq g-1)
195.9 3.2 (Relative: 1.6 %)
Table 6 Uncertainty Budget for 229Th massic activity by IDAS. The uncertainty estimate for the 293
half-life was calculated in accordance with Taylor and Kuyatt, [20] and GUM protocols [21] 294
using the GUM Workbench software [22].ui % represents the relative standard uncertainty for
295
the listed components.The expanded uncertainty (U = k uc) for the massic activity value is the
296
product of the combined standard uncertainty (uc) and a coverage factor (k), with k = 2 to achieve
297
an approximately 95 % level of confidence. 298
Discussion
299The physical and analytical linkages between the M solution, SRM 4328C, and the 229Th RM 300
allow for the measurement of the 229Th RM massic activity through a direct comparison to SRM 301
4328C (Fig. 2). The three counting methods used to measure the activity ratios of the 229Th RM 302
and SRM 4328C should yield the same values, within uncertainties. Results from the LS and 303
NaI(Tl) relative counting methods are consistent among all three counters and both scintillation 304
cocktails used to prepare the sources (Table 2). The LS standard additions results are also 305
consistent for both LS counters (Table 4) but the relative difference between the standard 306
addition and the relative counting methods (δ) is 0.7 %, while the relative standard deviation for 307
the results of the two standard addition measurements are both approximately 0.16 %. No clear 308
explanation for the apparent discrepancy between the AX / AS ratio for the methods has been
309
identified. Firstly, the composition matching of the five standard addition sources dictated nearly 310
identical detection efficiencies across the series. Secondly, the quality of the fits, as reflected in 311
the adjusted R2, reduced 2, and F-values (for ANOVA ratio of variances), suggests that there 312
should have been better agreement. The 95.4 % coverage factor on the standard deviation SX and
313
SS for AX and AS is k = 3.31, such that the expanded relative uncertainties kS on AX / AS of 0.18 %
314
and 0.40 % are roughly a factor of 2 to 3 smaller than the from the AX / AS ratio. In the absence
315
of identifiable analytical problems for the three activity ratio measurement methods, the overall 316
mean values for each method were averaged to yield a combined activity ratio (AX /AS)c of 5.510
317
with a standard uncertainty of 0.026. This standard uncertainty is calculated by adding, in 318
quadrature, two variance components. These components are the within-method variability, 319
represented by the typical standard deviation of the mean for the great-grand-means multiplied 320
by the Student’s T distribution for 2 degrees of freedom (n = 3 measurement methods), and the 321
between-method variability represented by the standard deviation of the 3 activity ratio values. 322
323
Fig. 2 Schematic of material and analytical linkages between the M solution, SRM 4328C, and
325
the 229Th RM. Bold arrows indicate the activity measurement linkages. The lighter arrow 326
indicates direct production of the 229Th RM from the M solution. Activity values shown in the 327
figure are for the December 31, 2007 reference date of the massic activity value of the M 328
solution. All uncertainties are combined standard uncertainties. 329
As previously described, the inverse ratio of dilution factors (DS / DX) for the two reference
330
materials should be identical to the 229Th activity ratio, representing an independent confirmation 331
of the measured ratio. Although the dilution factor for the 229Th RM is an approximation, a 332
calculated DS / DX of 5.511 is essentially indistinguishable from the measured activity ratio value
333
indicating the measured ratio is consistent with the values expected based on preparation of the 334
reference material from the M solution. 335
The massic activity of the 229Th RM solution (AX) can be calculated (Eq. 4) from the combined
336
activity ratio (AX / AS)c, as described above, and the measured activity of the M solution (Am) and
337
the dilution factor for production of SRM 4328C stock solution (DS), as reported in [17].
338
( ⁄ )
(4) 339
The resulting massic activity value for the 229Th RM is (194.4 ± 1.1) Bq g-1. For comparison, the 340
229Th massic activity measured by IDAS can be corrected to the reference date for SRM 4328C
341
(December 31, 2007). The resulting massic activity value is 196.0 Bq g-1 with an expanded 342
uncertainty of 3.2 Bq g-1 (k = 2). The relative difference between the activity measurements is 343
0.8 % which is well within the 1.6 % relative uncertainty of the IDAS measurement. 344
The massic activity from Eq. 4 (AX) and the 229Th molality (bX) of (0.11498 ± 0.00008) nmol g-1,
345
as measured for the 229Th RM in [18], can then be used to calculate a decay constant (λ) for 229Th 346
but a decay correction for the (4.7 ± 0.25) year interval between the reference dates for the 347
massic activity and the molality measurements (t) must also be incorporated into the calculation 348 (Eq. 5). 349
(5) 350
Where L is the Avogadro’s Constant. This function is solved for the decay constant by numerical 351
iteration, which converges rapidly because of the small magnitude of the exponential term. A 352
half-life (T) is then calculated from the decay constant (Eq. 6). 353
( )
(6)
354
The best-fit decay constant for the 229Th data is 8.858 10-5 a-1 with a combined standard 355
uncertainty of 0.049 10-5 a-1 which corresponds to a half-life and expanded uncertainty of (7825 356
± 87) years (k = 2).The uncertainty for the half-life determination is dominated by components 357
from the M solution activity measurement and the measured activity ratio for the 229Th RM (see 358
Table 7). The uncertainties for the measured molality of the 229Th RM solution, the SRM 4328C 359
dilution factor, and the decay interval between the SRM reference date and the 229Th molality 360
measurements represent minor contributions to the overall uncertainty for the half-life. 361
362
Component Comment Type ui %2
Activity Ratio Standard uncertainty of combined activity ratio
measurements from this study A 0.48
LTAC 229Th Activity Standard Uncertainty of the M solution massic activity B 0.28
229Th Molality Combined standard uncertainty of the measured
229Th molality B 0.07
Dilution Factor Standard uncertainty of the dilution factor for production of SRM 4328C from the M solution B 0.03 Decay Interval Relative uncertainty associated with the interval between the M solution reference date and
molality measurements
Relative combined standard uncertainty (uc) 0.56 % 229Th Half-life (a) Expanded Uncertainty3 (a)
7825 87 (Relative: 1.1 %)
Table 7 Uncertainty budget for 229Th half-life determination. The uncertainty estimate for the 363
half-life was calculated in accordance with Taylor and Kuyatt, [20] and GUM protocols [21] 364
using the GUM Workbench software [22].ui % represents the relative standard uncertainty for
365
the listed components.The expanded uncertainty (U = k uc) for the half-life value is the product
366
of the combined standard uncertainty (uc) and a coverage factor (k), with k = 2 to achieve an
367
approximately 95 % level of confidence. 368
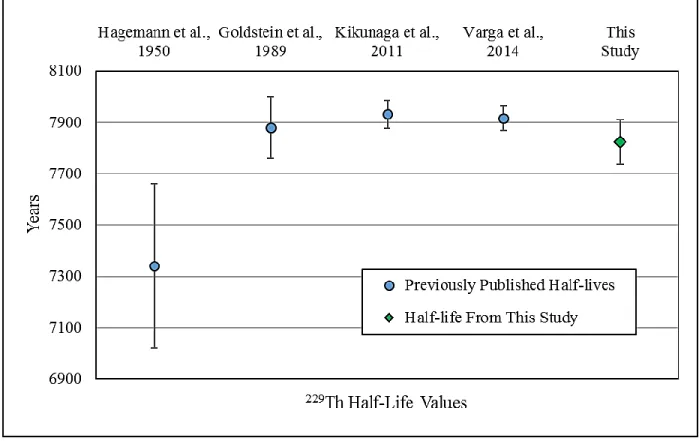
The 229Th half-life measured in this study is largely consistent with previous determinations (Fig. 369
3) with the exception of the first published half-life for the isotope presented in Hagemann et al. 370
[1]. As previously discussed, the value from Hagemann et al. is significantly shorter than 371
subsequent half-life measurement and is probably erroneous. The present half-life measurement 372
is consistent with the published half-life reported by Goldstein et al. [14] but is only marginally 373
consistent with the values of Varga, et al. [16] and Kikunaga et al. [15] as indicated by 374
overlapping expanded uncertainty envelopes. Pommé [23] noted that discrepancies between half-375
life measurements for the same nuclide are common and speculated that a major cause for the 376
apparent differences is underestimated measurement uncertainty. It is not possible to assess the 377
uncertainty cited by Hagemann et al. [1] and the uncertainty cited by Goldstein et al. [14] 378
appears to be reasonably conservative. The uncertainty of the half-lives from Kikunaga et al. 379
[15] and Varga et al. [16], however, may be underestimated. 380
381
382
Fig. 3 Reported half-lives for 229Th. Error bars are expanded uncertainties (k = 2). 383
Kikunaga et al. measured the half-life by an indirect method based on known ingrowth periods 384
for Th in a high purity 233U material that also contains a small proportion of 232U. In their study, 385
the measured α count ratios of A(233U)/A(232U) and A(229Th)/A(228Th) and the half-lives of 232U 386
and 228Th were used to calculate a 229Th half-life without the necessity of measuring the absolute 387
amount or activity for the nuclide. Accordingly, their calculations are highly sensitive to the 388
228Th half-life and the measured 229Th to 228Th count ratio, for which they indicate an average
389
uncertainty of 0.2 %. The 228Th half-life appears to be well constrained [21], and Kikunaga, et 390
al. addressed potential sources for significant bias in their data such as corrections for
391
background and interferences in the α spectra. However, the combined alpha spectra for 229Th 392
and 228Th are complex and there is potential that their choice of region-of-interest for the 393
nuclides, the magnitude of applied corrections, and/or uncertainties in decay data for the nuclides 394
could result in a bias that is not covered by the 0.15 % relative “systematic” uncertainty cited for 395
their measurements. 396
Varga et al. [13] provided detailed uncertainty budgets for each of the measurement methods 397
used for their half-life determination (Methods A and B). The uncertainties for each method is 398
dominated by the Type B uncertainties for SRM 4328C massic activity. Three replicates of the 399
229Th molality measurement were performed for each method but no variability component
400
associated with the replicate IDMS measurements was specified. Varga et al. then combined the 401
two measured half-lives to obtain a weighted mean value of 7917 years with an expanded 402
uncertainty of only 48 years (k = 2), despite a 63 year difference in the half-lives for the two 403
methods. It appears that the combined measurement uncertainty did not incorporate a 404
component for the variability evident between measurement methods and it is unclear whether 405
the type B uncertainty components shared by the methods were appropriately propagated. 406
Conclusion
407A new measured half-life of (7825 ± 87) years (k = 2) is reported for 229Th. This value is based 408
on the previously determined 229Th molality of a new thorium IDMS reference material and the 409
detailed characterization of the massic activity value for the reference material, presented here. 410
The measured massic activity is tied directly to the SRM 4328C activity standard through 411
multiple replicate activity ratio measurements using three independent methods and was also 412
independently confirmed by IDAS measurements. This new 229Th half-life measurement is 413
between 0.7 % and 1.4 % shorter than other modern half-life determinations but is otherwise 414
consistent with these values (overlapping uncertainties at the 95 % level of confidence). 415
Acknowledgements
416
Project activities at NIST were supported by the United States Department of Homeland 417
Security. 418
References
4191. Hagemann F, Katzin L I, Studier M H, Seaborg G T, Ghiorso A (1950) The 4n + 1 420
radioactive series: The decay products of U233*. Phys Rev. 79(3):435-443 421
2. de Lavison P, Husband L J, Jerome S M, Keightley J D, Woodman A P, Woods D H, 422
Woods S A (2000) The standardization of the 229Th for an environmental yield tracer. Appl 423
Rad Iso. 53:243-249 424
3. Aggarwal S K (2016) A review on the mass spectrometric analysis of thorium. Radiochim 425
Acta, 104 (7):445-456. 426
4. Apostolidis C, Molinet R, Rasmussen G, Morgenstern A (2005) Production of Ac-225 from 427
Th-229 for targeted alpha therapy. Anal Chem. 77:6288-6291 428
5. Campbell C J, Radnaev A G, Kuzmich A, Dzuba V A, Flambaum V V, Derevianko A 429
(2012) A Single-Ion Nuclear Clock for Metrology at the 19th Decimal Place. Phys Rev 430
Lett. 108 (120802):1-5 431
6. Lamont S P, Hall G J (2005) Uranium age determination by measuring the 230Th/234U ratio. 432
Radioanal Nuc Chem. 264:423-427 433
7. Williams R W, Gaffney A M (2011) 230Th-234U model ages of some uranium standard 434
reference materials. Proc Radiochim Acta, 1:31-35 435
8. NBS (1984) Standard Reference Material 4328 Radioactivity Standard, National Bureau of 436
Standards, Gaithersburg, MD, certificates available at https://www.nist.gov/srm 437
9. NIST (1995) Standard Reference Material 4328A Thorium-229 Radioactivity Standard, 438
National Institute of Standards and Technology, Gaithersburg, MD, certificate available at 439
https://www.nist.gov/srm 440
10. NIST, (1996) Standard Reference Material 4328B Thorium-229 Radioactivity Standard, 441
National Institute of Standards and Technology, Gaithersburg, MD, certificate available at 442
https://www.nist.gov/srm 443
11. NIST (2008) Standard Reference Material 4328C Thorium-229 Radioactivity Standard, 444
National Institute of Standards and Technology, Gaithersburg, MD, certificate available at 445
https://www.nist.gov/srm 446
12. Tuli J K (2011) Nuclear Wallet Cards, Nation Nuclear Data Center, 447
https://www.nndc.bnl.gov. Accessed 1 Jan 2018 448
13. BIPM (2013) Monograph 5: Table of Radionuclides, 7-A:14-245. 449
14. Goldstein S J, Murrell M T, Williams R W (1989) Half-life of 229Th. Phys Rev C. 40(6): 450
2793-2795. 451
15. Kikunaga H, Suzuki T, Nomura M, Mitsugashira T, Shinohara A (2011) Determination of 452
the half-life of the ground state of 229Th by using 232U and 233U decay series. Phys Rev C. 453
84 (014316): 1-6 454
16. Varga Z, Nicholl A, Mayer K, (2014) Determination of the 229Th half-life. Phys Rev C. 89 455
(064310): 1-6 456
17. Fitzgerald R, Collé R, Laureano-Pérez L, Pibida L, Hammond M M, Nour S, Zimmerman 457
B E (2010) A new primary standardization of 229Th. Appl Radiat Iso. 68:1303-1308 458
18. Essex R M, Mann J L, Williams R W, Kinman W S, Hubert A, Bennett M E, Alkiviadias G 459
(2018) A new thorium-229 reference material. Appl Rad Iso. 134:23-31 460
19. da Silva W, da Silva C P (2011) Lab Fit Curve Fitting Software. Universidade Federal de 461
Campina Grande, Campina Grande, Brazil, zeus.df.ufcg.edu.br/labfit/. 462
20. Taylor B N, Kuyatt C E (1994) Guidelines for Evaluating and Expressing the Uncertainty 463
of NIST Measurement Results: NIST Technical Note 1297. National Institute of Standards 464
and Technology, Gaithersburg, MD 465
21. JCGM (2008) Evaluation of measurement data — Guide to the expression of uncertainty in 466
measurement. JCGM 100, (E/F). 467
22. Metrodata GmbH, (2009) GUM Workbench. Weil am Rhein, Germany. 468
23. Pomme S (2015) The uncertainty of the half-life. Metrologia, 52:S51-S65. 469