HAL Id: hal-00298633
https://hal.archives-ouvertes.fr/hal-00298633
Submitted on 11 Apr 2005HAL is a multi-disciplinary open access
archive for the deposit and dissemination of sci-entific research documents, whether they are pub-lished or not. The documents may come from teaching and research institutions in France or abroad, or from public or private research centers.
L’archive ouverte pluridisciplinaire HAL, est destinée au dépôt et à la diffusion de documents scientifiques de niveau recherche, publiés ou non, émanant des établissements d’enseignement et de recherche français ou étrangers, des laboratoires publics ou privés.
Hydrogeomorphic controls on runoff in a temperate
swamp
S. C. Kaufman, J. M. Waddington, B. A. Branfireun
To cite this version:
S. C. Kaufman, J. M. Waddington, B. A. Branfireun. Hydrogeomorphic controls on runoff in a temperate swamp. Hydrology and Earth System Sciences Discussions, European Geosciences Union, 2005, 2 (2), pp.483-508. �hal-00298633�
HESSD
2, 483–508, 2005 Hydrogeomorphic controls on runoff in a temperate swamp S. Kaufman et al. Title Page Abstract Introduction Conclusions References Tables Figures J I J I Back CloseFull Screen / Esc
Print Version Interactive Discussion
EGU Hydrol. Earth Sys. Sci. Discuss., 2, 483–508, 2005
www.copernicus.org/EGU/hess/hessd/2/483/ SRef-ID: 1812-2116/hessd/2005-2-483 European Geosciences Union
Hydrology and Earth System Sciences Discussions
Hydrogeomorphic controls on runo
ff in a
temperate swamp
S. C. Kaufman1, J. M. Waddington1, and B. A. Branfireun2
1
McMaster University, School of Geography and Geology, 1280 Main Street West, Hamilton, Ontario L8S 4K1, Canada
2
University of Toronto at Mississauga, Department of Geography, 3359 Mississauga Road North, Mississauga, Ontario L5L 1C6, Canada
Received: 7 March 2005 – Accepted: 16 March 2005 – Published: 11 April 2005 Correspondence to: J. M. Waddington ([email protected])
HESSD
2, 483–508, 2005 Hydrogeomorphic controls on runoff in a temperate swamp S. Kaufman et al. Title Page Abstract Introduction Conclusions References Tables Figures J I J I Back CloseFull Screen / Esc
Print Version Interactive Discussion
EGU
Abstract
Beverly Swamp, a high-order forested temperate wetland near Hamilton, Ontario was studied during wet (2000) and dry (2001) summer seasons to determine and compare runoff pathways and storage mechanisms in two hydrogeomorphically different basins. A channelized (Fletcher Swamp) and an unchannelized (Spencer Swamp)
sub-5
basin were examined. During wet periods, the Fletcher Swamp displayed a consistent interaction between the wetland and stream, resulting in a gaining stream, maintain-ing a lateral hydrological connection and yieldmaintain-ing high runoff ratios. When dry periods dominated, water tables dropped low enough in the Fletcher Swamp such that water moved from the stream channel into the underlying substrate, creating a lateral
hydro-10
logical disconnection between the stream and wetland. This disconnection reduced runoff ratios during storm events. The Spencer Swamp, with no well-defined stream channel, relied on overland flow and a longitudinal hydrological connection to deliver water to the sub-basin outflow. This connection was maintained in the wet season (2000) but ceased in the dry season (2001) despite consistent inputs from an upstream
15
reservoir. Available depression storage prevented overland flow during 2001, and al-though a shallow groundwater flux maintained discharge for a period of time, drought conditions led to zero discharge at the sub-basin outflow in mid-summer. Runoff ratios were reduced dramatically from season to season as a result of this disconnection. Implications of these hydrogeomorphic runoff controls on wetland biogeochemistry are
20
discussed.
1. Introduction
Wetland geomorphology and hydrology are tightly coupled. Not only have hydrologi-cal flowpaths and runoff regimes been linked to wetland development and formation of microtopographical features (e.g. Damman, 1986; Swanson and Grigal, 1988) but the
25
hydro-HESSD
2, 483–508, 2005 Hydrogeomorphic controls on runoff in a temperate swamp S. Kaufman et al. Title Page Abstract Introduction Conclusions References Tables Figures J I J I Back CloseFull Screen / Esc
Print Version Interactive Discussion
EGU logic flowpaths (e.g. Taylor, 1982; Quinton and Roulet, 1998). Moreover, changes in
the ability of a wetland to retain moisture occur on the scale of water table movement (Price and Schlotzhauer, 1999), and therefore the quantity of water that moves beyond the boundaries of the wetland are inherently linked to the hydrogeomorphic processes within that wetland.
5
Bullock and Acreman (2003) showed that wetlands can influence regional water bud-gets but are not consistent in their recharge/discharge functions. This is a good indica-tion that for the management of downstream water resources, an understanding of the processes occurring within the wetland under various hydroclimatic conditions must be considered. For example, the water flux through a wetland basin is affected by the
10
antecedent conditions in groundwater position and soil moisture as well as inter- and intra-climatic variability (Woo, 2002). As such, the view that wetlands are water storage reservoirs and flood attenuators (Mitsch and Gosselink, 1986) is subject to changes in hydrological conditions over time (e.g. Woo and Valverde, 1981).
The majority of the research in wetlands has been focused on first-order
(headwa-15
ter) systems, where water inputs are controlled by groundwater and precipitation (e.g. Price and FitzGibbon, 1987; Roulet, 1990, 1991; Waddington et al., 1993). Higher order wetlands, including some swamps, have surface water input(s) that often exceed groundwater or precipitation contributions (e.g. Jacks and Norrstrom, 2004; Casey and Klaine, 2001), and also exhibit highly variable water table levels (e.g. Devito and Hill,
20
1997; Woo, 2002) along with dynamic stream-wetland interactions (Woo and Valverde, 1981). However, there is a paucity of work on seasonal or interannual variability in hydrology of these geomophically complex and heterogeneous systems. Given the importance of the relationship between hydrology and geomorphology, and their in-herent influence on water quantity beyond the wetland boundaries, there is a need
25
to better understand these interactions on a timescale that includes climatically vari-able conditions. This study, therefore, investigates 1) the hydrogeomorphic controls on streamflow through a temperate forested swamp and 2) changes in water flux, flow paths and groundwater-surface water interactions between a wet and a dry summer.
HESSD
2, 483–508, 2005 Hydrogeomorphic controls on runoff in a temperate swamp S. Kaufman et al. Title Page Abstract Introduction Conclusions References Tables Figures J I J I Back CloseFull Screen / Esc
Print Version Interactive Discussion
EGU
2. Study area
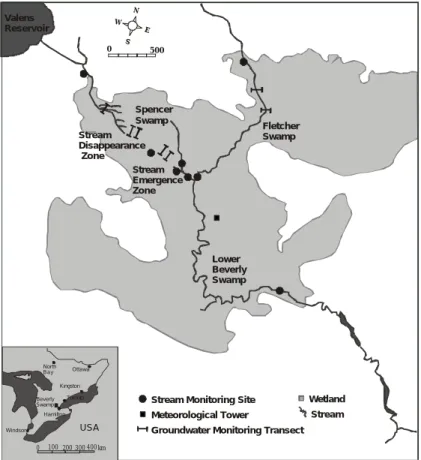
This study was undertaken from 1 May to 31 October 2000 and 2001 at Beverly Swamp (43◦220N, 80◦070W), one of the largest temperate wetlands in southern Ontario. Lo-cated approximately 40 km northwest of Hamilton, Ontario (Fig. 1), the swamp covers ∼10 km2 in area, ranges in elevation from 265 to 270 m and is surrounded primarily
5
by agricultural land. The mean annual air temperature at the wetland is 7.6◦C, and 30-year average summer precipitation (1 May – 31 October) is 480 mm (Environment Canada, 2005). Warren et al. (2001) found that evapotranspiration from the site was ∼580 mm between early May and late September during a drought season.
The peat in Beverly Swamp is variable in depth, ranging from 0.3 to 1.5 m (Woo and
10
Valverde, 1981) and consists of mainly well decomposed woody peat. The canopy veg-etation of the swamp is dominated by white cedar (Thuja occidentalis), tamarack (Larix
laricina) and aspen (Populus tremuloides) in the northern sections, and red maple
(Acer rubrum), birch (Betula papyifera) and aspen (Populus tremuloides) in the cen-tral and southern reaches. The canopy is dense during peak growth season with an
15
average standing biomass of 18.4 kg m−2across the swamp (Munro et al., 2000). Surface water inputs to Beverly Swamp are from two 2nd order streams, Fletcher and Spencer Creeks. Each of the distinct inflows merge at a confluence in the centre of the wetland and continue downstream in the larger Spencer Creek (Fig. 1). Fletcher Creek enters in the northeast section of the swamp and flows in a well-defined channel
20
to the confluence (3.1×10⁶m2). This sub-basin is hereafter referred to as the ‘Fletcher Swamp’. In contrast Spencer Creek, which enters the swamp in its northwest, is regu-lated by an upstream constructed reservoir. Spencer Creek is channelized as it enters the swamp but subsequently branches into small unconfined streams where during dry periods surface flow is not evident. This location is referred to as the “stream
disap-25
pearance zone”. Spencer Creek re-emerges and once again becomes a channel just upstream of the confluence and we refer to this location as the “stream emergence zone”. The section of the wetland from the Spencer inflow to the Spencer confluence
HESSD
2, 483–508, 2005 Hydrogeomorphic controls on runoff in a temperate swamp S. Kaufman et al. Title Page Abstract Introduction Conclusions References Tables Figures J I J I Back CloseFull Screen / Esc
Print Version Interactive Discussion
EGU is hereafter referred to as the “Spencer Swamp” (1.7×10⁶m2). Downstream of the
con-fluence, Spencer creek flows through a section of the wetland that we refer to as the “Lower Beverly Swamp” (5.2×10⁶m2). Downstream of Beverly Swamp, the Spencer Creek flows through predominantly agricultural areas as well as the town of Dundas and into the Cootes Paradise marsh on west end of Lake Ontario.
5
3. Materials and methods
Six monitoring and sampling sites were established in Beverly Swamp: a centrally-located meteorological tower, both catchment surface water inflows, both sub-basin outflow sites and the swamp outflow in 2000 (Fig. 1). Monitoring and sampling was expanded in 2001 to include the stream disappearance and stream emergence zones.
10
Stream discharge was measured at both swamp inflows, both sub-basin outflows and the swamp outflow, and at each of the two streamlets in the emergent stream zone. Stream stage was measured every half hour with Keller pressure transducers or electronic water level float sensors connected to Campbell Scientific dataloggers. Discharge measurements were made at various stages using the velocity-area method.
15
Velocity measurements were made with a Marsh-McBirney current meter.
Water table position was monitored at least weekly with groundwater wells (5.1 cm ID perforated ABS pipe) installed to a depth of 75 cm at 40 locations in the swamp (Fig. 1). As well, piezometer nests (depths of 25, 50, 100, 150 and 200 cm) were installed at five sampling sites (Fig. 1). Each piezometer was made from 2.5 cm PVC pipe with
20
a 15 cm slotted tip. All wells and piezometers were covered with nylon screening to prevent sediment intrusion and clogging. Water levels in wells and piezometers were measured using an electronic sensor (error ±2 mm) on a weekly basis, and more frequently following rainfall events.
Precipitation was measured using Texas Electronic tipping bucket rain gauges
con-25
nected to dataloggers at the Spencer Swamp outflow. A one-tailed t-test revealed that these two automatic gauges did not reveal significant differences in precipitation
HESSD
2, 483–508, 2005 Hydrogeomorphic controls on runoff in a temperate swamp S. Kaufman et al. Title Page Abstract Introduction Conclusions References Tables Figures J I J I Back CloseFull Screen / Esc
Print Version Interactive Discussion
EGU (p<0.005).
In-stream measurements of dissolved oxygen and electrical conductivity were made using in situ probes connected to dataloggers. The probes were calibrated and cleaned every two weeks. Additional manual measurements were made with a YSI multiprobe sonde every two weeks as a cross-check for continuous measurements (see Galloway
5
and Branfireun, 2004).
4. Results
4.1. Temporal variability in precipitation, streamflow, and stream chemistry
Total study season (1 May – 31 October) precipitation was 344 and 304 mm in 2000 and 2001, respectively (Fig. 2a). Both these values are below the 30-year average for
10
this region, and reflect some canopy interception within the swamp. In 2000, 94% of the total precipitation for the study period occurred between 1 June and 30 September (323 mm), whereas only 56% (169 mm) of the total precipitation for the study period occurred during this period in 2001. In 2000, hereafter referred to as the wet summer, a maximum of nine days passed without precipitation; whereas 2001, hereafter referred
15
to as the dry summer, had a period of 15 successive days without rain. In order to highlight the spatiotemporal variability within Beverly Swamp each sub-basin within the swamp (Fletcher, Spencer, Lower Beverly) will be discussed separately.
Inflow discharge to the Fletcher Swamp decreased 54% from an average 300 L s−1 in the wet year to 140 L s−1in the dry summer of 2001 (Fig. 2b) and was mirrored by an
20
interannual 54% decrease (from 270 L s−1to 130 L s−1) at the Fletcher Swamp outflow. Under rainfall conditions, 24 rainfall events in 2000 produced a total of 108.3 mm of storm runoff through Fletcher Swamp in 2000 (Table 1). These events produced an average of 38% runoff (r) and an average stormflow recession (k) of 0.94 (Table 1). In 2001, twenty storms produced 66.7 mm of runoff, and average the runoff ratio fell to
25
HESSD
2, 483–508, 2005 Hydrogeomorphic controls on runoff in a temperate swamp S. Kaufman et al. Title Page Abstract Introduction Conclusions References Tables Figures J I J I Back CloseFull Screen / Esc
Print Version Interactive Discussion
EGU Inflow discharge values measured at the Spencer Swamp were influenced by the
upstream Valens dam and reservoir. In 2000, the dam remained open for most of the season since adequate rainfall kept levels high within the reservoir and an average Spencer Swamp inflow of 90 L s−1 was recorded (Fig. 2c). During the dry summer of 2001 the dam was partially closed, lowering the average inflow discharge to 30 L s−1,
5
representing a 67% decrease (Fig. 2c). Discharge at the Spencer Swamp outflow was equivalent to the average inflow discharge value of 90 L s−1 (Fig. 2d) in 2000, but was decreased by 78% in the dry summer, to an average of 20 L s−1. This included 16 days where discharge at the Spencer Swamp outflow was zero. In addition, two streamlets within the stream emergence zone of the Spencer Swamp were monitored
10
during 2001. The more northern stream was dry for a full 61 days during the study season of 2001, and average discharge here was 3 L s−1. The southern stream in the emergence zone averaged 6 L s−1 and had zero discharge for a period of 18 days. Storm runoff in the Spencer Swamp during 2000 totaled 45.1 mm, less than half of that recorded in the Fletcher Swamp catchment. Despite this, runoff ratio values were
15
similar, averaging 39% (Table 2). Recession coefficients in the Spencer Swamp were similar to the Fletcher Swamp, with an average of 0.91 (Table 2). Runoff in the Spencer Swamp decreased 13% during 2001 to 39.1 mm. Storm runoff was reduced to an average of 17%, but k was similar during 2001 to the previous study season, averaging 0.86 (Table 2).
20
At the Lower Beverly Swamp outflow, the construction of a beaver dam between 23 August (day of year, doy=235) and 14 September (doy=257), 2000 created stage and discharge measurement problems, and was removed from all calculations. With these values removed, discharge averaged 700 L s−1 (Fig. 2d). During the dry 2001 study season, average flow decreased by 71% to 200 L s−1. The 30-year mean
sum-25
mer discharge at a site slightly downstream from this site is 350 L s−1 (Warren, 2000). Consequently, discharge at the Lower Beverly Swamp outflow was 200% above the 30-year mean in 2000 and 43% lower than the 30-year mean in 2001.
HESSD
2, 483–508, 2005 Hydrogeomorphic controls on runoff in a temperate swamp S. Kaufman et al. Title Page Abstract Introduction Conclusions References Tables Figures J I J I Back CloseFull Screen / Esc
Print Version Interactive Discussion
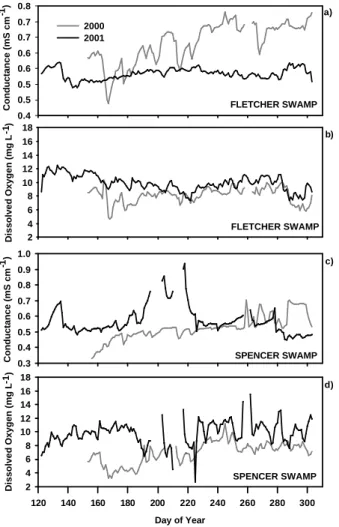
EGU 4.2. Surface water geochemistry
There were also large temporal differences in surface water geochemistry during the study. In the Fletcher Swamp, electrical conductivity (E C) was below 0.50 mS cm−1 each spring, and subsequently rose during the summer months (Fig. 3a). As well, while
E C during 2000 tended towards increasing values throughout the season, conductivity 5
remained relatively stable during 2001. For the overall study period, average E C was reduced from 0.63 in 2000 to 0.56 mS cm−1in 2001. In the Spencer Swamp, E C was not considerably different between years, with an average falling from 0.56 mS cm−1 in 2000 to 0.52 mS cm−1in 2001 (Fig. 3c). As well, E C showed greater peaks in response to rainfall during dry periods (throughout the dry season and following rain events in the
10
dry fall of 2000). For example, following a 14.3 mm h−1 rainfall on 2 August 2000 an initial depression of E C coincided with the hydrograph rising limb. This depression was more pronounced in the Fletcher Swamp and was followed by a gradual increase in E C to pre-storm levels (Table 1). During the dry study season (2001), this same pattern was repeated on a smaller scale in both the Fletcher Swamp (Table 1) and the Spencer
15
Swamp (Table 2).
In the Fletcher Swamp, dissolved oxygen (DO) increased from an average of 8.1 mg L−1 in 2000 to 9.9 mg L−1 in 2001 (Fig. 3b). Lower DO concentrations gen-erally indicate groundwater inputs (Manahan, 1994). DO corresponded well with
stream temperature within the Fletcher Swamp for the majority of the dry summer of
20
2001 (r2=0.81) but this relationship did not hold during fall re-wetting, after 4 October (doy=277) (r2=0.27), and did not exist for the entire wet summer of 2000 (r2=0.07). A strong relationship between water temperature and DO can indicate the predominance of surface water inputs through a system (Manahan, 1994). At the Spencer Swamp,
DO displayed a large increase between years, where a 2000 average of 6.9 mg L−1
in-25
creased 32% to 10.1 mg L−1in 2001 (Fig. 3d). A concentration of 10 mg L−1or greater was reached for only three days during 2000. This concentration represents a value close to that noted at the Spencer Swamp inflow in 2000 (Young, 2001). Unlike the
HESSD
2, 483–508, 2005 Hydrogeomorphic controls on runoff in a temperate swamp S. Kaufman et al. Title Page Abstract Introduction Conclusions References Tables Figures J I J I Back CloseFull Screen / Esc
Print Version Interactive Discussion
EGU Fletcher Swamp, during the dry study season, there was no relationship between
in-stream temperature and DO for the majority of the year, until the fall reservoir release (4 October, doy=277) and rewetting period, when a reasonable relationship emerged (r2=0.66). During stormflow, DO followed the pattern of EC. Baseflow concentra-tions were initially low during hydrograph rising limbs, with each storm exhibiting at
5
least a 2 mg L−1drop in DO concentrations within the first two hours of hydrograph rise (Table 2). Subsequently, concentrations rose to pre-storm levels during hydrograph recession.
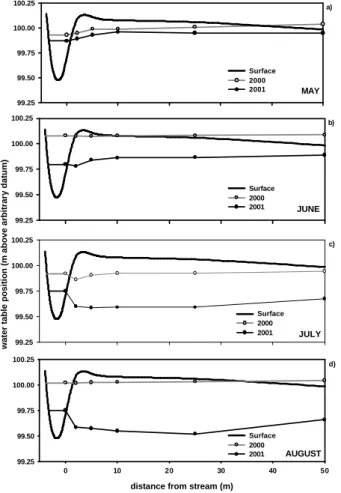
4.3. Water table position
In the Fletcher Swamp, water table position dropped dramatically between the wet and
10
dry summers. In June 2000, the water table was near the surface along the stream. However, in June of 2001 the water table had already fallen at least 10 cm below the surface (Fig. 4b). Water table position in July 2001 was between 20 and 50 cm lower than in the previous year (Fig. 4c) and in August, the water table position averaged nearly 50 cm deeper in 2001 than during 2000 (Fig. 4d).
15
The water table in the Spencer Swamp varied less with time but showed large spatial differences through the sub-basin. At the inflow transect, differences in summer water table position between the wet and dry years were minimal. During late spring, the water table was close to or above the ground surface in both 2000 (9.3 cm) and 2001 (−7.3 cm) (Fig. 5a). June water tables were essentially the same for both study seasons
20
(Fig. 5b). By July the water table had fallen below the surface in both summer seasons, although the position was 7.2 cm lower during the dry summer (Fig. 5c). Re-wetting occurred in August of both summers until the water table was once again above the surface (Fig. 5d). Between the Spencer Swamp inflow and outflow the water table stayed near the surface in the disappearance zone, but was responsive to wet and dry
25
HESSD
2, 483–508, 2005 Hydrogeomorphic controls on runoff in a temperate swamp S. Kaufman et al. Title Page Abstract Introduction Conclusions References Tables Figures J I J I Back CloseFull Screen / Esc
Print Version Interactive Discussion
EGU
5. Discussion
5.1. Wetland-stream interaction; Fletcher Swamp
In the Fletcher Swamp, the stream channel is deep and well defined. Water flows longitudinally towards the sub-basin outflow and is not impeded. Stream water levels control the movement of water into and out of the adjacent peat, resulting in the stream
5
alternating between gaining and losing regimes. Woo and Valverde (1981) noted that under dry conditions the Fletcher Swamp stream contributed water to the peat, while Warren (2000) determined that a sandy substrate below the peat could further enhance the water loss from the channel during drought. In this study, the stream was gaining water from the surrounding peat, via overland flow and groundwater movement
(gra-10
dient >0), as was the scenario for most of 2000 (Fig. 6). In this case a strong lateral connection with the surrounding wetland exists. Contribution of water to the stream from the wetland pore water for the majority of the study 2000 season is also present in geochemical evidence. Dissolved oxygen at the outflow of the Fletcher Swamp aver-aged 8 mg L−1for the season, but displayed a downward trend throughout the summer
15
months until 28 August (doy=240), the same point at which precipitation became less frequent and discharge was reduced. Lower dissolved oxygen contents are associ-ated with reducing environments (Manahan, 1994) and therefore most likely indicate groundwater inputs to the stream.
During the 2001 dry study season, depression storage and surface water were rarely
20
observed in the Fletcher Swamp, and water table position fell below stream level early in the season (by the end of May). The stream-water table gradient stayed predomi-nantly negative, and as a result the stream lost water to the wetland for the majority of the season (Fig. 6). During the driest parts of the 2001 summer, when this gradi-ent was at its maximum (most negative), the water table was below the peat horizon
25
and in the sand and silt substrate. This deeper zone has hydraulic conductivity (K ) of 2.3×10⁻⁴cm s−1 and this corresponds to a maximum of 14.7 L d−1 being lost to the substrate material along the Fletcher creek channel. In periods when this maximum
HESSD
2, 483–508, 2005 Hydrogeomorphic controls on runoff in a temperate swamp S. Kaufman et al. Title Page Abstract Introduction Conclusions References Tables Figures J I J I Back CloseFull Screen / Esc
Print Version Interactive Discussion
EGU gradient occurred, the stream was interacting only with the mineral substrate and not
the wetland. At this point a complete lateral disconnection occurred, and outflow from the Fletcher Swamp was limited to water that moved longitudinally from the inflow along the defined stream channel. In-stream dissolved oxygen concentrations in 2001 were higher than the preceding study season, indicating that most of the water reaching
5
the sub-basin outflow was direct surface water (i.e. streamflow). Runoff ratios for the majority of storms during the 2000 summer were often high (>40%), demonstrating the low storage capacity of the sub-catchment during precipitation events. Electrical conductivity at the Fletcher Swamp outflow confirmed that surface water was a large contributor to streamflow during stormflow, as it declined sharply following rainfall. In
10
contrast, rainfall events across the Fletcher Swamp in 2001 largely produced low runoff ratios (<20%), except when storm events occurred closely in succession. For exam-ple, the 0.38 mm h−116 August (doy=228) rain event resulted in only 7% runoff, while a 0.48 mm h−1 event two days later increased the runoff ratio to 49%. Dissolved oxygen and electrical conductivity showed minimal reductions under stormflow conditions, and
15
fast returns to baseflow levels, indicating a lack of stream interaction with the surround-ing wetland.
5.2. Wetland-stream interaction; Spencer Swamp
In the Spencer Swamp, water table position was above the surface for the majority of the 2000 summer. This allowed for both longitudinal and lateral connection of the
sur-20
face water towards the sub-basin outflow, and an opportunity for mixing of groundwater and surface water. Slow movement of surface water allowed for interaction with veg-etation and with processes occurring in near surface pore waters. Dissolved oxygen and electrical conductivity both remained relatively steady for the majority of 2000, un-til September, when a dry period decreased dissolved oxygen and increased electrical
25
conductivity, a signal of a higher proportion of groundwater inputs to streamflow at the sub-basin outflow. Discharge through the Spencer Swamp depended upon a longitu-dinal connection between the inflow and outflow of the sub-basin. Depression storage
HESSD
2, 483–508, 2005 Hydrogeomorphic controls on runoff in a temperate swamp S. Kaufman et al. Title Page Abstract Introduction Conclusions References Tables Figures J I J I Back CloseFull Screen / Esc
Print Version Interactive Discussion
EGU in the hollows at the stream disappearance zone controlled the degree of connection,
and a comparison of downstream discharge with average pool depression storage re-veals the effects of the hummock and hollow terrain (Fig. 7). At the northern emergent stream, discharge did not occur until an average volume of 0.2 m3(200 L) was reached in depression pools in the disappearance zone (Fig. 7). At this point surface water
5
was sufficient enough to connect the hollow topography and flush water downslope via overland flow. This same pattern did not hold true for the southern emergent stream, where discharge was present even during dry pool storage periods (Fig. 7). This sug-gests that a groundwater source maintained baseflow in the southern stream, and subsequently at the sub-basin outflow. Moreover, electrical conductivity values at the
10
sub basin outflow increased sharply under the driest conditions and fell under wetter conditions and stormflow, thereby supporting groundwater baseflow maintenance.
As much as 90% of the precipitation in the Spencer Swamp during 2000 was con-verted to runoff, and most storms produced runoff ratios above 40%. These runoff ra-tios were not related to rainfall intensity; however runoff did increase when two storms
15
occurred within 48 hours. Storm events depressed electrical conductivity, although not to the same extent as in the Fletcher Swamp. Since the catchment was already domi-nated by surface water in 2000, additional precipitation inputs increased the rate of flow through the catchment, diluted the ionic content of the surface water and decreased conductivity. Dissolved oxygen dropped sharply as well, indicating a dominance of
20
groundwater during hydrograph recession. A slower return to pre-storm levels than in the Fletcher Swamp is an associated sign of groundwater inputs, or more mixing of groundwater with surface water flow. Low runoff ratios dominated the Spencer Swamp in 2001, and in fact were close to values noted in the same year for Fletcher Swamp. Rainfall raised the water table in the emergence zone (e.g. on 28 August, doy=241)
25
19.9 mm of rain resulted in a 7 cm increase in water table position), but generally large runoff events would occur only after depression storage was satisfied. This is illustrated by the 21 June (doy=172) storm, where discharge at the basin outflow nearly doubled from a baseflow level of 90 L s−1and E C declined with hydrograph rise, indicating
sur-HESSD
2, 483–508, 2005 Hydrogeomorphic controls on runoff in a temperate swamp S. Kaufman et al. Title Page Abstract Introduction Conclusions References Tables Figures J I J I Back CloseFull Screen / Esc
Print Version Interactive Discussion
EGU face runoff. This corresponded with a 0.19 runoff ratio. Under zero flow conditions
(i.e. no flow at sub-basin outflow), precipitation on 22 July (doy=203) resulted in a 0.09 runoff ratio and an increase in EC, suggesting that the precipitation only produced a re-introduction to the shallow groundwater regime. Storm events which occurred in succession within 48 h substantially increased runoff ratios, as the first storm would
5
raise water table position and decrease storage availability and the second event would then provide increased surface runoff.
5.3. Hydrogeomorphic controls on runoff
A large decrease in precipitation between the summers of 2000 and 2001 resulted in changes of hydrologic flow pathways in Beverly Swamp. While overall discharge
10
through the swamp was reduced by 50%, the variability in hydrological responses of the different sub-basins demonstrates the importance of hydrogeomorphic controls on wetland hydrology.
Conditions where precipitation was sufficient to maintain water tables close to the surface led to higher runoff from upstream sources (e.g. headwater wetlands or
con-15
structed reservoirs) and increased surface water inputs to Spencer and Fletcher Swamp during 2000. A lateral connection between the well-defined stream channel and wetland was produced in the Fletcher Swamp, resulting in a gaining stream. In the Spencer Swamp, a longitudinal connection was made and overland flow through hum-mocky terrain dominated the movement of water through the sub-basin. These
hydro-20
logical connections maintained discharge and created effective pathways for transport of water and nutrients displayed in other swamp systems (e.g. Devito and Hill, 1997). In a drought or dry summer scenario, as was the case in the summer of 2001, water table position fell considerably throughout much of Beverly Swamp. Consequently, wa-ter moved out of the stream channel and into the wetland and underlying substrate in
25
the Fletcher Swamp, and the stream lost discharge as it progressed through the sub-basin. Depression storage in the Spencer Swamp was the cause of a lack of overland flow and a longitudinal disconnection between the stream disappearance and stream
HESSD
2, 483–508, 2005 Hydrogeomorphic controls on runoff in a temperate swamp S. Kaufman et al. Title Page Abstract Introduction Conclusions References Tables Figures J I J I Back CloseFull Screen / Esc
Print Version Interactive Discussion
EGU emergence zones. Shallow groundwater flow maintained discharge at the sub-basin
outflow, but not during the driest periods. Oxidizing conditions throughout the Spencer Swamp in dry periods could allow sufficient time for the creation of sulphate (Warren et al., 2001) or methylmercury (Galloway and Branfireun, 2004) that have been reported as pulses exiting this sub-basin following dry conditions.
5
6. Conclusions and implications
In order to understand ecological and biogeochemical functioning in large wetlands, it is necessary to first have a thorough understanding of the wetland’s hydrological pro-cesses and how they change over space and time. This research has demonstrated that Beverly Swamp is a hydrologically complex ecosystem and we suggest that this is
10
common for higher-order wetlands. Inter-annual variation in climatic variables and spa-tial heterogeneity create daily to seasonal variation in hydrologic flowpaths. Although runoff in this swamp is often dependant upon antecedent moisture conditions and de-pression connectivity as has been shown in other wetland research (e.g. Roulet, 1991; Quinton and Roulet, 1998), high variability in flow pathway characteristics in Beverly
15
Swamp arise from contrasts in the sub-catchment topography, geology, stream inputs and wetland-stream interaction. In landscape scale studies, sub-catchments can ex-hibit unique mechanisms for transporting water (Devito, 1995), and by extension, nu-trients and contaminants (Bayley et al., 1986) within the water. These mechanisms are particularly important when considering wetlands in the context of climate and/or
20
land-use changes.
The dry conditions in Beverly Swamp prevailed for the majority of the 2001 sum-mer and only short, severe storms yielded significant runoff within the wetland. How-ever, this is not solely responsible for the observed variability in stream discharge in the Spencer Swamp. The construction of the Valens reservoir at the headwaters of
25
Spencer Creek (the Spencer Swamp) is a land-use change that now regulates stream-flow below Beverly Swamp in the reaches of Spencer Creek. The wet year of 2000
HESSD
2, 483–508, 2005 Hydrogeomorphic controls on runoff in a temperate swamp S. Kaufman et al. Title Page Abstract Introduction Conclusions References Tables Figures J I J I Back CloseFull Screen / Esc
Print Version Interactive Discussion
EGU kept reservoir levels high and therefore the dam was open to a level that kept
sub-stantial flow (∼90 L s−1) entering Beverly Swamp. During 2001, a mid-summer reser-voir release that lasted five days was stored within the wetland, leaving downstream discharge low. The recurrence of this event in wetlands with diffuse streams under similar land-use changes and climatic forcing is likely. Upstream regulation would
5
be more practical and effective in wetland catchments such as the Fletcher Swamp, where Fletcher Creek stream channel is deep and defined. Alternatively, management upstream of basins such as the Spencer Swamp should ensure that a longitudinal connection is maintained between the sub-catchment inflow and outflow. This would minimize storage, allow for efficient downstream discharge maintenance and minimize
10
the possibility of large flushing events of sulphate (Warren et al., 2001) and methylmer-cury (Galloway and Branfireun, 2004). Beyond the boundaries of Beverly Swamp, and other high-order wetlands, downstream water quality and quantity will be related to the processes that retain or export water within the wetland, which is controlled in part by hydrogeomorphic features within them. Any watershed management plan or modelling
15
scheme should incorporate these influences on runoff to expand upon traditional wet-land functions such as flood attenuation or flow maintenance (Bullock and Acreman, 2003).
Acknowledgements. The authors would like to thank J. R. van Haarlem, M. Greenwood, S. Day,
K. Livingstone, A. Bayer, M. Galloway, C. Mitchell and F. Dunnett for data collection assistance, 20
and B. Duncan and the Hamilton Conservation Authority for site access. This project was funded by an NSERC Discovery Grant to JMW.
References
Bayley, S. E., Behr, R. S., and Kelly, C. A.: Retention and release of S from a freshwater wetland, Water A. S. P., 31, 101–114, 1986.
25
Bullock, A. and Acreman, M.: The role of wetlands in the hydrological cycle, Hydrol. Earth Sys. Sci., 7, 3, 358–389, 2003,
HESSD
2, 483–508, 2005 Hydrogeomorphic controls on runoff in a temperate swamp S. Kaufman et al. Title Page Abstract Introduction Conclusions References Tables Figures J I J I Back CloseFull Screen / Esc
Print Version Interactive Discussion
EGU
Casey, R. E. and Klaine, S. J.: Nutrient attenuation by a riparian wetland during natural and artifical runoff events, J. Envir. Q., 30, 5, 1720–1731, 2001.
Damman, A. W. H.: Hydrology, development and biogeochemistry of ombrogeneous peat bogs with special reference to nutrient retention in a western Newfoundland bog, Can. J. Botan., 64, 384–394, 1986.
5
Devito, K. J.: Sulphate mass balances of Precambrian Shield wetlands: the influence of catch-ment hydrogeology, Can. J. Fish., 52, 1750–1760, 1995.
Devito, K. J. and Hill, A. R.: Sulphate dynamics in relation to groundwater-surface water inter-actions in headwater wetlands of the southern Canadian Shield, Hydrol. Proc., 11, 485–500, 1997.
10
Environment Canada: Canadian Climate Normals 1971–2003, available online athttp://www.
msc.ec.gc.ca/climate, 2005.
Galloway, M. E. and Branfireun, B. A.: Mercury dynamics of a temperate forested wetland, Sci. Total E., 325, 239–254, 2004.
Jacks, G. and Norrstrom, A. C.: Hydrochemistry and hydrology of forest riparian wetlands, 15
Forest Ecol., 196, 187–197, 2004.
Kaufman, S. C.: Spatiotemporal Variability in Runoff in a Forested Swamp, M. Sc. Thesis, McMaster University, Hamiltion, Ontario, 2002.
Manahan, S. E.: Environmental Chemistry, CRC Press, Florida, 811, 1994.
Mitsch, W. J. and Gosselink, J. G.: Wetlands, Van Nostrand Reinhold, New York, 1986. 20
Munro, D. S., Bellisario, L. M., and Verseghy, D. L.: Measuring and modelling the seasonal climate regime of a temperate wooded wetland, Atmos. Ocean, 38, 227–249, 2000.
Price, J. S. and FitzGibbon, J. E.: Groundwater storage and streamflow in a subarctic wetland, Saskatchewan, Can. J. Earth, 24, 2074–2081, 1987.
Price, J. S. and Schlotzhauer, S. M.: Importance of shrinkage and compression in determining 25
water storage changes in peat: the case of a mined peatland, Hydrol. Proc. 13, 2591–2601, 1999.
Quinton, W. L. and Roulet, N. T.: Spring and summer runoff hydrology of a subarctic patterned wetland, Arc. Antarc., 30, 285–294, 1998.
Roulet, N. T.: Hydrology of a headwater basin wetland: Groundwater discharge and wetland 30
maintenance, Hydrol. Proc., 4, 387–400, 1990.
Roulet, N. T.: Stormflow production in a headwater basin swamp, Nord. Hydrol., 22, 161–174, 1991.
HESSD
2, 483–508, 2005 Hydrogeomorphic controls on runoff in a temperate swamp S. Kaufman et al. Title Page Abstract Introduction Conclusions References Tables Figures J I J I Back CloseFull Screen / Esc
Print Version Interactive Discussion
EGU
Swanson, D. K. and Grigal, D. F.: A simulation model of mire patterning, OIKOS, 53, 309–314, 1988.
Taylor, C. H.: The effect on storm runoff response of seasonal variations in contributing zones in small watersheds, Nord. Hydrol., 13, 165–182, 1982.
Waddington, J. M., Roulet N. T., and Hill, A. R.: Runoff mechanisms in a forested groundwater 5
discharge wetland, J. Hydrol., 147, 37–60, 1993.
Warren, F. J.: The Effects of Summer Drought on the Hydrology and Sulphate Dynamics of a Temperate Swamp, M.Sc. Thesis, McMaster University, 2000.
Warren, F. J., Waddington, J. M., Bourbonierre R. A., and Day, S. M.: Effect of drought on hydrology and sulphate dynamics in a temperate swamp, Hydrol. Proc., 15, 3133–3150, 10
2001.
Woo, M.-K: Wetlands: A Hydrological Perspective, in: The Physical Geography of North Amer-ica, edited by: Orme, A. R., Oxford University Press, New York, 146–177, 2002.
Woo, M.-K. and Valverde, J.: Summer streamflow and water level in a midlatitude forested swamp, Forest Sci. 27, 77–189, 1981.
15
Young, M. E.: Hydrological and Biogeochemical Controls on Mercury Fate and Transport in a Southern Ontario Forested Wetland, M. Sc. Thesis, University of Toronto, Toronto, Ontario, 2001.
HESSD
2, 483–508, 2005 Hydrogeomorphic controls on runoff in a temperate swamp S. Kaufman et al. Title Page Abstract Introduction Conclusions References Tables Figures J I J I Back CloseFull Screen / Esc
Print Version Interactive Discussion
EGU
Table 1. Fletcher Swamp stormflow hydrological and geochemical measurements for 2000 and
2001 (int=rainfall intensity; Q0=baseflow; Qp=peakflow; r=runoff ratio; k=recession coefficient; E C0=electrical conductivity at baseflow; ECp=conductivity at peakflow; DO0=dissolved oxygen
at baseflow; DOp=dissolved oxygen at peakflow).
Date Day of Year Swamp Rainfall (mm) int (mm hr-1) Q0 (L s-1) Qp (L s-1) r k EC0 (mS cm-1) ECp (mS cm-1) DO0 (mg L-1) DOp (mg L-1)
10-Jun-00 161 Fletcher 6.9 3.4 230 370 0.77 0.83 0.61 0.59 8.2 8.6 12-Jun-00 163 Fletcher 9.5 1.4 270 450 0.67 0.92 0.60 0.53 7.4 9.5 14-Jun-00 165 Fletcher 19.5 1.8 420 610 0.25 0.56 0.45 10.9 8.0 15-Jun-00 166 Fletcher 11.1 2.0 610 700 0.46 0.94 0.45 0.43 7.9 5.0 19-Jun-00 170 Fletcher 6.3 1.4 610 620 0.20 0.95 0.50 0.50 5.4 6.7 22-Jun-00 173 Fletcher 5.2 0.6 550 570 0.70 0.94 0.56 0.54 8.3 8.3 25-Jun-00 176 Fletcher 29.4 3.3 400 560 0.25 0.96 0.59 0.50 9.1 5.5 27-Jun-00 178 Fletcher 7.1 2.4 560 580 0.12 0.98 0.49 0.53 5.4 6.2 30-Jun-00 181 Fletcher 6.6 2.2 570 600 0.21 0.99 0.55 0.54 6.4 6.5 10-Jul-00 191 Fletcher 16.9 2.1 230 420 0.69 0.87 0.63 0.58 8.4 8.0 15-Jul-00 196 Fletcher 13.1 4.5 210 430 0.52 0.93 0.63 0.60 8.2 7.7 31-Jul-00 212 Fletcher 23.4 2.1 190 400 0.32 0.97 0.65 0.57 8.2 7.7 2-Aug-00 214 Fletcher 28.6 14.3 380 540 0.45 0.96 0.66 0.51 9.4 6.4 9-Aug-00 221 Fletcher 10.6 4.2 270 340 0.11 0.95 0.64 0.61 7.9 6.8 10-Aug-00 222 Fletcher 9.5 6.3 320 420 0.34 0.91 0.60 0.55 6.9 6.7 24-Aug-00 236 Fletcher 8.5 1.3 150 190 0.40 0.96 0.65 0.67 8.6 8.5 3-Sep-00 246 Fletcher 9.5 4.8 9-Sep-00 252 Fletcher 15.6 2.8 11-Sep-00 254 Fletcher 8.3 0.8 15-Sep-00 258 Fletcher 11.2 1.0 21-Sep-00 264 Fletcher 5.8 0.7 23-Sep-00 266 Fletcher 24.7 2.0 5-Oct-00 278 Fletcher 5.4 1.0 140 160 0.10 0.99 0.68 0.67 8.2 8.5 6-Oct-00 279 Fletcher 5.9 0.4 160 180 0.40 0.97 0.67 0.68 8.3 8.1 8-May-01 128 Fletcher 7.3 0.7 100 120 0.18 0.94 0.56 0.54 11.7 12.1 17-May-01 137 Fletcher 5.4 0.2 90 140 0.32 0.62 0.52 0.52 11.7 12.3 25-May-01 145 Fletcher 5.0 0.9 260 300 0.32 0.95 0.50 0.49 10.4 10.7 1-Jun-01 152 Fletcher 7.8 0.7 140 170 0.14 0.97 0.51 0.51 11.6 12.0 2-Jun-01 153 Fletcher 5.6 0.3 170 210 0.34 0.93 0.51 0.50 10.4 11.4 10-Jun-01 161 Fletcher 13.5 1.8 110 150 0.21 0.92 0.51 0.55 10.2 11.1 21-Jun-01 172 Fletcher 15.0 1.2 90 140 0.18 0.89 0.53 0.52 10.3 11.3 22-Jul-01 203 Fletcher 28.2 18.8 70 100 0.09 0.92 0.53 0.53 8.4 9.2 16-Aug-01 228 Fletcher 5.1 0.4 70 70 0.07 0.95 0.56 0.55 9.3 9.6 18-Aug-01 230 Fletcher 14.5 0.5 70 180 0.49 0.84 0.54 0.53 8.9 9.6 26-Aug-01 238 Fletcher 5.4 1.8 60 90 0.04 0.92 0.54 0.54 9.3 9.7 28-Aug-01 240 Fletcher 19.8 13.2 90 130 0.05 0.75 0.54 0.53 8.9 10.2 19-Sep-01 262 Fletcher 7.5 0.6 70 90 0.06 0.86 0.53 0.53 9.3 11.0 21-Sep-01 264 Fletcher 10.8 0.8 80 110 0.09 0.90 0.54 0.53 9.6 10.3 25-Sep-01 268 Fletcher 9.0 1.0 90 110 0.08 0.89 0.53 0.52 10.2 11.0 4-Oct-01 277 Fletcher 37.8 1.1 80 280 0.55 0.90 0.55 0.54 8.6 10.6 11-Oct-01 284 Fletcher 28.9 0.8 190 340 0.30 0.95 0.54 0.54 9.2 9.2 14-Oct-01 287 Fletcher 6.0 0.5 330 340 0.05 0.97 0.55 0.57 8.7 7.3 16-Oct-01 289 Fletcher 15.6 0.7 320 360 0.19 0.98 0.55 0.57 7.6 8.2 22-Oct-01 295 Fletcher 10.2 1.6 280 340 0.34 0.97 0.57 0.54 7.4 8.2
HESSD
2, 483–508, 2005 Hydrogeomorphic controls on runoff in a temperate swamp S. Kaufman et al. Title Page Abstract Introduction Conclusions References Tables Figures J I J I Back CloseFull Screen / Esc
Print Version Interactive Discussion
EGU
Table 2. Spencer Swamp stormflow hydrological and geochemical measurements for 2000 and
2001 (int=rainfall intensity; Q0=baseflow; Qp=peakflow; r=runoff ratio; k=recession coefficient; E C0=electrical conductivity at baseflow; ECp=conductivity at peakflow; DO0=dissolved oxygen
at baseflow; DOp=dissolved oxygen at peakflow).
Date Day of Year Swamp Rainfall (mm) int (mm hr-1) Q0 (L s -1 ) Qp (L s -1 ) r k EC0 (mS cm -1 ) ECp (mS cm -1 ) DO0 (mg L -1 ) DOp (mg L -1 ) 10-Jun-00 161 Spencer 6.9 3.4 70 100 0.17 0.76 0.37 0.38 8.3 5.4 12-Jun-00 163 Spencer 9.5 1.4 70 130 0.35 0.91 0.38 0.39 5.7 4.5 14-Jun-00 165 Spencer 19.5 1.8 120 170 0.13 0.41 0.42 5.0 4.7 15-Jun-00 166 Spencer 11.1 2 170 190 0.15 0.95 0.49 0.39 4.3 2.9 19-Jun-00 170 Spencer 6.3 1.4 170 170 0.14 0.94 0.46 0.46 3.2 4.3 22-Jun-00 173 Spencer 5.2 0.6 150 160 0.50 0.85 0.49 0.48 4.2 3.9 25-Jun-00 176 Spencer 29.4 3.3 100 150 0.14 0.99 0.51 0.47 5.1 4.4 27-Jun-00 178 Spencer 7.1 2.4 150 160 0.30 0.93 0.43 0.44 3.9 4.1 30-Jun-00 181 Spencer 6.6 2.2 150 160 0.70 0.98 0.48 0.46 4.1 4.7 10-Jul-00 191 Spencer 16.9 2.1 60 110 0.26 0.82 0.51 0.47 7.1 5.4 15-Jul-00 196 Spencer 13.1 4.5 60 80 0.80 0.85 0.49 0.47 10.9 6.4 31-Jul-00 212 Spencer 23.4 2.1 50 100 0.15 0.92 0.52 0.50 8.2 6.3 2-Aug-00 214 Spencer 28.6 14.3 100 150 0.25 0.95 0.51 0.43 6.4 4.8 9-Aug-00 221 Spencer 10.6 4.2 70 90 0.50 0.88 0.52 0.50 6.8 5.3 10-Aug-00 222 Spencer 9.5 6.3 80 120 0.22 0.85 0.50 0.45 6.9 5.6 24-Aug-00 236 Spencer 8.5 1.3 50 60 0.90 0.97 0.53 0.52 9.6 8.6 3-Sep-00 246 Spencer 9.5 4.8 50 60 0.14 0.95 0.54 0.53 11.2 7.6 9-Sep-00 252 Spencer 15.6 2.8 50 60 0.60 0.95 0.53 0.52 7.1 6.7 11-Sep-00 254 Spencer 8.3 0.8 60 70 0.60 0.87 0.52 0.52 7.1 6.8 15-Sep-00 258 Spencer 11.2 1 70 70 0.70 0.98 0.52 0.51 7.5 6.8 21-Sep-00 264 Spencer 5.8 0.7 60 70 0.50 0.97 0.61 0.52 7.3 7.2 23-Sep-00 266 Spencer 24.7 2 60 110 0.28 0.90 0.54 0.68 7.8 7.7 5-Oct-00 278 Spencer 5.4 1 60 70 0.40 0.98 0.61 0.59 7.3 7.3 6-Oct-00 279 Spencer 5.9 0.4 70 70 0.60 0.99 0.60 0.59 7.3 7.2 8-May-01 128 Spencer 7.3 0.7 10 20 0.13 0.94 0.56 0.57 7.2 10.6 17-May-01 137 Spencer 5.4 0.2 10 20 0.10 0.61 0.54 0.52 7.2 9.8 25-May-01 145 Spencer 5.0 0.9 50 90 0.57 0.86 0.50 0.46 11.1 10.8 1-Jun-01 152 Spencer 7.8 0.7 30 40 0.05 0.95 0.52 0.49 9.6 10.5 2-Jun-01 153 Spencer 5.6 0.3 40 40 0.12 0.94 0.50 0.51 10.2 9.8 10-Jun-01 161 Spencer 13.5 1.8 20 30 0.14 0.93 0.53 0.52 11.0 11.6 21-Jun-01 172 Spencer 15.0 1.2 20 30 0.14 0.90 0.57 0.57 11.4 11.7 22-Jul-01 203 Spencer 28.2 18.8 0 30 0.12 0.61 0.82 0.84 13.4 8.8 16-Aug-01 228 Spencer 5.1 0.4 0 10 0.15 0.80 0.57 0.55 11.6 11.9 18-Aug-01 230 Spencer 14.5 0.5 10 40 0.34 0.80 0.56 0.56 11.3 11.5 26-Aug-01 238 Spencer 5.4 1.8 10 20 0.05 0.81 0.55 0.54 11.4 10.6 28-Aug-01 240 Spencer 19.8 13.2 20 30 0.10 0.78 0.55 0.48 11.1 8.4 19-Sep-01 262 Spencer 7.5 0.6 0 10 0.09 0.75 0.60 0.56 10.2 9.5 21-Sep-01 264 Spencer 10.8 0.8 10 30 0.12 0.72 0.60 0.51 9.5 10.4 25-Sep-01 268 Spencer 9.0 1.0 20 20 0.65 0.92 0.55 0.54 10.6 11.3 4-Oct-01 277 Spencer 37.8 1.1 10 60 0.28 0.92 0.58 0.58 7.2 10.0 11-Oct-01 284 Spencer 28.9 0.8 40 70 0.08 0.97 0.50 0.49 8.8 9.4 14-Oct-01 287 Spencer 6.0 0.5 60 70 0.02 0.98 0.46 0.47 8.6 6.8 16-Oct-01 289 Spencer 15.6 0.7 60 70 0.04 0.98 0.48 0.46 8.3 9.9 22-Oct-01 295 Spencer 10.2 1.6 60 60 0.07 0.98 0.48 0.48 9.8 10.3
HESSD
2, 483–508, 2005 Hydrogeomorphic controls on runoff in a temperate swamp S. Kaufman et al. Title Page Abstract Introduction Conclusions References Tables Figures J I J I Back CloseFull Screen / Esc
Print Version Interactive Discussion EGU 25 Figure 1 1 2 Valens Reservoir Fletcher Swamp Spencer Swamp Lower Beverly Swamp W E S N 0 500 Stream Disappearance Zone Stream Emergence Zone
Stream Monitoring Site Groundwater Monitoring Transect Meteorological Tower Stream
Wetland Windsor Hamilton USA Beverly Swamp Toronto Kingston North Bay Ottawa 0 100 200 300 400km 3 4 5 6 7 8 9 10
Fig. 1. Location of the study site within Ontario (inset) and sampling locations within Beverly
HESSD
2, 483–508, 2005 Hydrogeomorphic controls on runoff in a temperate swamp S. Kaufman et al. Title Page Abstract Introduction Conclusions References Tables Figures J I J I Back CloseFull Screen / Esc
Print Version Interactive Discussion EGU 26 Figure 2 1 0 5 10 15 20 25 30 0 500 1000 1500 2000 Discharge (L s -1) 0 200 400 600 800 1000 Spencer Swamp Fletcher Swamp 2000 ('WET') 120 150 180 210 240 270 300 0 600 1200 1800 2400 3000 Day of Year 120 150 180 210 240 270 300
Lower Beverly Swamp
2001 ('DRY') Precipitation (mm) Discharge (L s -1) Discharge (L s -1) a) b) c) d) Spencer Swamp Fletcher Swamp
30-year summer average
2 3 4 5 6
Fig. 2. Interannual variability in: (a) precipitation; (b) catchment inflows; (c) sub-basin outflows;
HESSD
2, 483–508, 2005 Hydrogeomorphic controls on runoff in a temperate swamp S. Kaufman et al. Title Page Abstract Introduction Conclusions References Tables Figures J I J I Back CloseFull Screen / Esc
Print Version Interactive Discussion EGU 27 Figure 3 1 Conductance (mS cm -1) 0.3 0.4 0.5 0.6 0.7 0.8 0.9 1.0 0.4 0.5 0.5 0.6 0.6 0.7 0.7 0.8 2000 2001 Conductance (mS cm -1) Day of Year 120 140 160 180 200 220 240 260 280 300 Dissolved Oxygen (mg L -1) 2 4 6 8 10 12 14 16 18 Dissolved Oxygen (mg L -1) 2 4 6 8 10 12 14 16 18 a) b) c) d) FLETCHER SWAMP FLETCHER SWAMP SPENCER SWAMP SPENCER SWAMP 2
Fig. 3. Interannual variability in: (a) electrical conductance at Fletcher Swamp outflow; (b)
dissolved oxygen at Fletcher Swamp outflow; (c) electrical conductance at Spencer Swamp
HESSD
2, 483–508, 2005 Hydrogeomorphic controls on runoff in a temperate swamp S. Kaufman et al. Title Page Abstract Introduction Conclusions References Tables Figures J I J I Back CloseFull Screen / Esc
Print Version Interactive Discussion EGU 28 Figure 4 1 99.25 99.50 99.75 100.00 100.25 99.25 99.50 99.75 100.00 100.25 Surface 2000 2001 99.25 99.50 99.75 100.00 100.25
distance from stream (m)
0 10 20 30 40 50
water table position (m above arbitrary datum)
99.25 99.50 99.75 100.00 100.25 a) b) c) d) MAY JUNE JULY AUGUST Surface 2000 2001 Surface 2000 2001 Surface 2000 2001 2
Fig. 4. Average groundwater table position at the Fletcher Swamp in: (a) May; (b) June; (c)
HESSD
2, 483–508, 2005 Hydrogeomorphic controls on runoff in a temperate swamp S. Kaufman et al. Title Page Abstract Introduction Conclusions References Tables Figures J I J I Back CloseFull Screen / Esc
Print Version Interactive Discussion EGU 29 Figure 5 1 99.25 99.50 99.75 100.00 100.25 Surface 2000 2001 99.25 99.50 99.75 100.00 100.25 99.25 99.50 99.75 100.00 100.25
distance from stream (m)
0 10 20 30 40 50
water table position (m above arbitrary datum)
99.25 99.50 99.75 100.00 100.25 a) b) c) d) MAY JUNE JULY AUGUST Surface 2000 2001 Surface 2000 2001 Surface 2000 2001 2
Fig. 5. Average groundwater table position in the Spencer Swamp in: (a) May; (b) June; (c)
HESSD
2, 483–508, 2005 Hydrogeomorphic controls on runoff in a temperate swamp S. Kaufman et al. Title Page Abstract Introduction Conclusions References Tables Figures J I J I Back CloseFull Screen / Esc
Print Version Interactive Discussion EGU 30 Figure 6 1 Day of Year 140 160 180 200 220 240 260 280 Gradient -12 -10 -8 -6 -4 -2 0 2 4 6 8 10 12 2001 2000 2 3 4 5 6 7 8 9 10 11 12 13 14 15 16 17 18 19 20 21 22
Fig. 6. Hydraulic gradients at Fletcher Swamp stream channel in 2000 and 2001.
HESSD
2, 483–508, 2005 Hydrogeomorphic controls on runoff in a temperate swamp S. Kaufman et al. Title Page Abstract Introduction Conclusions References Tables Figures J I J I Back CloseFull Screen / Esc
Print Version Interactive Discussion EGU 31 Figure 7 1 Depression Storage (L) 0 100 200 300 400 500 600 Discharge (L s -1) 0 10 20 30 40 50
Southern Emergent Stream Northern Emergent Stream
2 3