HAL Id: pasteur-03242762
https://hal-pasteur.archives-ouvertes.fr/pasteur-03242762
Submitted on 31 May 2021
HAL is a multi-disciplinary open access
archive for the deposit and dissemination of
sci-entific research documents, whether they are
pub-lished or not. The documents may come from
teaching and research institutions in France or
abroad, or from public or private research centers.
L’archive ouverte pluridisciplinaire HAL, est
destinée au dépôt et à la diffusion de documents
scientifiques de niveau recherche, publiés ou non,
émanant des établissements d’enseignement et de
recherche français ou étrangers, des laboratoires
publics ou privés.
Distributed under a Creative Commons Attribution| 4.0 International License
reveals enhanced membrane traffic upon antibiotic
exposure
Julia Bos, Luis Cisneros, Didier Mazel
To cite this version:
Julia Bos, Luis Cisneros, Didier Mazel. Real-time tracking of bacterial membrane vesicles reveals
enhanced membrane traffic upon antibiotic exposure. Science Advances , American Association for
the Advancement of Science (AAAS), 2021, 7 (4), pp.eabd1033. �10.1126/sciadv.abd1033�.
�pasteur-03242762�
M I C R O B I O L O G Y
Real-time tracking of bacterial membrane vesicles
reveals enhanced membrane traffic upon
antibiotic exposure
Julia Bos1*†, Luis H. Cisneros2*†, Didier Mazel1
Membrane vesicles are ubiquitous carriers of molecular information. A broad understanding of the biological functions of membrane vesicles in bacteria remains elusive because of the imaging challenges during real-time in vivo experiments. Here, we provide a quantitative analysis of the motion of individual vesicles in living microbes using fluorescence microscopy, and we show that while vesicle free diffusion in the intercellular space is rare, vesicles mostly disperse along the bacterial surfaces. Most remarkably, when bacteria are challenged with low doses of antibiotics, vesicle production and traffic, quantified by instantaneous vesicle speeds and total traveled distance per unit time, are significantly enhanced. Furthermore, the enhanced vesicle movement is independent of cell clustering properties but rather is associated with a reduction of the density of surface appendages in response to antibiotics. Together, our results provide insights into the emerging field of spatial organization and dynamics of membrane vesicles in microcolonies.
INTRODUCTION
Membrane vesicles (MVs) are small membrane blebs containing bio-logical material derived from their parental cell. They are produced in all life kingdoms (1, 2), from unicellular organisms, such as bacteria (3), yeasts (4), and archaebacteria (5), to cells conforming multi-cellular organisms (6), including cancer cells (7). Extensive charac-terization of MVs across these life forms, commonly conducted by a combination of biochemical techniques, electron microscopy, and atomic force microscopy, has shown that MVs are highly hetero-geneous in size (ranging from 50 nm to a few micrometers in diameter) and composition (e.g., nucleic acids, proteins, lipids, toxins, anti-biotics, phage receptors, signaling molecules, metabolites, metals, and growth factors) (3). Vesicle properties typically depend on the physiological state of the mother cell (6), and the pathways of their biogenesis are very diverse and far from being fully elucidated in any species. While MVs are generally produced by fit viable cells (6, 8–10), mechanisms of cell death have been shown to mediate vesiculation in both bacteria [e.g., prophage-induced lysis (11), explosive lysis (12), and cell disintegration (13)] and eukaryotic organisms [e.g., apoptosis (14, 15) and necrosis (16)]. Other inducing factors, such as antibiotics (11, 17–21), chemotherapy drugs (22), intrinsic envelop stress (23), and environmental stresses (24, 25) or DNA damage (11, 12, 26), have also been shown to stimulate vesic-ulation, suggesting that MVs may be involved in some form of yet undiscovered general biological stress response.
A long-standing interest in understanding bacterial MV compo-sition, their production, and benefits to their hosts has revealed MV involvement in a multitude of biological functions (3), including cell-cell communication (27, 28), horizontal gene transfer (29–32), social phenomena (18, 33–36), immune response modulation (37), and a singular role as decoys for antibiotics (17, 38, 39). Yet, it is not
well understood how MVs execute their assumed functions, partic-ularly how they communicate messages and transport precise bio-logical information in the context of the formation of structured microcolonies in liquid medium or solid surfaces. Insufficient knowl-edge about MV transport and real-time data recorded in living micro-organisms, due principally to a lack of robust imaging and tracking tools, has led to a number of rather speculative characterizations of vesicle-associated biological mechanisms.
It is generally assumed that vesicles discharged from a bacterium move about in the intercellular space, serving as long-distance de-livery shuttles between cells and ensuring, for instance, the effective transport of quorum sensing signaling molecules (27, 28). Electron microscopy imaging has shown that MVs organize in the intercellular space, forming concentric rings around the bacteria Vibrio vulnificus (40), or aggregating into tubular structures extending out from the bacterial cytoplasm forming bridges between cells (29, 41) or simply protruding from the cell surface with no apparent physical connec-tion between cells (42). Attempts to image MVs and nanotubes in living bacterial samples (12, 41) were a good starting point but are still insufficient to fully characterize vesicle behavior under different physiologic conditions.
In this work, we provide a quantitative picture of the MVs’ dynamical properties in a population of live Escherichia coli com-mensal microorganisms. We overcome the technical challenge of visualizing individual MVs labeled with a fluorescent lipophilic dye and tracking their movement by using time-lapse fluorescence microscopy at high magnification combined with fast image acqui-sition, along with imaging tools for automated particle tracking. We demonstrate that MVs undergo several dynamical states, including arrested motion, modest subdiffusive motion constrained to the surface of cell membranes, and occasional random walks in the in-tercellular space. Most notably, our vesicle tracking analysis reveals that challenging the bacteria with low doses of antibiotics has a notable impact on the properties of vesicle dynamics, vesicle-to- membrane affinity, and surface properties of the cell membranes. The overall effect is enhanced vesicle transport along the bacterial membranes. This work sheds light on unexplored bacterial MVs’ 1Unité Plasticité du Génome Bactérien, Institut Pasteur, UMR3525, CNRS, Paris 75015,
France. 2The Biodesign Center for Biocomputing, Security and Society, and BEYOND
Center for Fundamental Concepts in Science, Arizona State University, Tempe, AZ, USA. *These authors contributed equally to this work.
†Corresponding author. Email: julia.bos@pasteur.fr (J.B.); lhcisner@asu.edu (L.H.C.)
Copyright © 2021 The Authors, some rights reserved; exclusive licensee American Association for the Advancement of Science. No claim to original U.S. Government Works. Distributed under a Creative Commons Attribution License 4.0 (CC BY). on June 2, 2021 http://advances.sciencemag.org/ Downloaded from
dynamics, and it highlights an unexpected role of antibiotics in vesicle movement.
RESULTS
Real-time imaging and automated tracking of MVs in live E. coli bacteria
Real-time imaging of bacterial MV dynamics has remained a difficult task because of their small size (from 50 to 500 nm) and the lack of a robust fluorescent method to visualize them. The bigger challenges of this effort are photobleaching of the samples and the need for high- resolution imaging at fast acquisition speeds under low light conditions.
To capture E. coli MVs’ dynamics inside the microcolony and examine the effect of antibiotic stressors on their movement, we used high-magnification wide-field fluorescence microscopy combined with a scientific complementary metal–oxide–semiconductor (sCMOS) camera (Hamamatsu ORCA-Flash 4.0) capable of low read noise at 20 frames per second.
Our optical setting (fig. S1A) provides remarkably well-resolved vesicles (≥200 nm in diameter size) stained with fluorescent FM1-43 lipophilic dye (43, 44) and imaged either from a preparation of pure vesicles (cell-free) in suspension (Fig. 1A, left) (see Materials and Methods for vesicle isolation protocol) or from a large field of immobilized cells growing onto an agarose pad (Fig. 1A, middle). It is important to note that, though the bacteria are partially embedded in the agarose pad, all moving and not moving vesicles are located in a focal plane above the pad (for details, see the Supplementary Materials, fig. S1B, and movie S1). Also, cell membranes and MVs were uniformly stained by the addition of FM1-43 lipophilic dye to the pad regardless of treatment (fig. S2, A to E, respectively).
The presence of MVs in our samples was verified by electron microscopy (Fig. 1A, right) and the vesicle sizes by dynamic light scattering (DLS) (fig. S2, F and G). DLS data indicated that two pop-ulations of MVs were typically present in our cell samples regardless of treatment or the presence of the dye: small vesicles (e.g., <100 nm diameter), which are not detectable under the microscope, and large vesicles (e.g., >200 nm diameter). Although the impact of the small vesicles on the motion of the large vesicles will require further inves-tigation, the results from DLS suggest that exposure to antibiotics is associated with an increase in their production. A higher density of small particles in the medium would physically cause an increase in the effective viscosity and thus suppress larger vesicle diffusion, which is the opposite of what we observe. Therefore, the effect of small vesicles in our results is likely negligible.
High-magnification microscopy videos of the fluorescent vesicles were recorded at 20 frames per second for 15 to 30 s. Individual vesicle trajectories were estimated using Trackpy, a Python package for automated Particle-Tracking-Velocimetry. Tracking vesicle mo-tion in populamo-tions of bacteria immobilized onto agarose pads (movie S2) revealed three distinct movement patterns: motion along the cell membranes, or “sliding” state (Fig. 1B and movie S3); mo-tion in the intercellular space with occasional momo-tion close to the membrane, or “free” state (Fig. 1C and movie S4); and no motion at the membrane, or “bound” state (Fig. 1D and movie S5). It is worth noting that the dye has no evident influence on the vesicle behavior (details in the Supplementary Materials, fig. S3, A and B), as well as on the different vesicle states (fig. S3, C and D). Moreover, MV states are not fixed, but rather susceptible to change with time (fig. S3, C and D).
Observations in exemplary experiments demonstrate that most of the vesicles (∽80%) are in the stalled state and generally do not move during the length of the experiment. In this paper, we focused our attention on the moving fraction, which typically transitions between the sliding and free states.
MVs disperse primarily in very close proximity to the bacterial membranes
We used image processing techniques to map out the locations of fluorescent cell membranes (Fig. 2A) and compared them with
A B Time [s] “Sliding” “Free” “Bound” Time [s] Time [s] C D
Fig. 1. Visualization and tracking of MVs’ behavior in live bacteria. (A) Visual-ization of MVs. Microscopic images of purified (cell-free) MVs (left) and of E. coli hypervesiculated cells (middle) producing MVs. MVs (small bright foci indicated by yellow arrowheads) and cell membranes are stained with the fluorescent lipophilic dye. Scale bar, 1 m. Electron microscopy (EM) image (right) of purified vesicles (white triangles) obtained by negative staining with uranyl acetate heavy metal salts. Inset shows an enlarged (×13,000) EM image of a purified vesicle with the two leaflets of the lipid bilayer. Scale bar, 100 nm (inset). (B to D) Vesicle tracking analysis of three exemplary vesicles with distinct types of motion: vesicle “sliding” along the membrane (B), vesicle “free” moving in the intercellular space (C), and vesicle “bound” to membrane (D). Positions XY of the vesicle obtained from trajectories were refer-enced to the initial position XY. Dashed lines represent cell contours. The trajectory trace of the vesicle is shown in the microscopy image (right; light blue trace). Vesicle initial position is shown in yellow circles. Scale bars, 2 m (all images).
on June 2, 2021
http://advances.sciencemag.org/
individual vesicle trajectories. A vesicle is considered in free state when its distance to the nearest cell membrane is larger than 1 m. This scale corresponds to about 5 to 10 times the diameter of a ves-icle and gives us a conservative level of confidence for the definition of free state given the image resolution and the typical size of a cell (Fig. 2A). The fraction of the total time that a vesicle spends in the sliding mode versus the free mode is estimated for each trajectory (with 0 indicating that the vesicle is always sliding on a cell mem-brane and 1 that is always free). Figure 2B shows the distribution of the mean fraction of time in the free state across all experiments, in the absence (blue trace) or presence of drug treatments (yellow and gray traces). Our data revealed that MVs undergo occasional short free walks into the intercellular medium, and most importantly, they spent most of their time moving at the bacterial membrane–medium interface. These findings suggest a novel picture of vesicular trans-port with respect to their affinity to bacterial membranes, and ques-tion the general idea that MVs are free-floating particles dispersing in the extracellular medium as they shed off from the membrane.
Antibiotic treatment enhances vesicle production and transport
MVs are involved in intercellular communication as they transport cargo messages to targeted cells (45, 33). What happens when a population of cells is challenged with low doses of antibiotics? Does environmental stress directly affect their transport process? We in-vestigated the motion properties of MVs in the presence of antibiotics to address these questions.
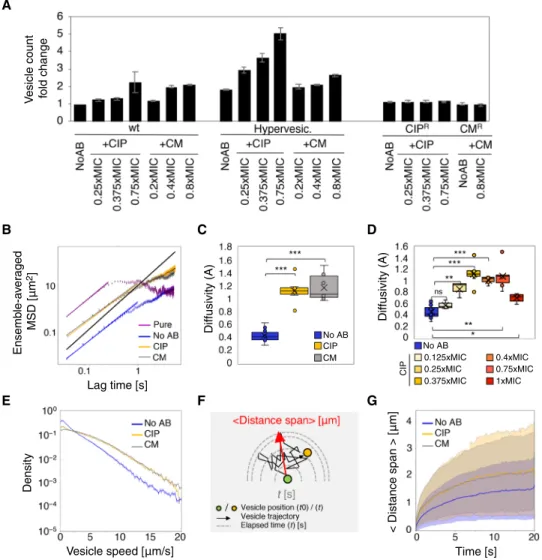
To gain statistical confidence, we used a hypervesiculated bacterial strain (ompA gene deletion mutant) (46) in which vesicle blebbing (47) is promoted by the lack of OmpA membrane protein. In the absence of any treatment, these cells exhibit two- to fivefold increased vesicle production in comparison to the wild-type (wt) strain, as measured in our vesicle counts assay (Fig. 3A).
We chose to treat the bacteria with sub-minimal inhibitory con-centration (MIC) doses of antibiotics for a short period of time to avoid mass cell death during the experiment. Sub-MICs of antibiotics have been reported to promote adaptation to stress and emergence of resistance (48, 49). We selected non–membrane-active antibiotics, such as ciprofloxacin (CIP) and chloramphenicol (CM), which do not cause membrane disruption. CM impairs protein translation, triggering the ribosomal stress response (50). CIP is a
fluoroquino-lone that blocks DNA replication (51) and triggers the DNA dam-age stress SOS response (52) that causes cell filamentation (i.e., division arrest), a programmed response controlled by the global transcrip-tional repressor LexA and the DNA repair inducer protein RecA.
Challenging the bacteria with low doses of CM and CIP did not severely affect the viability of ompA cells (fig. S4A) and was associated with increased vesicle production (Fig. 3A). We verified that addi-tion of the fluorescent dye to the cultures did not change the cell sensitivity to the antibiotics (fig. S4, B to D). Bacteria resistant to CIP and CM no longer overproduce vesicles when exposed to sub-MIC concentrations of the antibiotics (Fig. 3A), suggesting that increased vesicle production is a function of stress. However, manipulating SOS response gene expression [i.e., using a lexA-3 (Ind−) allele or a recA knockout mutant, which blocks the induction of the stress re-sponse, or a recB knockout mutant, which fails to initiate DNA repair (52)] did not prevent the rise of vesicle production in the presence of CIP (fig. S5A), suggesting that vesicle formation in E. coli is unlikely part of the programmed SOS pathway as proposed in the literature (26). Another mechanism for vesicle production that is largely de-bated in the field is cell death: Dying cells release increased amounts of MVs in the intercellular medium (11–13). The contribution of cell death to increased vesicle production was examined in our samples, although we worked with low doses of antibiotics with minor effects on viability during the time length of the experiment (fig. S4A). We found that there is a positive correlation between a rise in vesicle production and death levels across treatments (fig. S5B). Yet, the linear relationship is different for each treatment, suggesting that cell death may contribute only partially to the increase of MV production upon stress exposure, leaving room for additional mechanism(s).
To analyze MV traffic along the membranes, we examined mo-tion properties, speed, and traveled distance for different treatment conditions (Fig. 3, B to G). The diffusion of vesicles is assessed by means of the mean square displacement (MSD) measured on the ensemble of displacements generated from trajectory tracks. In a random walk, the MSD can be written as <R2 > = A ∙ ∆tn, where R is a distance displacement corresponding to a time lag ∆t and A is the diffusivity, which indicates the typical mean instantaneous dis-placement of vesicles (in a two-dimensional system, A = 4D, with the D the diffusion coefficient of vesicles). In this formulation, n indicates the scaling coefficient. Namely, n ≈ 1 for regular Brownian motion, n > 1 for active transport, and n < 1 for anoma-lous diffusion, generally attributed to dispersion in constrained or crowded conditions.
We found that purified vesicles (cell-free) suspended in liquid medium undergo diffusion with a power exponent n = 0.913 ( ± 0.023) (Fig. 3B, purple). We then estimated the MSD of vesicles for popu-lations of cells immobilized on agarose pads. As the MSD is propor-tional to the temperature T of the system and inversely related to the viscosity of the medium (53), we kept both the temperature of the medium preparation and the stiffness of the agarose pad strictly constant across all time-lapse experiments. With this experimental setup, MSD plots show that MVs exhibit a transport exponent of n = 0.884 ( ± 0.015) (Fig. 3B, blue) with similar outcomes for antibiotic treatments [+CIP (n = 0.813 ( ± 0.016);+CM (n = 0.84 ( ± 0.011)] (Fig. 3B, orange and gray, respectively). This finding of slightly under-diffusive exponents is not unexpected, given that the bulk of the vesicles stay confined to cell membranes and are also subjected to crowded conditions of cells stacked close together (Fig. 2B and movies S2, S6, and S7).
A B
Free
Density
Sliding
Fraction of time “free” Fig. 2. Bacterial vesicle localization with respect to cell membranes. (A) Example of a processed image after skeletonization of cell membrane contours (yellow lines). The enlarged portion shows MVs in the sliding (red) and free (gray) states. The yellow arrow represents the minimal distance from an MV to the membrane for it to be deemed free. Scale bar, 1 m. (B) Distribution of the mean fraction of time in free state across all trajectory tracks for each treatment condition [No antibiotic (No AB) (Ntraj = 3989), and with ciprofloxacin (CIP) (Ntraj = 2292) or chloramphenicol (CM)
(Ntraj = 3902) antibiotics]. Error bars represent SDs.
on June 2, 2021
http://advances.sciencemag.org/
On the other hand, the estimated values of diffusivity A signifi-cantly increased (≳2-fold) in antibiotic-treated cells [+CIP; A = 1.115 ( ± 0.047); +CM (A = 1.106 ( ± 0.033)] (Fig. 3C, orange and gray, respectively) compared with no antibiotic (No AB) conditions [A = 0.45 ( ± 0.018); Fig. 3C, blue]. Increasing the antibiotic concentra-tion in the sub-MIC range to the MIC shows that vesicle diffusivity increases gradually before reaching a maximal diffusivity at 0.375×MIC and then drops down at concentrations near the MIC (Fig. 3D and table S1). The biphasic dose-response characterized by low-dose stimulation and high-dose inhibition, also known as hormetic response (54), is an interesting result indicating enhanced vesicle transport in response to a narrow range of antibiotic concen-trations, and will be elaborated further in Discussion. It should be stated that antibiotic treatments had little to no effect on the exponent n (table S1). A comparison of the mean distribution of speeds across all samples in the three treatment conditions (No AB, +CIP, +CM)
(Fig. 3E) shows that samples exposed to CIP and CM antibiotics have noticeably larger tails, demonstrating that higher speed values are more likely under stress conditions (Fig. 3E).
An alternative way to represent transport is to evaluate the far-thest distance from the initial position that each vesicle reaches as a function of time (as a first passage time problem, Fig. 3F). We found that vesicles produced under antibiotic stress (CIP and CM) achieve longer distances:0.9 m (+CM or + CIP) versus 0.6 m for No AB treatment in 1 s, and 1.95 m (+CM) and 2.1 m (+CIP) versus 1.4 m (No AB) in 10 s (Fig. 3G). There was no notable difference in the vesicle speed profile between the two antibiotic treatments, although they provoke very distinct biological stress responses. Spe-cifically, CIP triggers the SOS response, inducing cell filamentation and thus a change in cell clustering, while CM triggers a ribosomal stress response, which, at sub-MIC doses, does not alter cell shape. One could think that filamentation provides longer tracks for vesicle A
V
esicle count fold change
Ensemb le-a ve rage d < Distance span > [m ] Vesicle speed [ m/s] MSD [m 2] Density Lag time [s] Time [s] Diffusivity (A) CIP CM CIP No AB No AB 0.125xMIC 0.25xMIC 0.375xMIC 0.4xMIC 0.75xMIC 1xMIC Diffusivity (A) B E C F D G
Fig. 3. Effects of antibiotic treatment on MV production and movement. (A) Vesicle mean counts (fold change with respect to wt/no AB) in wild-type, hypervesiculated, and antibiotic-resistant strains (CIPR, CMR) (see table S2 for strain references) with sub-MICs of CIP or CM. Error bars are SDs. (B) Ensemble-averaged mean squared
displacement of MVs, pure (purple) or growing in a microcolony on pad with no AB (blue), with CIP (0.375×MIC; orange) and CM (0.4×MIC; gray). Solid lines indicate line of best fit from which the diffusion exponent n and diffusivity A are determined. The black line represents Brownian diffusion (n = 1). (C) Boxplots of MV diffusivity values (A) for each treatment. Crosses are the mean values. (D) Boxplots of A for increasing doses of CIP. (E) Density plot of the mean speed distribution of MVs for different treatments. (F) Diagram showing the averaged distance span (micrometers; red arrow) by a vesicle during a random walk. (G) Averaged distance span (solid lines) of MVs across treatments. Shaded regions represent the dispersion (one SD) in each case. Comparisons in (C) and (D) are as follows: ns, P > 0.05; **P < 0.01; ***P < 0.001.
on June 2, 2021
http://advances.sciencemag.org/
motion and thus boosts the traveled distance along the membranes, but our analysis showed that changes in cell shape have no active role in the average distance span and transport of vesicles (Fig. 3G and movies S6 and S7).
Figure 2B shows that vesicles spend most of their time sliding on the cell membrane surface. Antibiotic dosage seems to lower the affinity of the vesicles to the membrane, making them break free more frequently into the intercellular medium. Yet, the change in the amount of free vesicles released upon antibiotic treatment did not affect the net dif-fusivity values (nor the speed) of the vesicles (fig. S6), suggesting that the effect of the increase in the free fraction on MV motion properties is negligible in the tested conditions, and that the sliding fraction of MVs dictates the overall transport properties of the system.
In summary, we showed that antibiotic-stressed bacteria produce a greater number of vesicles that move faster, diffuse farther away along the membranes, and expend more time in the intercellular space. Together, these results demonstrate that vesicle transport is improved in response to antibiotic stress and that their motion is mostly con-strained to the cell membranes rather than the intercellular space. It should be mentioned that our results hold when the temperature of the stage was maintained at physiological conditions (37°C) during movie recording (fig. S7, A to D) or when we used a different bacterial strain background (tolQ) for vesicle production (fig. S7F) (46).
Antibiotic-induced change in cell clustering and colony shape does not account for increased diffusivity
We observed that low doses of CIP antibiotic marginally slow down growth with no notable killing (fig. S4) and induce cell filamentation
(Fig. 4A). This change in cell morphology directly affects the cell clustering during the growth of the microcolony and results in less packed cell patches (Fig. 4A). Because most of the vesicles diffuse at the cell surface, it was essential to understand whether the differ-ences in cell crowding explained the differdiffer-ences in diffusivity.
Defining an appropriate measure of “cell density” to fairly com-pare colonies across the various treatments is challenging because antibiotic-induced filament formation provokes different geometries and packing properties of the microcolonies they conform. Thus, instead of reporting cell density as a simple count of the number of cells per frame, we estimated the colony edge density as the fraction of the colony contour length to the total length of cellular membranes (i.e., sum of colony perimeters to sum of cell perimeters), which we call “membrane factor.” This quantity approaches zero for a system conformed by compact colonies (i.e., many cells densely and tightly packed together) and one for physically dispersed cells. Our results show that this quantity increases for both antibiotic treatments, CM and CIP (Fig. 4B). Then, we evaluated the relationship between the diffusivity and the membrane factor for each set of movies (Fig. 4C), showing a rather mitigated Pearson’s correlation coefficient between diffusivity and cell crowding, with R = 0.58 (Fig. 4C). We observed that cases under different treatments display very distinct diffusivity values, although they have similar membrane factor values (Fig. 4C, light orange shadow). This result supports the hypothesis that cell density (crowding) is not by itself solely accounting for the change in vesicle diffusivity under antibiotic exposure. It is important to consider that these arguments still hold when the MV dynamics were recorded at 37°C (fig. S7E).
Fig. 4. Effect of crowding on MV diffusivity. (A) Processed microscopy images showing colony confluency across treatments (from left to right: No AB, +CIP, +CM). Scale bar, 20 m. Insets: Segmentation of colony edges (red line) and membrane contours (yellow line). Scale bar, 5 m. (B) Membrane factor (ratio of colony contour length to the total membrane length) across treatments. Values range from 0 (packed cells) to 1 (dispersed cells). (C) Net MV diffusivity plotted against membrane factor across all treatments. The orange bar highlights distinct diffusivity values at similar membrane factor values and different treatments, suggesting that cell crowding alone is not accountable for antibiotic-induced enhanced diffusivity. (D) Fraction of events per trajectory in each state [inside the colony (gray), at the colony periphery (red), or free in the intercellular space (white)] across all experiments showing that moving vesicles are sliding at the periphery of the colony most of the time. (E) Fraction of MVs sliding at the periphery of the colony across treatments. (F) Net vesicle diffusivity (black boxes) versus diffusivity of MVs at the periphery of the colony (red boxes) across treatments. ns, P > 0.05; **P < 0.01; ***P < 0.001.
on June 2, 2021
http://advances.sciencemag.org/
On the other hand, it is possible that a change in cell morphology and packaging created more opportunities for the vesicles to move on the colony edges (rather than inside of the colony), providing an explanation for the general increased diffusivity of MVs under anti-biotic treatment.
To examine this assertion, we classify trajectory according to the location of sliding vesicles with respect to the microcolony edges: MVs sliding on cells located inside of the cell patch (sliding internal) and MVs sliding at the periphery of the cell patch (sliding periphery) (Fig. 4D). We found that the fraction of MVs in the periphery of the microcolony is the most abundant across all fractions (Fig. 4D) and in-creases with treatment (Fig. 4E), suggesting that the natural “preferred” location of the vesicles is on the periphery of the cell patches.
Yet, when only the motion at the colony edges is considered and compared across treatments, the diffusivity of these MVs remains highly similar to the corresponding net diffusivity and thus increases with antibiotic treatments (Fig. 4F). These results reveal that the nature of the changes in diffusivity is associated to a biological mechanism in response to antibiotic stress rather than physical/geometrical con-straints of colony configuration.
Antibiotic-mediated alteration of the cell surface contributes to enhanced vesicle movement
We investigated potential mechanisms responsible for a change in vesicle diffusivity when the cells are challenged with low doses of antibiotics. According to the Stokes-Einstein equation (53), the dif-fusion coefficient of particles subjected to stationary Brownian motion is given by D = kBT/6r, where kB is the Boltzmann
con-stant, T is the temperature, r is the particle radius, and is the dynamic viscosity of the medium. Because vesicle sizes (fig. S2F) lie within the same range across treatments, and we were careful to maintain a uniform room temperature (21°C), as well as equal vis-cosity of the agarose pads, during the short time course recording and across all experiments, we can assume that these factors were not accountable for enhanced vesicle diffusivity.
We next tested whether the antibiotics we used, though not membrane-active, could trigger perturbations of membrane mor-phology. Changes in membrane polarization, permeability, and fluidity upon the addition of low doses of antibiotics were assessed with the use of specific fluorescent membrane dye reporters. A voltage- dependent dye was used to specifically stain depolarized membranes (fig. S8A). Loss of membrane permeability was assayed with a membrane-impermeable chromosome counterstain that enters the cells only if the membrane is damaged (fig. S8B). Membrane fluidity was monitored with a lipophilic pyrene probe, a lipid analog that exhibits changes in its spectral properties when interacting with a fluid membrane (fig. S8C). Our measurements did not report any strong impairment in the membrane properties of cells exposed to sub-MIC antibiotic CIP or CM when compared to untreated cells (fig. S8), indicating that increased diffusivity upon sub-MIC antibiotic exposure arises by means other than changes in the membrane properties.
We hypothesized that a change in the amount of cell surface appendages, such as type I fimbriae, could modulate the effective viscosity of the membrane surface to the motion of sliding vesicles. Fimbriae are typically 1 to 10 m long, proteinaceous erected struc-tures found on the surface of both Gram-negative and Gram-positive bacterial cells (55). Extending from the surface of the bacterial cell wall, they are involved in many functions, such as attachment,
adhesion, and locomotion. Fimbriae production in bacteria bifurcates into two distinct states (production ON and OFF), a phenomenon known as bistability or phase variation (55), contributing to bacterial phenotypic heterogeneity. The total amount of FimA surface pro-tein, the main component of the type I fimbriae external structure, was assessed in the presence or absence of antibiotics by Western blot analysis (Fig. 5A). A knockout strain for type 1 fimbriae expres-sion (fim−), as well as a strain expressing fim genes in a constitutive manner (fim++), was used as controls. FimA amount decreases in the presence of either CIP or CM antibiotics in both wild-type and ompA strain backgrounds (Fig. 5A), indicating that E. coli cells re-spond to sub-MIC antibiotics by remodeling their external surface. We measured the levels of FimA surface protein at increasing doses of CIP antibiotic (Fig. 5B). FimA levels follow a U-shaped curve profile in response to increasing doses of CIP, with FimA disappearing at intermediate sub-MIC of CIP (0.375×MIC) and reappearing at the cell surface at concentrations near the MIC. Despite noticeable levels of damaged cells at concentrations near the MIC, evidenced by the increased amount of the cytoplasmic RNA polymerase (RNP) released in the “surface” fraction, it appears that FimA appendages accumulate again at the cell surface when survival is challenged (Fig. 5B). In addition, the FimA dose-response profile seems to be the reversed mirror image of the diffusivity values for the same range of CIP doses (Fig. 3D). Then, we tested whether vesicle diffusivity was affected by the presence of surface appendages. Movies of vesicle dynamics were recorded in wild-type cells (where fimA expression is under phase variation control), and fim− and fim++ cells in the presence of sub-MIC CM and CIP antibiotics. Diffusivity values show no significant increase in the fim knockout strain, suggesting that the absence of surface appendages does not have any synergistic effect with the antibiotic (Fig. 5C, gray boxes). Yet, diffusivity is sig-nificantly reduced when the cell is covered with large amounts of fimbriae (fim++) in both treatment conditions, supporting a role of surface appendages in the constraining of vesicle motion (see table S1 for a summary of A values across treatments and fim strains). We note that in the absence of antibiotic treatment, there is also a sig-nificant decrease in diffusivity between the fim++ and fim− strains, although it was less pronounced than in the presence of antibiotics (Fig. 5C, blue boxes). It is likely that E. coli K12 wild-type strain cells are not phenotypically very different from the fim− mutants, as they switch phases randomly, typically producing a small proportion of fimbriate cells in a colony (56). It is possible that poor fimbriated phenotypes can be extrapolated to higher vesicle diffusivity rates, but low levels of FimA appendages may not lead to significant variations in vesicle motion behavior between the fim− and wild-type (or ompA) strain, as the effect might reach a saturation level. Although a more in-depth analysis of the role of surface appendages will be needed to validate this model, these results hint that the modification of the external cell surface presenting lower densities of appendages in a small window of antibiotic concentrations may render its rugosity lower, thus enhancing vesicle diffusivity (Fig. 5D). Overall, our data suggest novel mechanistic perspectives regarding the molecular actors involved in the motion of bacterial vesicles.
DISCUSSION
Ubiquitous MVs are described as key players in intercellular com-munication and host interactions. We know that MVs carry a vast variety of molecular information; however, how this information is
on June 2, 2021
http://advances.sciencemag.org/
delivered between cells remains an open question. Studying MV transport has proven challenging because of their small size and the difficult task of tracking them in in vivo conditions. Here, we report a detailed analysis of MV dynamics in a bacterial population, show-ing that exposure to low doses of antibiotics induces changes in cell surface composition leading to enhanced MV dispersion.
Potential benefits of MVs’ transport properties at the population scale
Our findings show that MVs move primarily in very close proximity to bacterial membranes (Figs. 1A and 2B and movie S2), with occa-sional short bursts of free diffusive motion in the intercellular space. It is well known that, as a communication mechanism, Brownian diffusion is limited. For instance, E. coli vesicles would typically take approximately 5 s to travel 1 m (Fig. 3G) but over 2.7 hours (about 2000 times longer) to travel 100 m. Therefore, the passive transport of MVs is irrelevant in long-distance cell-cell communication, questioning conventional models proposed in the literature (27, 28). But MVs could still play an important role in broadcasting signals in crowded communities that might induce collective phenomena, such as quorum sensing during biofilm formation (8, 33). In
partic-ular, the work of Schooling and Beveridge (39) established MVs as common constituents of the matrix of Pseudomonas aeruginosa bio-films. In this context, MVs’ signal changes in the extracellular matrix composition, such as the presence of dead cells, are typically associ-ated with massive release of MVs (11, 12, 13). Per our results, MVs could signal changes in the density of cell surface appendages caused by antibiotics or other sources of cellular stress, thereby prompting changes in biofilm architecture as a response to specific environ-mental conditions. In the same way as quorum sensing signals modulate population behavior by communicating changes in cell density, broadcasted MVs could signal other forms of environmen-tally induced cellular stress.
Furthermore, constricted motion of MVs along cell membranes favors communication between cells that are in close proximity, as-suring the delivery of the “package” to a recipient cell when the donor cell has committed to producing it. The immediate conclusion is that MVs might be a costly resource, and suppression of their shed-ding is expected considering that there are no extracellular structures that provide active, and directional, transport that guarantees their remittance. This suggestion is supported by the study of Barr et al. (57) showing that phage particles (T4 phage of size ∼200 nm) rely A
F
old change in FimA surf
ace proteins
F
old change in FimA
Diffusivity (A) No AB CIP CM surf ace proteins C B D
Fig. 5. Effects of antibiotic treatment on bacterial surface appendages and vesicle motion. (A) Effect of antibiotics CIP (0.375×MIC) and CM (0.4×MIC) on surface FimA protein levels in wt, hypervesiculated (afimbriate fim−), and control (hyperfimbriated fim++) strains. Numbers 1 to 8 indicate the different conditions recapitulated
in the quantification plot (fold change to wt/no AB). Error bars are SDs. (B) Effect of increased CIP dosage on FimA levels in hypervesiculated strain. In both (A) and (B), quantification plots represent a total of three biological replicates, and FimA bands (anti-FimA antibody) are normalized to internal control [RNA polymerase alpha sub-unit, RNP, 70 kDa; cell pellet (P); and cell surface (Sf)] using an anti-RNP antibody. (C) Effect of fimbriae density at the cell surface on vesicle diffusivity upon CM and CIP. Vesicle diffusivity measured across treatments (No AB, CM, and CIP) in wt (fim+/−), afimbriate (fim−), and hyperfimbriated (fim++) cells. (ns, P > 0.05; *P < 0.05; **P < 0.01;
***P < 0.001). (D) Diagram summarizing the effect of antibiotic concentration (blue gradient) and presence of fimbriae surface appendages (yellow) on MV diffusivity in
E. coli microcolonies. The mechanism(s) correlating diffusivity to fimbriae exposure remains unknown.
on June 2, 2021
http://advances.sciencemag.org/
on subdiffusive motion to search for bacterial prey when they spread out onto mucosal surfaces of cells. This type of motion was shown to facilitate phages-host encounters and antimicrobial action when bacterial concentration is low (57).
A role of low doses of antibiotic in the control of vesicle diffusivity
Microbial habitats are typically infused with low concentrations of antibiotic metabolites produced by competing microorganisms. Sub-MICs of antibiotics are known to facilitate adaptations, such as the emergence of antibiotic resistance (48, 49, 58–60). Our work high-lights a previously unidentified role of low doses of antibiotics on the transport of bacterial MVs. In particular, the inverted U-shaped dose-response of diffusivity (Fig. 3D) resembles a general hormetic process, a known driving force of adaptation and survival of living cells thriving in challenging environments (54). The narrow sub-MIC range at which MV diffusivity is enhanced is reminiscent of the “selective window” of drug concentrations that drives the evolution of resistant variants, as suggested in previous studies (58, 61). Namely, increased MV transport at antibiotic concentrations that favor the emergence of drug- resistant variants, while maintaining a moderate cell turnover and low death rates, could be collectively favorable by, for instance, directing large-scale phenotypic changes or prompting more effective horizontal exchanges of material associated with long-term resistance. It is yet to be determined whether more diffu-sive vesicles or increased vesicle production are the phenotypic traits that provide cells with increased adaptive potential.
Vesicle release as a phenotypic switch under low dose of antibiotics?
We demonstrated that low doses of antibiotics are able to modify the properties of MV transport: MV production is increased (Fig. 3A), MVs travel faster (Fig. 3E) and farther away in the population (Fig. 3G), and MVs are released from the membrane at higher rates (Fig. 2B). In particular, the fact that more vesicles break free when cells are exposed to CIP and CM antibiotics suggests that stress acts as a trigger in the transitions of MVs’ dynamical states. It is possible that vesicles that are free to dissipate in the intercellular space act as scouts committed to spreading a stress signal to neighboring cells. It will be interesting to test whether the presence of free vesicles in subpopulations affects the level of phenotypic heterogeneity, with subpopulations of cells receiving small MVs discharge, potentially to better withstand antibiotic treatment. In addition, determining the mechanisms responsible for the change in MV affinity to the cell membrane will be crucial to comprehend whether boosted vesicle production and transport are part of a specific stress-induced gene expression reprogramming response that promotes adaptation in the cell population (i.e., in the form of antibiotic resistance), a stress response that helps the cell to trap antibiotics or discard damaged components produced upon stress, or are a signal of stress response that triggers other survival mechanisms.
In conclusion, this work reveals unexplored aspects of bacterial MV transport, a key function in MV physiology, and brings evidence of how antibiotic treatment affects MV transport. Although our data do not support a role of extracellular vesicles as long-distance mes-sengers, they should stimulate future research aiming to investigating the ecological and adaptive role of vesicles in crowded environments, such as biofilms. In addition, correlating MV transport properties to adaptive responses, including defense strategies, horizontal gene
transfer, and modulation of stressful environments, will bring an integrated understanding of the function of MVs in general collec-tive bacteria phenomena.
MATERIALS AND METHODS
Bacterial strains and growth conditions
E. coli K12 (W3110 or BW25113) laboratory strains were cultured at 37°C in liquid LB Miller medium and on solid LB Miller agar plate. CIP and CM antibiotics were added to the bacterial cultures in small volumes to avoid changing the cell culture volume or pad viscosity. The MIC, defined as the lowest concentration of the anti-biotic that prevents bacterial growth, was determined at 40 ng/ml for CIP and 2.5 g/ml for CM. These antibiotics were added at var-ious sub-MICs of CIP (0.125×MIC, 0.25×MIC, 0.375×MIC, 0.5×MIC, 0.75×MIC, 1×MIC) and CM (0.2×MIC, 0.4×MIC, 0.8×MIC), re-spectively. Unless specifically noted, bulk experiments were per-formed with CIP 0.375×MIC and CM 0.4×MIC. The strains used in this study are listed in table S2.
MV purification
MVs were purified by ultracentrifugation. A 1:100 dilution of over-night culture was used to subculture a 50-ml fresh LB medium. Cells were grown overnight at 37°C before being pelleted at 5000 rpm for 15 min at 4°C. Supernatant was passed through a 0.22-m filtration unit. Vesicles were then collected by ultracentrifugation (Optima L-80 XP ultracentrifuge Beckman Coulter) at 36,000 rpm for 2 hours at 4°C with the Beckman Type 45Ti Rotor. Supernatants were carefully decanted, and pellets containing the vesicles were re-suspended in 350- to 500-l phosphate-buffered saline (pH 7.5) or plain LB. Vesicle samples were stored at 4°C for short-term storage or −80°C for long-term storage. Preparations of pure vesicles were verified by electron microscopy using negative staining (uracyl ace-tate) for the presence of MVs.
Vesicle count assays
For each strain, a volume of 3 ml of culture grown for 3 hours to mid-exponential phase was filtered out using the 0.22-m filtration units to harvest the spent medium containing the vesicles. Vesicles were stained with FM1-43 lipophilic dye [1 M/ml; Thermo Fisher Scientific #T3163, dye (N-(3-triethylammoniumpropyl)-4-(4- (dibutylamino) styryl) pyridinium dibromide)] for 30 min at 37°C. As a control, 150 l of the filtrate was plated out onto a plain LB plate and incubated at 37°C overnight to confirm the absence of bacteria in the spent medium after filtration. No colonies were formed after 24 to 48 hours. A small stained aliquot was imaged under the microscope to verify the presence of vesicles. Equal volumes of spent medium were dropped in triplicate in a 96-well flat-black-bottom plate. Total fluorescence was read at 580 nm in a TECAN microplate reader (infinite M200 PRO). Relative vesicle counts were normal-ized to the optical density (read at 600 nm) of each cell culture.
Microscopy setup for vesicle imaging
In all experiments, bacterial cells producing vesicles were grown to mid-exponential phase in liquid LB and then transferred to 1.3% agarose-padded slides containing LB medium supplemented with or without sub-MIC antibiotics 0.4×MIC CM or 0.x375MIC CIP unless noted. A coverslip was placed on top of the agarose pad and sealed with a vaseline:lanolin:paraffin mix (ratio 1:1:1) to prevent
on June 2, 2021
http://advances.sciencemag.org/
pad evaporation. Slides were incubated at 37°C for 2.5 hours for cell growth and then cooled off (T = 21 ± 0.5°C, bulk experiments) and placed under a Zeiss ApoTome inverted wide-field microscope for time-lapse video recording. As particle diffusion is sensitive to changes in both temperature and viscosity of the medium, vesicle dynamics were recorded at constant pad stiffness (1.3%) and tem-perature (21°C) across the different antibiotic treatments. Control experiments were recorded at 37 ± 0.5°C to assess the effect of tem-perature on MV motion parameters. Video frames were taken at 50-ms interval time for a total duration of 15 to 30 s, with a 35-ms exposure time, using a Plan Apo 63× objective (numerical aperture = 1.4, +optovar 1.6×) using a Hamamatsu sCMOS ORCA-Flash 4.0 v3 (Pasteur Institute Imaging Facility Imagopole).
Imaging of pure (cell-free) vesicles in suspension was done by adding a 10-l droplet of FM-43–stained vesicles directly to the glass slide. A glass coverslip was carefully placed on top of the puri-fied vesicle sample and imaged immediately. A total of 114 movies were recorded and analyzed across all conditions and strains. During each imaging session, the vesicle-producing strains were systemati-cally grown on pads in the presence and the absence of the adequate antibiotics for better data comparison and reproducibility. Some experiments were conducted at high CIP antibiotic concentrations (1.2×MIC CIP), but large numbers of cells died. The fluorescence intensity of the dying cells (because of increased influx of the lipo-philic dye through permeable membranes) overshadowed the vesi-cle signal; therefore, these experiments were discarded.
Vesicle tracking analysis
All image sequences were preprocessed with Fiji (62) for background subtraction and pixel thresholding to produce appropriate images for object identification. The SciKit Python package (version 1.2.1) was used to digitally skeletonize fluorescent cell membranes in each case. Vesicle trajectories were generated using the particle tracking velocimetry Trackpy Python package (version 0.4.2, DOI 10.5281/ zenodo.3492186). Further analysis was implemented in Python (code available on request). All experimental treatments (No AB, +CM, +CIP) were performed for each biological sample to confirm that the observed differences in diffusivity were supported in inde-pendent biological replicates. See the Supplementary Materials for further details on particle tracking methodology.
Dynamic light scattering
We used DLS to determine whether small vesicles, not detectable under the microscope (e.g., <200 nm diameter), were present in our samples. The principle of DLS is based on the detection of scattered light by a suspension of particles. The detected signal intensity is used to estimate the diffusion coefficient and particle size by means of the Stokes-Einstein equation (53). This method provides estima-tion of particle sizes, but it does not offer an accurate measurement of the relative abundance of MVs of each size, because a given vesi-cle in suspension may cross the path of the laser light several times. Purified vesicles produced from ompA cell cultures (50 ml) with or without antibiotics (0.4×MIC CM or 0.375×MIC CIP) were resus-pended in 1 mM KNO3 buffer containing or not the FM1-43 dye. A
small volume (30 l) of sample (antibiotic, lipophilic dye) was added to a 384-well plate for recording particle light intensity emission with the automated DynaPro Plate Reader III (Wyatt Technology). Two populations of MVs were typically present in our cell samples, regardless of antibiotic treatment or the presence of the dye. Size
distribution plots were obtained with the DYNAMICS software (Wyatt Technology).
Cell death, membrane depolarization, and membrane fluidity quantification assays
As vesicle production can be associated with extensive cell lysis, cell death was quantified by measuring the fluorescent signal in the cell population using propidium iodide (Sigma-Aldrich, P4864), a membrane-impermeable nucleic acid stain commonly used as a cell death marker. Specifically, red fluorescence is indicative of cellular loss of membrane impermeability. On the other hand, membrane depolarization was quantified by the emission of a green fluores-cence signal using voltage-dependent dye DIBAC4(3) (Thermo Fisher Scientific B438). Microscopy snapshots were taken to visual-ize the population of bacteria under these various dye treatments. Membrane fluidity was assessed by using the Membrane Fluidity Kit (Abcam ab189819), which measures the changes in fluorescence spectral properties of lipid analog probes added to the cell culture. Fluorescence shifts (400 to 470 nm) resulting in changes in mem-brane viscosity were read in a TECAN microplate reader (Infinite M200 PRO). The ratio of emission at 470 nm to emission at 400 nm was normalized to that of unlabeled cell conditions. In all assays, total fluorescence was normalized to biomass (optical density at 600 nm) in each sample.
Fimbriae surface protein Western blotting
A 1-ml sample of each strain cultured to mid-exponential phase was plated on solid agar plates, containing or not the antibiotic, at 37°C for 3 hours. Cells were resuspended in fresh LB, adjusted to the cul-ture absorbance (read at 600 nm), and spun down. Supernatants were discarded, and the pellets were resuspended in 0.9% NaCl. Pel-lets were then spun down and resuspended in 75 mM NaCl, 0.5 mM tris-HCl (pH 7.4). Samples were incubated at 60°C for 20 min and then kept on ice. Bacteria were pelleted and the detached cell sur-face fimbriae present in the supernatant were precipitated in 10% trichloroacetic acid overnight at 4°C.
Surface fimbriae proteins were collected by centrifugation at maximum speed, 16,000g, for 1 hour at 4°C, washed with 75% cold acetone, and resuspended in 100 l of 2× Laemmli buffer. Protein samples were separated on SDS–polyacrylamide gel electrophoresis 4 to 20%. Immunodetection was performed using a 1:10,000 dilu-tion of polyclonal rabbit antiserum raised against the FimA Fimbriae subunit (gift from J. M. Ghigo laboratory, Institut Pasteur). Immuno-detection of RNP protein in both the bacterial pellets and superna-tants was used as an internal and loading control. A 1:1000 dilution of monoclonal goat antiserum raised against the 70 subunit of E. coli RNP (Neoclone W0004) was used. Relative quantification of immunodetected FimA bands was performed using Fiji software (62).
SUPPLEMENTARY MATERIALS
Supplementary material for this article is available at http://advances.sciencemag.org/cgi/ content/full/7/4/eabd1033/DC1
View/request a protocol for this paper from Bio-protocol.
REFERENCES AND NOTES
1. B. L. Deatheragea, B. T. Cooksona, Membrane vesicle release in bacteria, eukaryotes, and archaea: A conserved yet underappreciated aspect of microbial life. Infect. Immun.
80, 1948–1957 (2012).
2. S. Gill, R. Catchpole, P. Forterre, Extracellular membrane vesicles in the three domains of life and beyond. FEMS Microbiol. Rev. 43, 273–303 (2019).
on June 2, 2021
http://advances.sciencemag.org/
3. M. Toyofuku, N. Nomura, L. Eberl, Types and origins of bacterial membrane vesicles.
Nat. Rev. Microbiol. 17, 13–24 (2019).
4. K. Zhao, M. Bleackley, D. Chisanga, L. Gangoda, P. Fonseka, M. Liem, H. Kalra, H. Al Saffar, S. Keerthikumar, C. S. Ang, C. G. Adda, L. Jiang, K. Yap, I. K. Poon, P. Lock, V. Bulone, M. Anderson, S. Mathivanan, Extracellular vesicles secreted by Saccharomyces cerevisiae are involved in cell wall remodelling. Commun. Biol. 2, 305 (2019).
5. E. Marguet, M. Gaudin, E. Gauliard, I. Fourquaux, S. Le Blond Du Plouy, I. Matsui, P. Forterre, Membrane vesicles, nanopods and/or nanotubes produced by
hyperthermophilic archaea of the genus Thermococcus. Biochem. Soc. Trans. 41, 436–442 (2013).
6. G. Van Niel, G. D’Angelo, G. Raposo, Shedding light on the cell biology of extracellular vesicles. Nat. Rev. Mol. Cell Biol. 19, 213–228 (2018).
7. T. L. Whiteside, Tumor-Derived Exosomes and Their Role in Cancer Progression (Elsevier Inc., ed. 1, 2016), vol. 74.
8. H. M. Kulkarni, M. V. Jagannadham, Biogenesis and multifaceted roles of outer membrane vesicles from Gram-negative bacteria. Microbiology 160, 2109–2121 (2014).
9. S. Roier, F. G. Zingl, F. Cakar, S. Durakovic, P. Kohl, T. O. Eichmann, L. Klug, B. Gadermaier, K. Weinzerl, R. Prassl, A. Lass, G. Daum, J. Reidl, M. F. Feldman, S. Schild, A novel mechanism for the biogenesis of outer membrane vesicles in Gram-negative bacteria.
Nat. Commun. 7, 10515 (2016).
10. A. J. McBroom, A. P. Johnson, S. Vemulapalli, M. J. Kuehn, Outer membrane vesicle production by Escherichia coli is independent of membrane instability. J. Bacteriol. 188, 5385–5392 (2006).
11. M. Toyofuku, G. Cárcamo-Oyarce, T. Yamamoto, F. Eisenstein, C. C. Hsiao, M. Kurosawa, K. Gademann, M. Pilhofer, N. Nomura, L. Eberl, Prophage-triggered membrane vesicle formation through peptidoglycan damage in Bacillus subtilis. Nat. Commun. 8, 481 (2017).
12. L. Turnbull, M. Toyofuku, A. L. Hynen, M. Kurosawa, G. Pessi, N. K. Petty, S. R. Osvath, G. Cárcamo-Oyarce, E. S. Gloag, R. Shimoni, U. Omasits, S. Ito, X. Yap, L. G. Monahan, R. Cavaliere, C. H. Ahrens, I. G. Charles, N. Nomura, L. Eberl, C. B. Whitchurch, Explosive cell lysis as a mechanism for the biogenesis of bacterial membrane vesicles and biofilms.
Nat. Commun. 7, 11220 (2016).
13. J. Pospíšil, D. Vítovská, O. Kofroňová, K. Muchová, H. Šanderová, M. Hubálek, M. Šiková, M. Modrák, O. Benada, I. Barák, L. Krásný, Bacterial nanotubes as a manifestation of cell death. Nat. Commun. 11, 4963 (2020).
14. R. Kakarla, J. Hur, Y. J. Kim, J. Kim, Y. J. Chwae, Apoptotic cell-derived exosomes: Messages from dying cells. Exp. Mol. Med. 52, 1–6 (2020).
15. S. Caruso, I. K. H. Poon, Apoptotic cell-derived extracellular vesicles: More than just debris.
Front. Immunol. 9, 1486 (2018).
16. A. A. Baxter, T. K. Phan, E. Hanssen, M. Liem, M. D. Hulett, S. Mathivanan, I. K. H. Poon, Analysis of extracellular vesicles generated from monocytes under conditions of lytic cell death. Sci. Rep. 9, 7538 (2019).
17. F. Andreoni, M. Toyofuku, C. Menzi, R. Kalawong, M. Shambat, Antibiotics stimulate formation of vesicles in Staphylococcus aureus in both phage-dependent
and -independent fashions and via different routes. Antimicrob. Agents Chemother. 63, e01439-18 (2019).
18. J. L. Kadurugamuwa, T. J. Beveridge, Virulence factors are released from Pseudomonas aeruginosa in association with membrane vesicles during normal growth and exposure to gentamicin: A novel mechanism of enzyme secretion. J. Bacteriol. 177, 3998–4008 (1995).
19. S. H. Yun, E. C. Park, S. Y. Lee, H. Lee, C. W. Choi, Y. S. Yi, H. J. Ro, J. C. Lee, S. Jun, H. Y. Kim, G. H. Kim, S. Il Kim, Antibiotic treatment modulates protein components of cytotoxic outer membrane vesicles of multidrug-resistant clinical strain, Acinetobacter baumannii DU202. Clin. Proteomics 15, 28 (2018).
20. I. A. MacDonald, M. J. Kuehna, Stress-induced outer membrane vesicle production by Pseudomonas aeruginosa. J. Bacteriol. 195, 2971–2981 (2013).
21. M. H. Kim, S. Y. Kim, J. H. Son, S. Il Kim, H. Lee, S. Kim, M. Shin, J. C. Lee, Production of membrane vesicles by Enterococcus faecium cultured with or without subinhibitory concentrations of antibiotics and their pathological effects on epithelial cells. Front. Cell.
Infect. Microbiol. 9, 295 (2019).
22. N. S. Ab Razak, N. S. Ab Mutalib, M. A. Mohtar, N. Abu, Impact of chemotherapy on extracellular vesicles: Understanding the chemo-EVs. Front. Oncol. 9, 1113 (2019). 23. A. J. McBroom, M. J. Kuehn, Release of outer membrane vesicles by Gram-negative
bacteria is a novel envelope stress response. Mol. Microbiol. 63, 545–558 (2007). 24. T. Baumgarten, S. Sperling, J. Seifert, M. von Bergen, F. Steiniger, L. Y. Wick,
H. J. Heipieper, Membrane vesicle formation as a multiple-stress response mechanism enhances pseudomonas putida DOT-T1E cell surface hydrophobicity and biofilm formation. Appl. Environ. Microbiol. 78, 6217–6224 (2012).
25. N. Katsui, T. Tsuchido, R. Hiramatsu, S. Fujikawa, M. Takano, I. Shibasaki, Heat-induced blebbing and vesiculation of the outer membrane of Escherichia coli. J. Bacteriol. 151, 1523–1531 (1982).
26. R. Maredia, N. Devineni, P. Lentz, S. F. Dallo, J. Yu, N. Guentzel, J. Chambers, B. Arulanandam, W. E. Haskins, T. Weitao, Vesiculation from Pseudomonas aeruginosa under SOS. Sci. World J. 2012, 402919 (2012).
27. J. M. Bomberger, D. P. MacEachran, B. A. Coutermarsh, S. Ye, G. A. O’Toole, B. A. Stanton, Long-distance delivery of bacterial virulence factors by Pseudomonas aeruginosa outer membrane vesicles. PLOS Pathog. 5, e1000382 (2009).
28. M. Toyofuku, N. Nomura, What will membrane vesicles (MVs) bring to bacterial communication? Microbes Environ. 32, 185–187 (2017).
29. G. P. Dubey, S. Ben-Yehuda, Intercellular nanotubes mediate bacterial communication.
Cell 144, 590–600 (2011).
30. N. J. Bitto, R. Chapman, S. Pidot, A. Costin, C. Lo, J. Choi, T. D’Cruze, E. C. Reynolds, S. G. Dashper, L. Turnbull, C. B. Whitchurch, T. P. Stinear, K. J. Stacey, R. L. Ferrero, Bacterial membrane vesicles transport their DNA cargo into host cells. Sci. Rep. 7, 7072 (2017). 31. S. Domingues, K. M. Nielsen, Membrane vesicles and horizontal gene transfer in
prokaryotes. Curr. Opin. Microbiol. 38, 16–21 (2017).
32. S. Fulsundar, K. Harms, G. E. Flaten, P. J. Johnsen, B. A. Chopade, K. M. Nielsen, Gene transfer potential of outer membrane vesicles of Acinetobacter baylyi and effects of stress on vesiculation. Appl. Environ. Microbiol. 80, 3469–3483 (2014).
33. L. M. Mashburn, M. Whiteley, Membrane vesicles traffic signals and facilitate group activities in a prokaryote. Nature 437, 422–425 (2005).
34. M. J. Kuehn, N. C. Kesty, Bacterial outer membrane vesicles and the host-pathogen interaction. Genes Dev. 19, 2645–2655 (2005).
35. S. Brameyer, L. Plener, A. Müller, A. Klingl, G. Wanner, K. Jung, Outer membrane vesicles facilitate trafficking of the hydrophobic signaling molecule CAI-1 between Vibrio harveyi cells. J. Bacteriol. 200, e00740-17 (2018).
36. H. Yonezawa, T. Osaki, S. Kurata, M. Fukuda, H. Kawakami, K. Ochiai, T. Hanawa, S. Kamiya, Outer membrane vesicles of helicobacter pylori TK1402 are involved in biofilm formation.
BMC Microbiol. 9, 197 (2009).
37. A. Bitar, K. M. Aung, S. N. Wai, M. L. Hammarström, Vibrio cholerae derived outer membrane vesicles modulate the inflammatory response of human intestinal epithelial cells by inducing microRNA-146a. Sci. Rep. 9, 7212 (2019).
38. A. J. Manning, M. J. Kuehn, Contribution of bacterial outer membrane vesicles to innate bacterial defense. BMC Microbiol. 11, 258 (2011).
39. S. R. Schooling, T. J. Beveridge, Membrane vesicles: An overlooked component of the matrices of biofilms. J. Bacteriol. 188, 5945–5957 (2006).
40. C. M. Hampton, R. C. Guerrero-Ferreira, R. E. Storms, J. V. Taylor, H. Yi, P. A. Gulig, E. R. Wright, The opportunistic pathogen Vibrio vulnificus produces outer membrane vesicles in a spatially distinct manner related to capsular polysaccharide. Front. Microbiol.
8, 2177 (2017).
41. G. P. Dubey, G. B. Malli Mohan, A. Dubrovsky, T. Amen, S. Tsipshtein, A. Rouvinski, A. Rosenberg, D. Kaganovich, E. Sherman, O. Medalia, S. Ben-Yehuda, Architecture and characteristics of bacterial nanotubes. Dev. Cell 36, 453–461 (2016).
42. W. D. McCaig, A. Koller, D. G. Thanassi, Production of outer membrane vesicles and outer membrane tubes by Francisella novicida. J. Bacteriol. 195, 1120–1132 (2013). 43. V. N. Murthy, C. F. Stevens, Synaptic vesicles retain their identity through the endocytic
cycle. Nature 392, 497–501 (1998).
44. A. Jelínková, K. Malínská, S. Simon, J. Kleine-Vehn, M. Pařezová, P. Pejchar, M. Kubeš, J. Martinec, J. Friml, E. Zažímalová, J. Petrášek, Probing plant membranes with FM dyes: Tracking, dragging or blocking? Plant J. 61, 883–892 (2010).
45. S. L. N. Maas, X. O. Breakefield, A. M. Weaver, Extracellular vesicles: Unique intercellular delivery vehicles. Trends Cell Biol. 27, 172–188 (2017).
46. A. Bernadac, M. Gavioli, J. C. Lazzaroni, S. Raina, R. Lloubès, Escherichia coli tol-pal mutants form outer membrane vesicles. J. Bacteriol. 180, 4872–4878 (1998). 47. Y. Wang, The function of OmpA in Escherichia coli. Biochem. Biophys. Res. Commun. 292,
396–401 (2002).
48. D. I. Andersson, D. Hughes, Microbiological effects of sublethal levels of antibiotics.
Nat. Rev. Microbiol. 12, 465–478 (2014).
49. L. Sandegren, Selection of antibiotic resistance at very low antibiotic concentrations.
Ups. J. Med. Sci. 119, 103–107 (2014).
50. A. L. Starosta, J. Lassak, K. Jung, D. N. Wilson, The bacterial translation stress response.
FEMS Microbiol. Rev. 38, 1172–1201 (2014).
51. K. J. Aldred, R. J. Kerns, N. Osheroff, Mechanism of quinolone action and resistance.
Biochemistry 53, 1565–1574 (2014).
52. B. Michel, After 30 years of study, the bacterial SOS response still surprises us. PLOS Biol. 3, e255 (2005).
53. C. Cruickhank Miller, The Stokes-Einstein law diffusion. Proc. R. Soc. Lond. A 17, 724–748 (1924).
54. E. J. Calabrese, Hormesis: Path and progression to significance. Int. J. Mol. Sci. 19, 2871 (2018).
55. J. Casadesús, D. A. Low, Programmed heterogeneity: Epigenetic mechanisms in bacteria.
J. Biol. Chem. 288, 13929–13935 (2013).
on June 2, 2021
http://advances.sciencemag.org/
56. I. C. Blomfjeld, M. S. McClain, B. I. Eisenstein, Type 1 fimbriae mutants of Escherichia coli K12: Characterization of recognized afimbriate strains and construction of new fim deletion mutants. Mol. Microbiol. 5, 1439–1445 (1991).
57. J. J. Barr, R. Auro, N. Sam-Soon, S. Kassegne, G. Peters, N. Bonilla, M. Hatay, S. Mourtada, B. Bailey, M. Youle, B. Felts, A. Baljon, J. Nulton, P. Salamon, F. Rohwer, Subdiffusive motion of bacteriophage in mucosal surfaces increases the frequency of bacterial encounters. Proc. Natl. Acad. Sci. U.S.A. 112, 13675–13680 (2015).
58. E. Gullberg, S. Cao, O. G. Berg, C. Ilbäck, L. Sandegren, D. Hughes, D. I. Andersson, Selection of resistant bacteria at very low antibiotic concentrations. PLOS Pathog. 7, e1002158 (2011).
59. Z. Baharoglu, D. Mazel, Vibrio cholerae triggers SOS and mutagenesis in response to a wide range of antibiotics: A route towards multiresistance. Antimicrob. Agents
Chemother. 55, 2438–2441 (2011).
60. J. Bos, Q. Zhang, S. Vyawahare, E. Rogers, S. M. Rosenberg, R. H. Austin, Emergence of antibiotic resistance from multinucleated bacterial filaments. Proc. Natl. Acad. Sci. U.S.A.
112, 178–183 (2015).
61. E. Wistrand-Yuen, M. Knopp, K. Hjort, S. Koskiniemi, O. G. Berg, D. I. Andersson, Evolution of high-level resistance during low-level antibiotic exposure. Nat. Commun. 9, 1599 (2018).
62. J. Schindelin, I. Arganda-Carreras, E. Frise, V. Kaynig, M. Longair, T. Pietzsch, S. Preibisch, C. Rueden, S. Saalfeld, B. Schmid, J. Y. Tinevez, D. J. White, V. Hartenstein, K. Eliceiri, P. Tomancak, A. Cardona, Fiji: An open-source platform for biological-image analysis.
Nat. Methods 9, 676–682 (2012).
63. J. C. Crocker, D. G. Grier, Methods of digital video microscopy for colloidal studies.
J. Colloid Interface Sci. 179, 298–310 (1996).
64. J. E. Keymer, P. Galajda, G. Lambert, D. Liao, R. H. Austin, Computation of mutual fitness by competing bacteria. Proc. Natl. Acad. Sci. U.S.A. 105, 20269–20273 (2008). 65. Q. Zhang, G. Lambert, D. Liao, H. Kim, K. Robin, C. Tung, N. Pourmand, R. H. Austin,
Acceleration of emergence of bacterial antibiotic resistance in connected microenvironments. Science 333, 1764–1767 (2011).
66. G. Francius, P. Polyakov, J. Merlin, Y. Abe, J.-M. Ghigo, C. Merlin, C. Beloin, J. F. L. Duval, Bacterial surface appendages strongly impact nanomechanical and electrokinetic
properties of Escherichia coli cells subjected to osmotic stress. PLOS ONE 6, e20066 (2011).
Acknowledgments: We thank the Ghigo laboratory members (and former laboratory member
M. Yoshida) for helpful discussion and the gift of antibodies and strains. We thank G. Dumenil for valuable comments on the manuscript and T. Christenson for careful proofreading. J.B. and D.M. acknowledge the ultrastructural bioimaging facility (UtechS UBI) and UtechS Photonic BioImaging (Imagopole), Center for Technological Resources and Research (France BioImaging; funded by ANR-10–INSB–04; Investments for the Future) at the Institut Pasteur. J.B. thanks S. Brule for assistance with DLS analysis and J. Wong-Ng and J. Fernandes for technical support in fluorescence microscopy. Funding: This work was supported by Institut Pasteur, Centre National de la Recherche Scientifique, French Government’s Investissement d’Avenir program Laboratoire d’Excellence ‘Integrative Biology of Emerging Infectious Diseases’ [ANR-10-LABX-62- IBEID], and the French National Research Agency (ANR Unibac ANR-17-CE13-0010-01). L.H.C. acknowledges funding and support from the Arizona Cancer Evolution Center in the Biodesign Center for Biocomputing, Security and Society at Arizona State University. Author contributions: J.B. conceived the research and performed the experiments. L.H.C. designed the analytic tools. J.B. and L.H.C. analyzed the data and wrote the paper. D.M. funded the research. All authors read, amended the manuscript, and approved its final version. Competing interests: The authors declare that they have no competing interests. Data and materials availability: All data needed to evaluate the conclusions in the paper are present in the paper and/or the Supplementary Materials. Additional data related to this paper may be requested from the authors.
Submitted 2 June 2020 Accepted 1 December 2020 Published 20 January 2021 10.1126/sciadv.abd1033
Citation: J. Bos, L. H. Cisneros, D. Mazel, Real-time tracking of bacterial membrane vesicles reveals enhanced membrane traffic upon antibiotic exposure. Sci. Adv. 7, eabd1033 (2021).
on June 2, 2021
http://advances.sciencemag.org/
DOI: 10.1126/sciadv.abd1033 (4), eabd1033. 7
Sci Adv
ARTICLE TOOLS http://advances.sciencemag.org/content/7/4/eabd1033
MATERIALS
SUPPLEMENTARY http://advances.sciencemag.org/content/suppl/2021/01/14/7.4.eabd1033.DC1
REFERENCES
http://advances.sciencemag.org/content/7/4/eabd1033#BIBL
This article cites 65 articles, 20 of which you can access for free
PERMISSIONS http://www.sciencemag.org/help/reprints-and-permissions
Terms of Service
Use of this article is subject to the
is a registered trademark of AAAS.
Science Advances
York Avenue NW, Washington, DC 20005. The title
(ISSN 2375-2548) is published by the American Association for the Advancement of Science, 1200 New
Science Advances
BY).
Science. No claim to original U.S. Government Works. Distributed under a Creative Commons Attribution License 4.0 (CC Copyright © 2021 The Authors, some rights reserved; exclusive licensee American Association for the Advancement of
on June 2, 2021
http://advances.sciencemag.org/