cambridge.org/psm
Original Article
*Joint first author†For a full list of collaborators, see Appendix Cite this article:Quattrone D et al (2019). Transdiagnostic dimensions of
psychopathology at first episode psychosis: findings from the multinational EU-GEI study. Psychological Medicine 49, 1378–1391. https:// doi.org/10.1017/S0033291718002131 Received: 27 January 2018 Revised: 1 July 2018 Accepted: 24 July 2018
First published online: 4 October 2018 Keywords:
Bifactor model; diagnostic categories; first episode psychosis; psychopathology; symptom dimensions
Author for correspondence:
Diego Quattrone, E-mail:diego.quattrone@kcl. ac.uk
© Cambridge University Press 2018. This is an Open Access article, distributed under the terms of the Creative Commons Attribution licence (http://creativecommons.org/licenses/ by/4.0/), which permits unrestricted re-use, distribution, and reproduction in any medium, provided the original work is properly cited.
psychopathology at first episode psychosis:
findings from the multinational EU-GEI study
Diego Quattrone
1,2,*
, Marta Di Forti
1,2,*
, Charlotte Gayer-Anderson
3,
Laura Ferraro
4, Hannah E Jongsma
5, Giada Tripoli
6, Caterina La Cascia
4,
Daniele La Barbera
4, Ilaria Tarricone
7, Domenico Berardi
7, Andrei Szöke
8,
Celso Arango
9, Antonio Lasalvia
10, Andrea Tortelli
11, Pierre-Michel Llorca
12,
Lieuwe de Haan
13, Eva Velthorst
13, Julio Bobes
14, Miguel Bernardo
15,
Julio Sanjuán
16, Jose Luis Santos
17, Manuel Arrojo
18, Cristina Marta Del-Ben
19,
Paulo Rossi Menezes
20, Jean-Paul Selten
21,22, EU-GEI WP2 Group
†
,
Peter B Jones
5,23, James B Kirkbride
24, Alexander L Richards
25,
Michael C O’Donovan
25, Pak C Sham
26,27, Evangelos Vassos
1, Bart PF Rutten
22,
Jim van Os
6,22,28, Craig Morgan
2,3, Cathryn M Lewis
1, Robin M Murray
2,6and Ulrich Reininghaus
3,22,291Social, Genetic and Developmental Psychiatry Centre, Institute of Psychiatry, Psychology and Neuroscience, King’s
College London, London SE5 8AF, UK;2National Institute for Health Research (NIHR) Mental Health Biomedical Research Centre at South London and Maudsley NHS Foundation Trust and King's College London, UK;3Department of Health Service and Population Research, Institute of Psychiatry, King’s College London, De Crespigny Park, Denmark Hill, London SE5 8AF, UK;4Department of Experimental Biomedicine and Clinical Neuroscience, University of Palermo, Via G. La Loggia 1, 90129 Palermo, Italy;5Department of Psychiatry, University of Cambridge, Herchel Smith Building for Brain & Mind Sciences, Forvie Site, Robinson Way, Cambridge, CB2 0SZ, UK;6Department of Psychosis Studies, Institute of Psychiatry, King’s College London, De Crespigny Park, Denmark Hill, London SE5 8AF, UK;7Department of Medical and Surgical Science, Psychiatry Unit, Alma Mater Studiorum Università di Bologna, Viale Pepoli 5, 40126 Bologna, Italy;8INSERM, U955, Equipe 15, 51 Avenue de Maréchal de Lattre de Tassigny, 94010 Créteil, France;9Department of Child and Adolescent Psychiatry, Hospital General Universitario Gregorio Marañón, School of Medicine, Universidad Complutense, IiSGM (CIBERSAM), C/Doctor Esquerdo 46, 28007 Madrid, Spain;
10
Section of Psychiatry, Azienda Ospedaliera Universitaria Integrata di Verona, Piazzale L.A. Scuro 10, 37134 Verona, Italy;11Etablissement Public de Santé Maison Blanche, Paris 75020, France;12Université Clermont Auvergne, EA 7280, Clermont-Ferrand 63000, France;13Department of Psychiatry, Early Psychosis Section, Academic Medical Centre, University of Amsterdam, Meibergdreef 5, 1105 AZ Amsterdam, The Netherlands;14Department of Medicine, Psychiatry Area, School of Medicine, Universidad de Oviedo, Centro de Investigación Biomédica en Red de Salud Mental (CIBERSAM), C/Julián Clavería s/n, 33006 Oviedo, Spain;15Barcelona Clinic Schizophrenia Unit, Neuroscience Institute, Hospital clinic, Department of Medicine, University of Barcelona, IDIBAPS, CIBERSAM, Barcelona, Spain;
16
Department of Psychiatry, School of Medicine, Universidad de Valencia, Centro de Investigación Biomédica en Red de Salud Mental (CIBERSAM), C/Avda. Blasco Ibáñez 15, 46010 Valencia, Spain;17Department of Psychiatry, Servicio de Psiquiatría Hospital“Virgen de la Luz”, C/Hermandad de Donantes de Sangre, 16002 Cuenca, Spain;
18
Department of Psychiatry, Psychiatric Genetic Group, Instituto de Investigación Sanitaria de Santiago de Compostela, Complejo Hospitalario Universitario de Santiago de Compostela, Spain;19Division of Psychiatry, Department of Neuroscience and Behaviour, Ribeirão Preto Medical School, University of São Paulo, São Paulo, Brazil;20Department of Preventative Medicine, Faculdade de Medicina FMUSP, University of São Paulo, São Paulo, Brazil;21Rivierduinen Institute for Mental Health Care, Sandifortdreef 19, 2333 ZZ Leiden, The Netherlands;
22
Department of Psychiatry and Neuropsychology, School for Mental Health and Neuroscience, South Limburg Mental Health Research and Teaching Network, Maastricht University Medical Centre, P.O. Box 616, 6200 MD Maastricht, The Netherlands;23CAMEO Early Intervention Service, Cambridgeshire & Peterborough NHS Foundation Trust, Cambridge, CB21 5EF, UK;24Psylife Group, Division of Psychiatry, University College London, 6th Floor, Maple House, 149 Tottenham Court Road, London W1T 7NF, UK;25Division of Psychological Medicine and Clinical Neurosciences, MRC Centre for Neuropsychiatric Genetics and Genomics, Cardiff University, Cardiff CF24 4HQ, UK;
26
Department of Psychiatry, the University of Hong Kong, Hong Kong, China;27Centre for Genomic Sciences, Li KaShing Faculty of Medicine, The University of Hong Kong, Hong Kong, China;28Brain Centre Rudolf Magnus, Utrecht University Medical Centre, Utrecht, The Netherlands and29Central Institute of Mental Health, Medical Faculty Mannheim, University of Heidelberg, Mannheim, Germany
Abstract
Background.
The value of the nosological distinction between non-affective and affective
psychosis has frequently been challenged. We aimed to investigate the transdiagnostic
dimen-sional structure and associated characteristics of psychopathology at First Episode Psychosis
(FEP). Regardless of diagnostic categories, we expected that positive symptoms occurred
more frequently in ethnic minority groups and in more densely populated environments,
and that negative symptoms were associated with indices of neurodevelopmental impairment.
Method.
This study included 2182 FEP individuals recruited across six countries, as part of
the EUropean network of national schizophrenia networks studying Gene–Environment
Interactions (EU-GEI) study. Symptom ratings were analysed using multidimensional item
response modelling in Mplus to estimate five theory-based models of psychosis. We used
mul-tiple regression models to examine demographic and context factors associated with symptom
dimensions.
Results.
A bifactor model, composed of one general factor and five specific dimensions of
positive, negative, disorganization, manic and depressive symptoms, best-represented
associa-tions among ratings of psychotic symptoms. Positive symptoms were more common in ethnic
minority groups. Urbanicity was associated with a higher score on the general factor. Men
presented with more negative and less depressive symptoms than women. Early
age-at-first-contact with psychiatric services was associated with higher scores on negative, disorganized,
and manic symptom dimensions.
Conclusions.
Our results suggest that the bifactor model of psychopathology holds across
diagnostic categories of non-affective and affective psychosis at FEP, and demographic and
context determinants map onto general and specific symptom dimensions. These findings
have implications for tailoring symptom-specific treatments and inform research into the
mood-psychosis spectrum.
Introduction
Current nosology classifies the observed manifestations of
psych-osis into two main categories of non-affective (e.g. schizophrenia,
schizoaffective disorder) and affective psychosis (e.g. bipolar and
major depressive disorders with psychotic features) (World
Health Organization,
1992
; American Psychiatric Association,
2013
). However, the scientific accessibility of discrete
‘natural
dis-ease entities
’ in psychiatry has been questioned since Kraepelin’s
original distinction between dementia praecox and
manic-depressive psychosis (Kraepelin,
1899
; Murray et al.,
2004
;
Craddock and Owen,
2005
; Hoff,
2017
). On this basis, it has
been proposed, and is now widely accepted, that the categorical
classification system alone is too reductionist to explain the
com-plexity of psychotic phenomena (Van Os et al.,
1999
; Linscott and
van Os,
2010
). Various evidence-based perspectives might
sup-port a scheme incorporating symptom dimensions in psychotic
disorders, as a possible approach to address the following
limita-tions of categorical distinclimita-tions.
First, the dichotomous model of non-affective and affective
psychosis does not fit the cases presenting with both prominent
mood and psychotic symptoms. This is testified by the notion
of a third category of schizoaffective disorder (Kasanin,
1933
),
which nevertheless implies further nosological challenges
(Abrams et al.,
2008
).
In addition, if criteria-based classification systems could
iden-tify genuine disorders within the psychosis spectrum, the
diag-nostic overlap would be relevant to only a few patients. On the
contrary, there is a large comorbidity index between
schizophre-nia, schizoaffective, bipolar, and major depressive disorders
(Laursen et al.,
2009
; Upthegrove et al.,
2017
). Similarly, the
10-year
outcomes
of
the
Aetiology
and
Ethnicity
in
Schizophrenia and Other Psychoses (ÆSOP-10) study showed
that diagnoses within psychosis other than schizophrenia at
base-line tend to be unstable over time (Heslin et al.,
2015
).
Also, the dichotomous model is neither consistent with family
studies showing familial co-aggregation of non-affective and
affective psychosis (Cardno et al.,
2002
; Lichtenstein et al.,
2009
; Chou et al.,
2017
) nor with the accumulated evidence
from genome-wide association studies that genetic risk is in
part shared among schizophrenia, bipolar disorder, and major
depressive disorder (International Schizophrenia Consortium
et al.,
2009
; Demjaha et al.,
2011
; Cardno and Owen,
2014
;
O
’Donovan and Owen,
2016
; Power et al.,
2017
).
Last, several studies show the efficacy of agents which impact
on dopamine signalling in the treatment of both non-affective
and affective symptoms. For example, antipsychotics antagonise
D2-receptor functioning and are used in bipolar disorder and
schizophrenia (Post,
1999
; Taylor et al.,
2015
), and clozapine is
prescribed for both treatment-resistant bipolar disorder and
schizo-phrenia (Li et al.,
2015
; Goodwin et al.,
2016
; Howes et al.,
2016
).
These findings suggest that dopamine dysregulation may contribute
to both positive and manic symptoms, as supported by recent
posi-tron emission tomographic findings (Jauhar et al.,
2017
).
Taken together, the above evidence challenges the binary
cat-egorization of non-affective and affective psychosis, enhancing
research into non-categorical approaches. Pioneering studies
using factor analysis examined associations among non-affective
symptoms in schizophrenia and showed that these symptoms
seg-regated in three groups (Liddle,
1987
); however, these groups
could not accommodate the whole symptom diversity in
schizo-phrenia (Kay and Sevy,
1990
). Thus, psychopathology models
including also depressive and manic factors were proposed and
replicated
in
schizophrenia
(Lindenmayer
et
al.,
1994
;
Salokangas,
1997
; Wickham et al.,
2001
; Wallwork et al.,
2012
).
This type of structure was likewise confirmed in psychotic
disor-ders (Salokangas,
2003
; Dikeos et al.,
2006
; Demjaha et al.,
2009
),
and in a sample of bipolar patients (Lindenmayer et al.,
2008
).
Hence, its validity across the spectrum of non-affective and
affect-ive psychosis has been consistently supported.
Recent findings suggest a more fundamental general,
trans-diagnostic dimension encompassing non-affective and affective
symptoms, in addition to five specific symptom dimensions
(Reininghaus et al.,
2013
; Reininghaus et al.,
2016
; Shevlin
et al.,
2017
). This conceptualization statistically reflects a bifactor
model, with one general factor representing shared variance
among all symptoms, and a set of specific factors where the
remainder of the variance is shared among subsets of symptoms
(Reise et al.,
2007
). This is the first study set to investigate, in
an incidence sample of First Episode Psychosis (FEP) patients:
(1) whether the general psychosis dimension holds across
diagnostic categories of non-affective psychosis (i.e.
schizophre-nia, schizoaffective disorder) and affective psychosis (i.e. bipolar
and major depressive disorder with psychotic features); (2)
whether formation of specific symptom dimensions is justified
in addition to a general psychosis dimension; and (3) the
associ-ation of demographic characteristics (i.e. age, gender, ethnicity),
social context (i.e. urbanicity), and clinical factors (i.e. diagnosis)
with general and specific psychosis dimensions.
The hypotheses underlying the third aim, based on the existing
literature, were:
(a) Positive symptoms would be more common in ethnic
minor-ity groups and in people living in more densely populated
environments (van Os et al.,
2001
, Janssen et al.,
2003
).
(b) Negative symptoms would be associated with indices
suggest-ive of neurodevelopment impairment in psychosis (Limosin,
2014
; Patel et al.,
2015
), such as being a man or having an
early age at onset.
Methods
Sample design and procedures
Individuals suffering from their FEP were recruited between 2010
and 2015 as part of the large EUropean network of national
schizophrenia
networks
studying
Gene
–Environment
Interactions (EU-GEI) study (
http://www.eu-gei.eu
). Specifically,
FEP individuals were recruited as part of the
‘Functional
Enviromics’ work package, which consisted of an incidence and
a case-sibling-control study conducted across six countries with
the aim to investigate clinical, genetic, and environmental
inter-action in the development of psychotic disorders.
The study had 17 catchment areas, including urban and less
urban populations: Southeast London, Cambridgeshire and
Peterborough (England); central Amsterdam, Gouda and
Voorhout (the Netherlands); part of the Veneto region, Bologna
municipality, city of Palermo (Italy); 20th arrondissement of
Paris, Val-de-Marne, Puy-de-Dôme (France); Madrid (Vallecas),
Barcelona, Valencia, Oviedo, Santiago, Cuenca (Spain); and
Ribeirão Preto (Brazil).
Participants
We screened all subjects who were referred to mental healthcare
services with a suspicion of psychosis. The ascertainment period
of cases ranged from 12 months in London to 48 months in
Val-de-Marne and Bologna, with a median of 25 months. In
each site, a psychiatrist experienced in epidemiology research
oversaw the local team, which was centrally trained to minimize
non-differential recruitment bias in the different healthcare
sys-tems. Written consent was obtained from the subjects who agreed
to take part of the case-sibling-control study. For incidence-only
cases, local research ethics committees approved the extraction
of demographics and clinical information from patient records.
More detailed information is available on the EU-GEI core
paper on the incidence rates of schizophrenia and other psychotic
disorders (Jongsma et al.,
2018
).
Patients were included in the current study if they met the
fol-lowing criteria during the recruitment period: (a) aged between 18
and 64 years; (b) presentation with a clinical diagnosis for an
untreated FEP, even if longstanding [International Statistical
Classification of Diseases and Related Health Problems, Tenth
Revision (ICD-10) codes F20-F33]; (c) resident within the
catch-ment area at FEP. Exclusion criteria were: (a) previous contact
with psychiatric services for psychosis; (b) psychotic symptoms
with any evidence of organic causation; and (c) transient
psych-otic symptoms resulting from acute intoxication (ICD-10: F1x.5).
Measures
Data on age, gender, and ethnicity was collected using a modified
version of the Medical Research Council Sociodemographic
Schedule (Mallett,
1997
). Ethnicity was defined as self-reported.
Country of heritage or birth was used as a proxy for ethnicity
in people of a North African background. The OPerational
CRITeria (OPCRIT) system (McGuffin et al.,
1991
; Williams
et al.,
1996
) was used by centrally trained investigators, whose
reliability was assessed throughout the study (κ = 0.7). The
OPCRIT system allows to: (1) assess the pre-morbid history and
current mental state; and (2) establish the diagnosis of psychotic
disorders based on algorithms for several diagnostic classification
systems. It consists of a checklist which can be filled using
differ-ent sources, e.g. case records or clinical interviews. Fifty-nine
items relate to the mental state examination. We used diagnoses
based on Research Diagnostic Criteria (RDC) (Spitzer et al.,
1978
), since this classification system provides a better
represen-tation of schizoaffective disorder, which is a common
presenta-tion in clinical practice. OPCRIT RDC-based diagnoses have a
good-to-excellent agreement with best-estimate consensus
diag-nostic procedures (Craddock et al.,
1996
). In each catchment
area, population density was computed as a number of
inhabi-tants per square kilometre, based on official population estimates.
Statistical analysis
Psychopathology items were dichotomized as 0
‘absent’ or 1
‘present’. In order to ensure sufficient covariance coverage for
item response modelling, we used the items with a valid frequency
of
‘present’ ⩾10% in our sample, which included individuals with
⩽20 missing values in the psychopathology rating. OPCRIT data
used in the analysis contained missing values, which we assumed
to be missing at random, allowing for the maximum likelihood
estimator to provide unbiased estimates. We performed
multidi-mensional item response modelling in Mplus, version 7.4
(Muthén and Muthén,
2012
) to estimate unidimensional,
multidi-mensional, bifactor, and second-order models of psychosis.
Extending previous analyses of OPCRIT data in individuals
with enduring psychosis (Reininghaus et al.,
2016
), we estimated
five alternative item-response models (online Supplementary
Fig. S1): (a) a unidimensional model with one unique general
factor (model A), which is consistent with the pre-Kraepelinian
unitary concept of psychosis (Berrios and Beer,
1994
); (b) a
multi-dimensional model with five uncorrelated specific factors of
posi-tive, negaposi-tive, disorganization, manic, and depressive symptoms
(model B); (c) a multidimensional model with five correlated
spe-cific factors (model C), which, together with model B, is
consist-ent with the pconsist-entagonal psychosis model (van Os and Kapur,
2009
); (d) a bifactor model with one general latent factor along
with five uncorrelated specific factors (model D) (Reininghaus
et al.,
2016
); and (e) a hierarchical model with five first-order
spe-cific factors and one general second-order factor (model E),
which, as model D, is consistent with the notion of a
transdiagno-tic spectrum of non-affective and affective psychosis (Craddock
and Owen,
2005
; Reininghaus et al.,
2016
). Some previous
OPCRIT exploratory analysis showed a combined
negative/disor-ganization dimension (Serretti et al.,
2001
; Fanous et al.,
2005
).
We did not have a strong theoretical rationale for testing such a
structure in a confirmatory analysis. By contrast, we considered
specific negative symptoms as a clinically observable marker of
neurodevelopmental impairment in psychosis (Limosin,
2014
).
The five models were compared using Log-Likelihood (LL),
Akaike Information Criterion (AIC), Bayesian Information
Criterion (BIC), and Sample-size Adjusted BIC (SABIC) as
model fit statistics. For the model showing the best fit, we
calcu-lated reliability and strength indices, such as McDonald
’s omega
(
ω), omega hierarchical (ω
H), and index H. Coefficient
ω is an
estimate of the proportion of common variance accounted by
general and specific symptom dimensions. Coefficient
ω
His an
estimate of the proportion of reliable variance accounted by the
general dimension, treating variability in scores due to specific
dimensions as measurement error (Rodriguez et al.,
2016b
).
Ωh
formula can be extended to each specific factor, i.e. treating
vari-ability in scores due to the general factor as a measurement error,
to compute omega hierarchical for subscales. Based on omega and
omega hierarchical coefficients, which can vary from 0 to 1, we
computed the ratios of
ω/ω
H, namely the relative omega, as the
amount of reliable variance explained in the observed scores
attributable to (1) the general factor independently from the
spe-cific symptom dimensions, and (2) each spespe-cific symptom
dimen-sion independently from the general factor. To estimate the extent
to which symptom dimensions were represented by their own set
of OPCRIT items and their replicability across studies, we
com-puted the construct reliability index H (Hancock and Mueller,
2001
). The index H ranges from 0 to 1, with values closer to 1
indicating better reliability and replicability (Rodriguez et al.,
2016a
). Quantitative scores for all symptom dimensions were
cal-culated using the
‘FSCORES’ function in Mplus.
Further, we examined the diagnostic classification accuracy
based on general and specific symptom dimension scores using
multinomial receiver operating characteristic (ROC) analysis in
STATA 14 (StataCorp,
2015
). In addition, we performed a
sensi-tivity analysis, examining subjects with item ratings based on
face-to-face interview and based on clinical records separately.
We used multiple linear regression to examine the association
between factor scores of general and/or specific psychosis
dimen-sions as the outcome variable and demographic variables,
includ-ing gender, age-at-first-contact with psychiatric services, ethnicity,
and diagnosis as covariates. Country and assessment method were
treated as a priori confounders.
To examine the individual-level effect of urbanicity on
symp-tom dimension scores, standardized population density values
were used as a continuous independent variable, while controlling
the analysis for gender, age-at-first-contact, ethnicity, diagnosis,
and assessment method. Sensitivity analysis included post-hoc
multiple regressions within each country, where population
dens-ity was dichotomized at its median as a dummy variable for
urbanicity.
Results
Sample characteristics
We identified 2774 treated incidence cases of psychosis (Jongsma
et al.,
2018
), of whom 2182 had (complete or missing at random)
OPCRIT data available for analysis under the provision of local
research ethics committees (
Table 1
). OPCRIT item ratings
were completed based on face-to-face assessment for 51%
(n = 1112) and based on clinical records for 49% (n = 1070) of
the sample. The sample prevalence of psychotic symptoms is
presented in Supplementary Table S1.
Fifty-seven per cent of FEP were men. Subjects were mostly
people of a White ethnicity. Other main ethnic groups included
Black African and Black Caribbean, North African, Mixed, and
Asian. Mean age-at-first-contact with psychiatric services was
32.1 years; this was lower in men (M = 30.1) compared with
women (M = 34.7; t =
−9.6, p < 0.001). Age-at-first-contact
dif-fered across ethnic groups, with individuals of Black ethnicity
(M = 29) being younger than individuals of White ethnicity (M
= 32.7; F = 7.72, p < 0.001). The most common RDC-based
diag-nosis was broad or narrow schizophrenia (38.6%), followed by
schizoaffective disorders (35%), unspecified non-organic
psych-otic disorder (16.3%), bipolar disorder (5.9%), and psychpsych-otic
depression (4.2%).
Symptom dimensions in the EU-GEI sample
The bifactor model was the best fit for the OPCRIT symptom data
compared with all other models, as consistently indicated by each
of the model fit statistics (
Table 2
), and explained 54% of the total
variance.
Figure 1
shows that, within the bifactor model, general and
specific dimensions accounted for 93% of the common variance.
Overall, statistical indices derived from the bifactor model suggest
that its explained variance was due to individual differences in
both general and specific symptom dimensions, which therefore
might complement each other in reflecting the
psychopatho-logical structure at FEP. This is illustrated by the relative omega
coefficients, which, for example, showed that 47% of the reliable
variance was due to the general factor when partitioning out
the variability in scores due to the specific factors (
Fig. 1
). High
H values were consistently observed for all latent factors,
indicat-ing that they were well defined, and that the bifactor model had
high reliability and replicability (
Fig. 1
). Sensitivity analysis
showed that the bifactor model was the best fit for the OPCRIT
data in both the assessment methods (online Supplementary
Tables S2.1 and S2.2).
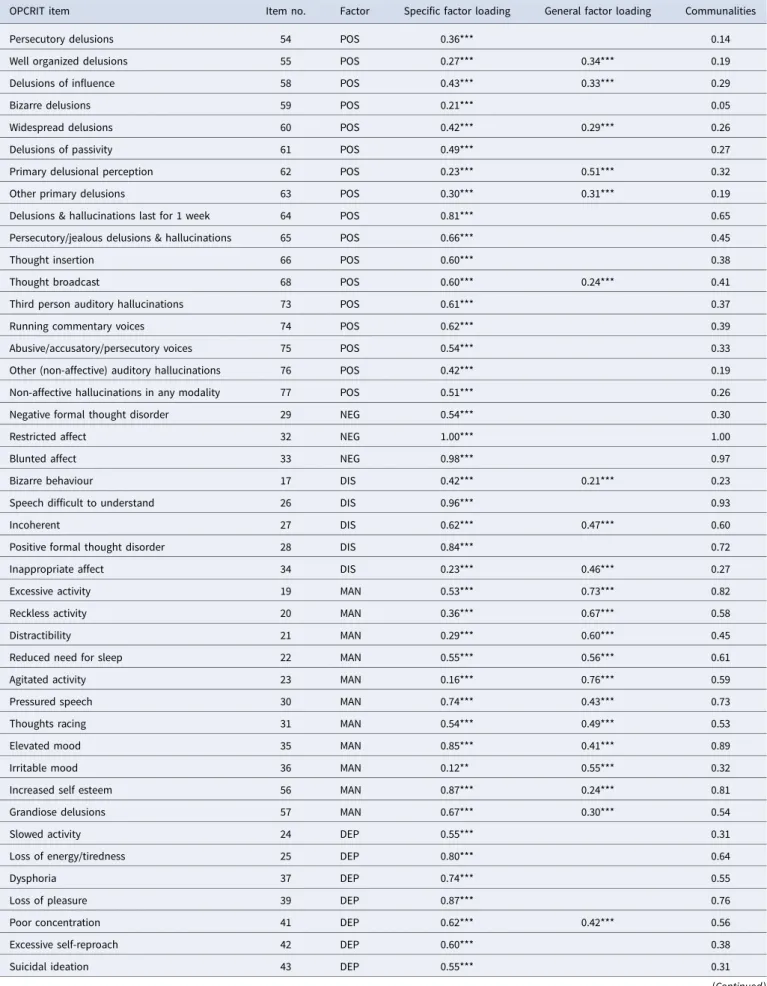
Symptom dimensions and item factor loadings
Table 3
shows standardized factor loadings for the bifactor model.
On the general dimension, a positive factor loading was observed
for all OPCRIT items with statistically significant loadings. In
addition, the magnitude of factor loadings of items on the general
dimension was small, except for some manic/delusional items for
which loadings of moderate magnitude were observed. On the
specific dimensions, most of the items showed moderate to strong
positive loadings. Finally, latent factor scores were strongly and
positively associated with simplified weighted OPCRIT sum scores
for use in clinical practice (online Supplementary Table S3).
Symptom dimensions and categorical diagnoses
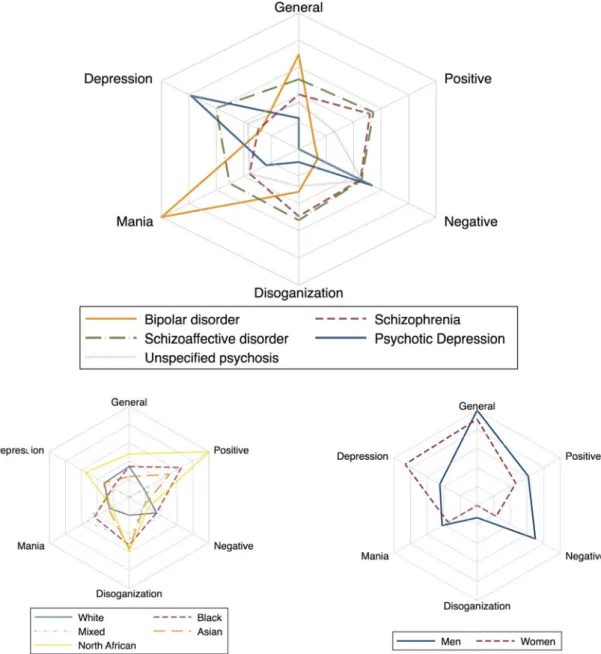
Findings from regression analyses are shown in
Table 4
and
pre-dicted symptom dimension scores for each RDC-based diagnostic
category are reported in
Fig. 2
. Compared with bipolar disorder,
factor scores for the positive dimension were moderately higher
in schizophrenia and schizoaffective disorder; factor scores for
the negative dimension were moderately higher in schizophrenia,
schizoaffective and psychotic depression; and factor scores for the
depressive dimension were markedly higher in psychotic
depres-sion and schizoaffective disorder. Bipolar disorder showed the
highest factor scores for the manic and the general dimensions.
Dimension scores based on ICD diagnostic categories are
pre-sented in Supplementary Fig. S2 and Supplementary Table S4.
Finally, ROC analysis showed that classification accuracy into
RDC categories based on general and specific symptom
dimen-sion scores was markedly higher for patients with
psychopath-ology rating based either on face-to-face interview (95% CI
0.54
–0.63) or case note review (95% CI 0.56–0.65), compared
with a classification by chance (95% 0.32
–0.41). Moreover,
symp-tom dimensions showed similar diagnostic classification accuracy
across countries (online Supplementary Figs S3.1 and S3.2).
Symptom dimensions by gender, age-at-first-contact, and
ethnicity
Findings on factor scores by gender, age-at-first-contact, and
eth-nicity, are shown in
Fig. 2
and
Table 4
. Early age-at-first-contact
was associated with higher scores for the general, negative,
disorganized, and manic symptom dimensions, and with lower
scores for the depressive symptom dimension. Men showed
fewer depressive symptoms and more negative symptoms than
women, even after adjusting the analysis for several confounders.
Table 4
further shows that participants of Black and North
African ethnicity presented with higher scores on the positive
symptom dimension compared with an individual of White
eth-nicity. Finally, higher scores for the disorganization dimension
and lower scores for the depressive dimension were observed in
Black compared with White ethnicity. Noteworthy, the magnitude
of the effect was small for all the results.
Symptom dimensions by urbanicity
A moderate positive association was observed for more densely
populated environments and the general dimension score.
Table 4
further shows a weaker positive association between
population density and specific negative, disorganization, and
manic symptom dimensions. Post-hoc analysis of symptom
dimensions within countries showed that positive symptoms
were more common in urban study sites in the UK (i.e. London
v. Cambridge), whereas a negative association was observed in
Spain (online Supplementary Table S5).
Discussion
Principal findings
This is the first study on general and specific symptom
dimen-sions in an incidence sample of psychosis. First, we found in
our FEP sample that manic and delusional symptoms primarily
underlie the identified general psychosis factor across diagnostic
categories of non-affective and affective psychosis. Second,
find-ings showed that specific dimensions of positive, negative,
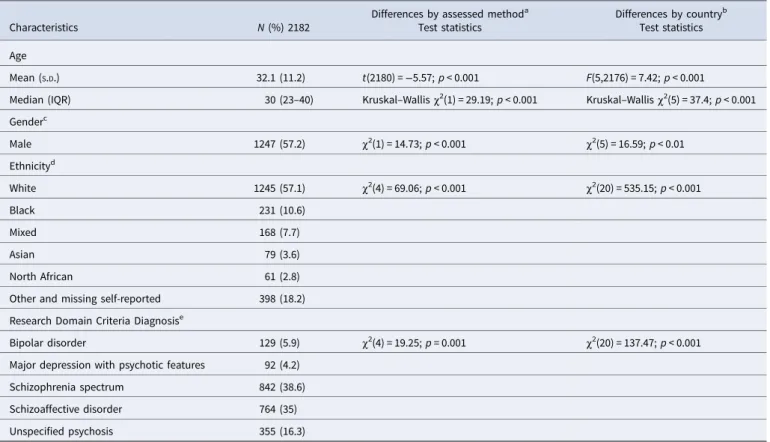
Table 1.Demographic and clinical characteristics of the sample included in the factor analysis
Characteristics N (%) 2182
Differences by assessed methoda Test statistics
Differences by countryb Test statistics Age
Mean (S.D.) 32.1 (11.2) t(2180) =−5.57; p < 0.001 F(5,2176) = 7.42; p < 0.001
Median (IQR) 30 (23–40) Kruskal–Wallis χ2(1) = 29.19; p < 0.001 Kruskal–Wallis χ2(5) = 37.4; p < 0.001
Genderc Male 1247 (57.2) χ2(1) = 14.73; p < 0.001 χ2(5) = 16.59; p < 0.01 Ethnicityd White 1245 (57.1) χ2(4) = 69.06; p < 0.001 χ2(20) = 535.15; p < 0.001 Black 231 (10.6) Mixed 168 (7.7) Asian 79 (3.6) North African 61 (2.8)
Other and missing self-reported 398 (18.2) Research Domain Criteria Diagnosise
Bipolar disorder 129 (5.9) χ2(4) = 19.25; p = 0.001 χ2(20) = 137.47; p < 0.001
Major depression with psychotic features 92 (4.2)
Schizophrenia spectrum 842 (38.6)
Schizoaffective disorder 764 (35)
Unspecified psychosis 355 (16.3)
aPsychopathology assessment methods included face-to-face interview or review of clinical notes.
bStudy countries were England, the Netherlands, France, Spain, Italy, and Brazil.
c29 missing values excluded from tabulation and age analysis.
dOther and missing self-reported groups excluded from ethnicity analysis.
eSchizophrenia spectrum encompassed Broad Schizophrenia (N = 194) and Narrow Schizophrenia (N = 648); Schizoaffective disorder encompassed Schizoaffective/manic (N = 112);
disorganized, manic and depressive symptoms are
complemen-tary to the general dimension. Third, general and specific
symp-tom dimensions discriminated well between diagnoses of
psychotic disorders. Forth, positive symptoms were more
com-mon acom-mong individuals of Black and North African ethnicity.
Fifth, there was some evidence that early age-at-first-contact
was associated with higher scores for several dimensions, such
as of negative, disorganised and manic symptoms. Sixth, men
pre-sented with more negative and less depressive symptoms than
women. Finally, higher scores for the general dimension were
observed for individuals living in urban neighbourhoods.
Limitations
Before interpreting our findings, we must consider potential
lim-itations. Symptoms were rated with a semi-structured face-to-face
interview or from case note review. Still, study investigators
underwent a specific and centrally organized training for
OPCRIT and demonstrated good inter-rater reliability for
individ-ual item ratings; moreover, OPCRIT is a tool specifically designed
to allow use with different sources (McGuffin et al.,
1991
; Cardno
et al.,
1996
; Rucker et al.,
2011
). However, we found consistently
lower symptom ratings using case note review compared with
face-to-face interviews. It is possible that clinicians failed to
record all symptoms; alternatively, patients presenting with less
severe psychopathology had a shorter contact with services, and
therefore less chances to be interviewed by researchers. Whether
or not differences in ratings are genuine or a surrogate of different
sources of item ratings, we treated this potential bias as artificial
confounding of our findings and adjusted all analyses for the
type of assessment method. On the other hand, the use of an
inci-dence sample allowed the best possible approximation of the true
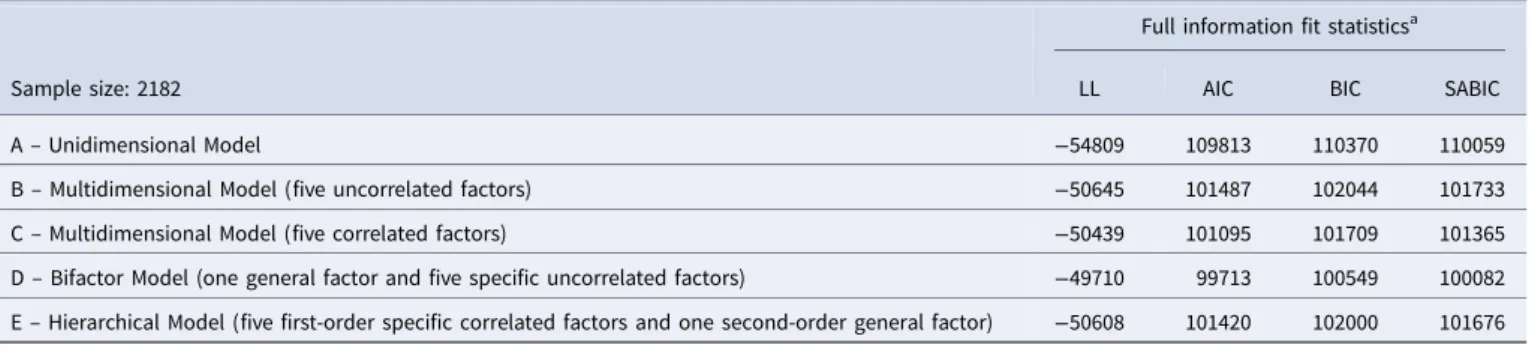
Table 2.Model fit statistics of unidimensional, multidimensional, bi-factor, and second-order models
Sample size: 2182
Full information fit statisticsa
LL AIC BIC SABIC
A– Unidimensional Model −54809 109813 110370 110059
B– Multidimensional Model (five uncorrelated factors) −50645 101487 102044 101733
C– Multidimensional Model (five correlated factors) −50439 101095 101709 101365
D– Bifactor Model (one general factor and five specific uncorrelated factors) −49710 99713 100549 100082 E– Hierarchical Model (five first-order specific correlated factors and one second-order general factor) −50608 101420 102000 101676 LL, log-likelihood; AIC, Akaike Information Criterion; BIC, Bayesian Information Criterion; SABIC Sample-size Adjusted Bayesian Information Criterion.
aA difference of 10 in AIC, BIC and SABIC is considered important. Lower values indicate a statistically better model fit.
Fig. 1.Bifactor model. (□) Observed variables (No. of OPCRIT items); (○) Unobserved variables (latent factors); (→) standardized item loading estimation onto latent factors; G, general psychosis factor; specific symptom factors: DEP, depression; MAN, mania; DIS, disorganization; NEG, negative; POS, positive. Reliability and strength estimates: H = construct reliability index;ω = McDonald omega; ωH= hierarchical omega;ω/ωH= Relative omega. Explanatory note: McDonald’s ω is an esti-mate of the proportion of the common variance accounted by general and specific symptom dimensions. Relative omega (ω/ωh) is the amount of reliable variance explained in the observed scores attributable to (1) the general factor independently from the specific symptom dimensions, and (2) each specific symptom dimen-sion independently from the general factor. H is an index of the quality of the measurement model based on the set of OPCRIT items for each symptom dimendimen-sion. Index H can range from 0 to 1, with values closer to 1 indicating a better construct reliability and replicability across studies.
Table 3.Standardized factor loadings in the bifactor model
OPCRIT item Item no. Factor Specific factor loading General factor loading Communalities
Persecutory delusions 54 POS 0.36*** 0.14
Well organized delusions 55 POS 0.27*** 0.34*** 0.19
Delusions of influence 58 POS 0.43*** 0.33*** 0.29
Bizarre delusions 59 POS 0.21*** 0.05
Widespread delusions 60 POS 0.42*** 0.29*** 0.26
Delusions of passivity 61 POS 0.49*** 0.27
Primary delusional perception 62 POS 0.23*** 0.51*** 0.32
Other primary delusions 63 POS 0.30*** 0.31*** 0.19
Delusions & hallucinations last for 1 week 64 POS 0.81*** 0.65
Persecutory/jealous delusions & hallucinations 65 POS 0.66*** 0.45
Thought insertion 66 POS 0.60*** 0.38
Thought broadcast 68 POS 0.60*** 0.24*** 0.41
Third person auditory hallucinations 73 POS 0.61*** 0.37
Running commentary voices 74 POS 0.62*** 0.39
Abusive/accusatory/persecutory voices 75 POS 0.54*** 0.33
Other (non-affective) auditory hallucinations 76 POS 0.42*** 0.19
Non-affective hallucinations in any modality 77 POS 0.51*** 0.26
Negative formal thought disorder 29 NEG 0.54*** 0.30
Restricted affect 32 NEG 1.00*** 1.00
Blunted affect 33 NEG 0.98*** 0.97
Bizarre behaviour 17 DIS 0.42*** 0.21*** 0.23
Speech difficult to understand 26 DIS 0.96*** 0.93
Incoherent 27 DIS 0.62*** 0.47*** 0.60
Positive formal thought disorder 28 DIS 0.84*** 0.72
Inappropriate affect 34 DIS 0.23*** 0.46*** 0.27
Excessive activity 19 MAN 0.53*** 0.73*** 0.82
Reckless activity 20 MAN 0.36*** 0.67*** 0.58
Distractibility 21 MAN 0.29*** 0.60*** 0.45
Reduced need for sleep 22 MAN 0.55*** 0.56*** 0.61
Agitated activity 23 MAN 0.16*** 0.76*** 0.59
Pressured speech 30 MAN 0.74*** 0.43*** 0.73
Thoughts racing 31 MAN 0.54*** 0.49*** 0.53
Elevated mood 35 MAN 0.85*** 0.41*** 0.89
Irritable mood 36 MAN 0.12** 0.55*** 0.32
Increased self esteem 56 MAN 0.87*** 0.24*** 0.81
Grandiose delusions 57 MAN 0.67*** 0.30*** 0.54
Slowed activity 24 DEP 0.55*** 0.31
Loss of energy/tiredness 25 DEP 0.80*** 0.64
Dysphoria 37 DEP 0.74*** 0.55
Loss of pleasure 39 DEP 0.87*** 0.76
Poor concentration 41 DEP 0.62*** 0.42*** 0.56
Excessive self-reproach 42 DEP 0.60*** 0.38
Suicidal ideation 43 DEP 0.55*** 0.31
distribution of psychosis symptoms at FEP, which may have
reduced potentially inflated presence of positive and negative
symptoms in previous studies conducted in hospital settings
(Allardyce et al.,
2007
). Also, OPCRIT does not cover some
rele-vant aspects of negative symptoms related to passive social
with-drawal, lack of motivation, and difficulties in abstract/symbolic
thinking. Consequently, we constructed a narrow negative
symp-tom dimension with three items. Finally, some authors have
argued that, in a bifactor model, the general factor may be difficult
to interpret and in general may overfit the data (Bonifay et al.,
2016
). However, the bifactor model allows solutions to
dimen-sionality issues that arise when the conceptual breadth of a
con-struct cannot be fully determined (Reise et al.,
2007
), as is likely
to be the case for the construct of psychosis, which, in the past,
has been considered as unidimensional and multidimensional at
the same time. For example, the bifactor model discerns each
spe-cific symptom dimension from the common item effect, which is
captured by the general dimension, thus allowing an accurate
evaluation of the unique contribution of each subset of symptoms.
Last, this solution provides crucial information which cannot be
determined from the other models, i.e. how much of the
pheno-typic variance that we aim to measure is due to a unidimensional
construct v. a multidimensional construct of psychosis. Hence, it
was a suitable model for addressing dimensionality issues for
psychosis and generating reliable phenotypes.
Comparison with previous research
In our study, the bifactor model of psychopathology best
explained the observed symptoms at FEP compared with
unidi-mensional and multidiunidi-mensional models. Our findings are
con-sistent with, and extend, previous research on psychotic
symptoms
in
people with
enduring
psychotic
disorders
(Reininghaus et al.,
2013
; Reininghaus et al.,
2016
) and the
gen-eral population (Shevlin et al.,
2017
) to a multinational incidence
sample of FEP. They provide further evidence that non-affective
and
affective
psychotic
disorders
lie
on
a
common
mood-psychosis spectrum (Murray et al.,
2004
). In addition, we
provided the first evidence in psychosis that a bifactor solution
shows better model fit statistics compared with a second-order
hierarchical solution. However, compared with findings in
endur-ing psychosis (Reinendur-inghaus et al.,
2016
), we found a less specific
general psychopathology factor with more general disturbances
and affective features. As illnesses develop, the non-affective
psychotic phenomena may become more and affective features
less prominent.
We found some evidence of gender differences in symptom
dimension scores. Men showed less depressive symptoms and
more negative symptoms compared with women. This finding
is consistent with other studies in stable schizophrenia (Shtasel
et al.,
1992
; Roy et al.,
2001
; Galderisi et al.,
2012
), first episode
psychotic disorder (Morgan et al.,
2008
), and the general
popula-tion (Maric et al.,
2003
). In our sample, we also showed that early
age-at-first-contact was associated with a higher level of general
and specific psychopathology. Notably, it has been proposed
that gender-related and symptom profiles differences in psychosis
may be suggestive of different neurodevelopmental trajectories
(Castle and Murray,
1991
; Seeman,
1997
; Riecher
‐Rössler and
Häfner,
2000
).
We further found that symptom dimensions vary in terms of
ethnicity. Consistent with a previous report (Kirkbride et al.,
2016
), we provided evidence that people of Black ethnicity
pre-sented at FEP with more positive and disorganized symptoms
and fewer depressive symptoms compared with people of White
ethnicity. Moreover, in line with another study (Veling et al.,
2007
), we found in our sample that the North African group
pre-sented at FEP with more positive symptoms compared with
peo-ple of White ethnicity. It has been debated whether similar
findings reflect true differences in symptom presentation or
instead result from raters being more likely to overrate symptoms
in the context of ethno-cultural diversity (Mukherjee et al.,
1983
;
Hutchinson et al.,
1999
; Barrio et al.,
2003
; Arnold et al.,
2004
;
Vega and Lewis-Fernandez,
2008
). Recent studies using
standar-dized procedures for assessing symptomatology blind to ethnicity
have suggested that misdiagnosis or rating bias cannot account for
differences across ethnic groups (Morgan et al.,
2010
). However,
we must remain cautious in interpreting these results.
We showed that high population density is positively
asso-ciated with the general and specific disorganized, negative and
manic dimensions. In our multinational sample, we were not
able to replicate previous findings on the relationship between
urbanicity and the positive dimension (Kirkbride et al.,
2007
).
Nevertheless, stratified analysis by country was consistent with
the previously reported association between urbanicity and
posi-tive symptoms in the UK. The relationship between urbanicity
and a higher incidence of psychotic disorders is well-established
(Vassos et al.,
2012
). However, it has been found to show
non-linearity (Kirkbride et al.,
2017
), which implies that the effect of
urbanicity may depend on exposure to additional
socio-environmental factors associated with urban contexts, for example
cannabis use (Kuepper et al.,
2011
) and childhood adversities
(Frissen et al.,
2015
). Similarly, our findings support the
Table 3.(Continued.)
OPCRIT item Item no. Factor Specific factor loading General factor loading Communalities
Initial insomnia 44 DEP 0.65*** 0.32*** 0.53
Middle insomnia (broken sleep) 45 DEP 0.65*** 0.25*** 0.48
Early morning waking 46 DEP 0.56*** 0.39*** 0.46
Excessive sleep 47 DEP 0.46*** 0.23
Poor appetite 48 DEP 0.69*** 0.48
Weight Loss 49 DEP 0.56*** 0.20*** 0.35
General, general psychosis factor; specific symptom dimensions: DEP, depression; MAN, mania; DIS, disorganisation; NEG, negative; POS, positive. Only loadings⩾0.2 for the general factor are
hypothesis that urban environment does not have a
dimension-specific effect and may act to confer risk for different
psycho-pathological outcomes in psychosis (van Os et al.,
2002
).
Noteworthy, similar findings have been reported in the general
population (van Os et al.,
2001
), which may require future studies
to consider the additive interaction between putative risk factors
for psychosis and urbanicity.
Implications
In the context of a general effort to move away from DSM and
ICD categories (Demjaha et al.,
2009
; Reininghaus et al.,
2016
;
Kotov et al.,
2017
; Van Dam et al.,
2017
; Whalen,
2017
; Zachar
and Kendler,
2017
), we found evidence that supports, and may
inform, the use of dimensional measures in the field of psychosis.
In our sample, the bifactor model was a valid platform for
research into FEP. Nevertheless, the plausibility of our
statistically-guided approach depends on the extent to which:
(1) symptom dimensions represent coherent environmental and
biological factors; and (2) meaningful clinical information or
decisions may derive from the latent constructs.
From a research perspective, our findings suggest that the
general dimension may reflect a phenotype for the study of
general risk factors. For example, urbanicity may impact on the
risk and profile of psychosis through the combination of other,
more specific socio- or bio-environmental factors. In addition,
we showed a substantial variation of sociodemographic
determi-nants at the specific dimension level, which may support an
integrated socio-developmental model of psychosis (Morgan
et al.,
2010
).
We may further suggest using the general dimension as a
quantitative measure of psychopathology for research into the
genetic component shared across psychotic disorders. The
evi-dence is required to establish the extent to which pathophysiology
of schizophrenia, bipolar disorder, and psychotic depression is
shared at the level of pathways and neuronal cell mechanisms
(Forstner et al.,
2017
). Based on the data presented on specific
symptom dimensions, it is intriguing to speculate whether the
distribution of psychotic symptoms reflects a gradient of
neurodevelopmental impairment or socio-environmental risk
(Morgan et al.,
2010
; Howes and Murray,
2014
) resulting in
different patterns of functional abnormalities (Murray and Lewis,
1987
; Murray et al.,
1992
; Demjaha et al.,
2011
; Owen and
O’Donovan,
2017
).
From a clinical perspective, although each patient presents
with a specific pattern of psychopathology and response to
treat-ment at FEP, attention has been traditionally focused on the
posi-tive dimension management. Mental health professionals may
integrate observations of the whole range of symptoms and
signs with a consideration of neurodevelopmental and
socio-environmental risk factors. Such an approach should aim to
plan and optimize pharmacological and non-pharmacological
treatments (Murray et al.,
2016
), thus focusing further on
treat-ment of negative, disorganized and affective dimensions (Wykes
et al.,
2011
; Giacco et al.,
2012
; Carbon and Correll,
2014
;
Pelayo-Teran et al.,
2014
; Rosenbaum et al.,
2014
).
We may further suggest promoting mental health professionals
to adopt treatment plans guided by dimensions, and increasing
their confidence in dimensional classifications. Reconciling
contradictory concerns of clinicians and researchers (Kendell
and Jablensky,
2003
) may represent the first milestone towards
a gradual nosology refinement.
T able 4. Symptom dimension scor es by sociodemogr aphic, ca tegorical diagnosis, and social conte xt variables Gener al B (95% CI) P ositiv e B (95% CI) Nega tiv e B (95% CI) Disorganiza tion B (95% CI) Manic B (95% CI) Depr essiv e B (95% CI) W omen v. Men a 0.01 (− 0.07 to 0.09) 0.01 (− 0.08 to 0.1) − 0.12** (− 0.21 to 0.23) 0 (− 0.08 to 0.1) 0 (− 0.09 to 0.08) 0.1** (0.02 to 0.17) Age a t firs t conta ct a − 0.01* (− 0.09 to − 0.01) − 0.02 (− 0.06 to 0.03) − 0.05** (− 0.1 to − 0.01) − 0.09*** (− 0.14 to − 0.05) − 0.1*** (− 0.14 to − 0.06) 0.04* (0.01 to 0.08) Ethnicity a Bla ck v. White 0.07 (− 0.06 to 0.19) 0.19** (0.04 to 0.33) 0.01 (− 0.14 to 0.15) 0.14* (0.01 to 0.28) 0.03 (− 0.1 to 0.16) − 0.22*** (− 0.34 to − 0.1) Mixed v. White 0.02 (− 0.12 to 0.17) 0 (− 0.16 to 0.17) 0.1 (− 0.07 to 0.27) 0.18* (0.02 to 0.34) 0.06 (− 0.09 to 0.21) − 0.1 (− 0.25 to 0.03) Asian v. W ithe − 0.06 (− 0.25 to 0.13) 0.11 (− 0.1 to 0.33) − 0.05 (− 0.28 to 0.18) 0.07 (− 0.13 to 0.28) 0.01 (− 0.19 to 0.21) − 0.08 (− 0.27 to 0.1) North African v. White − 0.02 (− 0.24 to 0.2) 0.32** (0.07 to 0.57) − 0.22 (− 0.48 to 0.04) − 0.05 (− 0.29 to 0.2) − 0.17 (− 0.4 to 0.06) 0.05 (− 0.16 to 0.27) Diagnosis a Schizophr enia v. Bipolar − 0.78*** (− 0.96 to − 0.6) 0.9*** (0.69 to 1.1) 0.53*** (0.32 to 0.75) 0.24* (0.06 to 0.45) − 1.7*** (− 1.88 to − 1.51) 0.78 (− 0.1 to 0.25) Schizoa ffectiv e disorder v. Bipolar − 0.47*** (− 0.65 to − 0.29) 0.94*** (0.73 to 1.14) 0.59*** (0.37 to 0.8) 0.3** (0.1 to 0.5) − 1.33*** (− 1.52 to − 1.15) 0.97*** (0.8 to 1.14) Major Depr ession v. Bipolar − 1.16*** (− 1.42 to − 0.91) − 0.24 (− 0.52 to 0.05) 0.72*** (0.42 to 1.02) − 0.23 (− 0.5 to 0.05) − 1.95*** (− 2.21 to − 1.69) 1.54*** (1.3 to 1.79) Unspecified F unctional Ps ychosis v. Bipolar − 0.99*** (− 1.19 to − 0.8) 0.36** (0.14 to 0.58) 0.5*** (0.27 to 0.73) − 0.06 (− 0.27 to 0.15) − 1.67*** (− 1.87 to − 1.47) 0.3** (0.11 to 0.49) Urban v. less urban b 0.3*** (0.24 to 0.36) − 0.03 (− 0.1 to 0.03) 0.12** (0.05 to 0.19) 0.08** (− 0.02 to 0.14) 0.01 (− 0.06 to 0.06) 0.02 (− 0.04 to 0.07) B, uns tandardised regr ession coefficient; CI, confidence interval . aC o varia tes in multip le models w e re gender, age, ethnicity , diagnosis, study country , and type of assessment method (intervie w v. case records). bP opul a tion density analy sis w a s adjus ted for gender , age, ethnicity , diagnosi s, and type of assessment method (intervie w v. case records).
Supplementary material. The supplementary material for this article can be found athttps://doi.org/10.1017/S0033291718002131
Acknowledgements. The EU-GEI Project was funded by the European Community’s Seventh Framework Programme under grant agreement No. HEALTH-F2-2010-241909 (Project EU-GEI). The work was further funded by: Clinician Scientist Medical Research Council fellowship (project reference MR/M008436/1) to MDF; Veni grant from the Netherlands Organisation for Scientific Research (grant no. 451-13-022) to UR; Sir Henry Dale Fellowship, jointly funded by the Wellcome Trust and the Royal Society (grant no. 101272/ Z/13/Z) to JBK; National Institute for Health Research (NIHR) Biomedical Research Centre for Mental Health at South London and Maudsley NHS Foundation Trust and King’s College London. The Brazilian study was funded by the Säo Paulo Research Foundation under grant number 2012/0417-0. Funders were not involved in design and conduct of the study; collection, management, analysis and interpretation of the data; preparation, review or approval of the manuscript, and decision to submit the manuscript for publication.
Conflict of interest. The authors have no conflicts of interest to declare in relation to the work presented in this paper.
References
Abrams DJ, Rojas DC and Arciniegas DB(2008) Is schizoaffective disorder a distinct categorical diagnosis? A critical review of the literature. Neuropsychiatric Disease and Treatment 4, 1089–1109.
Allardyce J, Suppes T and Van Os J(2007) Dimensions and the psychosis phenotype. International Journal of Methods in Psychiatric Research 16 (Suppl. 1), S34–S40.
American Psychiatric Association(2013) Diagnostic and Statistical Manual of Mental Disorders (DSM-5®). Arlington, VA: American Psychiatric Publishing. Arnold LM, Keck Jr. PE, Collins J, Wilson R, Fleck DE, Corey KB, Amicone J, Adebimpe VR and Strakowski SM (2004) Ethnicity and first-rank symptoms in patients with psychosis. Schizophrenia Research 67, 207–212.
Fig. 2.Predicted symptom profiles by RDC-based diagnostic category, gender, and ethnicity. Explanatory note: After the estimation of the bifactor model, the continuous scores for general and specific symptom dimensions were computed using the function‘FSCORES’ in Mplus (setting mean = 0 and standard deviation = 1), and used as the outcome variable in the regression analyses.
Barrio C, Yamada AM, Atuel H, Hough RL, Yee S, Berthot B and Russo PA (2003) A tri-ethnic examination of symptom expression on the positive and negative syndrome scale in schizophrenia spectrum disorders. Schizophrenia Research 60, 259–269.
Berrios GE and Beer D(1994) The notion of a unitary psychosis: a conceptual history. History of Psychiatry 5, 13–36.
Bonifay W, Lane SP and Reise SP(2016) Three concerns with applying a bifactor model as a structure of psychopathology. Clinical Psychological Science 5, 184–186.
Carbon M and Correll CU(2014) Thinking and acting beyond the positive: the role of the cognitive and negative symptoms in schizophrenia. CNS Spectrums 19(Suppl. 1), 35–53.
Cardno AG and Owen MJ(2014) Genetic relationships between schizophre-nia, bipolar disorder, and schizoaffective disorder. Schizophrenia Bulletin 40, 504–515.
Cardno AG, Jones LA, Murphy KC, Asherson P, Scott LC, Williams J, Owen MJ and McGuffin P(1996) Factor analysis of schizophrenic symp-toms using the OPCRIT checklist. Schizophrenia Research 22, 233–239. Cardno AG, Rijsdijk FV, Sham PC, Murray RM and McGuffin P(2002) A
twin study of genetic relationships between psychotic symptoms. The American Journal of Psychiatry 159, 539–545.
Castle DJ and Murray RM(1991) The neurodevelopmental basis of sex dif-ferences in schizophrenia. Psychological Medicine 21, 565–575.
Chou IJ, Kuo CF, Huang YS, Grainge MJ, Valdes AM, See LC, Yu KH, Luo SF, Huang LS, Tseng WY, Zhang W and Doherty M (2017) Familial aggregation and heritability of schizophrenia and co-aggregation of psychiatric illnesses in affected families. Schizophrenia Bulletin 43, 1070–1078.
Craddock N and Owen MJ (2005) The beginning of the end for the Kraepelinian dichotomy. The British Journal of Psychiatry: The Journal of Mental Science 186, 364–366.
Craddock M, Asherson P, Owen MJ, Williams J, McGuffin P and Farmer AE(1996) Concurrent validity of the OPCRIT diagnostic system. Comparison of OPCRIT diagnoses with consensus best-estimate lifetime diagnoses. The British Journal of Psychiatry: The Journal of Mental Science 169, 58–63.
Demjaha A, Morgan K, Morgan C, Landau S, Dean K, Reichenberg A, Sham P, Fearon P, Hutchinson G, Jones PB, Murray RM and Dazzan P (2009) Combining dimensional and categorical representation of psychosis: the way forward for DSM-V and ICD-11? Psychological Medicine 39, 1943–1955.
Demjaha A, MacCabe JH and Murray RM(2011) How genes and environ-mental factors determine the different neurodevelopenviron-mental trajectories of schizophrenia and bipolar disorder. Schizophrenia Bulletin 38, 209–214. Dikeos DG, Wickham H, McDonald C, Walshe M, Sigmundsson T,
Bramon E, Grech A, Toulopoulou T, Murray R and Sham PC(2006) Distribution of symptom dimensions across Kraepelinian divisions. The British Journal of Psychiatry: The Journal of Mental Science 189, 346–353. Fanous AH, van den Oord EJ, Riley BP, Aggen SH, Neale MC, O’Neill FA, Walsh D and Kendler KS(2005) Relationship between a high-risk haplo-type in the DTNBP1 (dysbindin) gene and clinical features of schizophre-nia. The American Journal of Psychiatry 162, 1824–1832.
Forstner AJ, Hecker J, Hofmann A, Maaser A, Reinbold CS, Muhleisen TW, Leber M, Strohmaier J, Degenhardt F, Treutlein J, Mattheisen M, Schumacher J, Streit F, Meier S, Herms S, Hoffmann P, Lacour A, Witt SH, Reif A, Muller-Myhsok B, Lucae S, Maier W, Schwarz M, Vedder H, Kammerer-Ciernioch J, Pfennig A, Bauer M, Hautzinger M, Moebus S, Schenk LM, Fischer SB, Sivalingam S, Czerski PM, Hauser J, Lissowska J, Szeszenia-Dabrowska N, Brennan P, McKay JD, Wright A, Mitchell PB, Fullerton JM, Schofield PR, Montgomery GW, Medland SE, Gordon SD, Martin NG, Krasnov V, Chuchalin A, Babadjanova G, Pantelejeva G, Abramova LI, Tiganov AS, Polonikov A, Khusnutdinova E, Alda M, Cruceanu C, Rouleau GA, Turecki G, Laprise C, Rivas F, Mayoral F, Kogevinas M, Grigoroiu-Serbanescu M, Becker T, Schulze TG, Rietschel M, Cichon S, Fier H and Nothen MM(2017) Identification of shared risk loci and pathways for bipolar disorder and schizophrenia. PLoS ONE 12, e0171595.
Frissen A, Lieverse R, Drukker M, van Winkel R, Delespaul P and Investigators G(2015) Childhood trauma and childhood urbanicity in rela-tion to psychotic disorder. Social Psychiatry and Psychiatric Epidemiology 50, 1481–1488.
Galderisi S, Bucci P, Ucok A and Peuskens J(2012) No gender differences in social outcome in patients suffering from schizophrenia. European Psychiatry: The Journal of the Association of European Psychiatrists 27, 406–408.
Giacco D, McCabe R, Kallert T, Hansson L, Fiorillo A and Priebe S(2012) Friends and symptom dimensions in patients with psychosis: a pooled ana-lysis. PLoS ONE 7, e50119.
Goodwin GM, Haddad PM, Ferrier IN, Aronson JK, Barnes T, Cipriani A, Coghill DR, Fazel S, Geddes JR, Grunze H, Holmes EA, Howes O, Hudson S, Hunt N, Jones I, Macmillan IC, McAllister-Williams H, Miklowitz DR, Morriss R, Munafo M, Paton C, Saharkian BJ, Saunders K, Sinclair J, Taylor D, Vieta E and Young AH (2016) Evidence-based guidelines for treating bipolar disorder: revised third edi-tion recommendaedi-tions from the British Associaedi-tion for psychopharma-cology. Journal of Psychopharmacology (Oxford, England) 30, 495–553. Hancock GR and Mueller RO(2001) Rethinking construct reliability within
latent variable systems. In Cudek R, Du Toit S and Sorbom D (eds), Structural Equation Modeling: Present and Future: A Festschrift in Honor of Karl Jöreskog. Linconlnwood, IL: Scientific Software International, Inc., pp. 195–216.
Heslin M, Lomas B, Lappin JM, Donoghue K, Reininghaus U, Onyejiaka A, Croudace T, Jones PB, Murray RM, Fearon P, Dazzan P, Morgan C and Doody GA(2015) Diagnostic change 10 years after a first episode of psych-osis. Psychological Medicine 45, 2757–2769.
Hoff P(2017) On reification of mental illness: historical and conceptual issues from Emil Kraepelin and Eugen Bleuler to DSM-5. In Kendler KS and Parnas J (eds), Philosophical Issues in Psychiatry IV: Psychiatric Nosology. New York, NY: Oxford University Press, pp. 107–117.
Howes OD and Murray RM (2014) Schizophrenia: an integrated sociodevelopmental-cognitive model. The Lancet 383, 1677–1687. Howes OD, McCutcheon R, Agid O, de Bartolomeis A, van Beveren NJ,
Birnbaum ML, Bloomfield MA, Bressan RA, Buchanan RW and Carpenter WT (2016) Treatment-resistant schizophrenia: treatment response and resistance in psychosis (TRRIP) working group consensus guidelines on diagnosis and terminology. American Journal of Psychiatry 174, 216–229.
Hutchinson G, Takei N, Sham P, Harvey I and Murray RM(1999) Factor analysis of symptoms in schizophrenia: differences between White and Caribbean patients in Camberwell. Psychological Medicine 29, 607–612. International Schizophrenia Consortium, Purcell SM, Wray NR, Stone JL,
Visscher PM, O’Donovan MC, Sullivan PF and Sklar P (2009) Common polygenic variation contributes to risk of schizophrenia and bipo-lar disorder. Nature 460, 748–752.
Janssen I, Hanssen M, Bak M, Bijl RV, de Graaf R, Vollebergh W, McKenzie K and van Os J(2003) Discrimination and delusional ideation. The British Journal of Psychiatry: The Journal of Mental Science 182, 71–76. Jauhar S, Nour MM, Veronese M, Rogdaki M, Bonoldi I, Azis M, Turkheimer F, McGuire P, Young AH and Howes OD(2017) A test of the transdiagnostic dopamine hypothesis of psychosis using positron emis-sion tomographic imaging in bipolar affective disorder and schizophrenia. JAMA Psychiatry 74, 1206–1213.
Jongsma HE, Gayer-Anderson C, Lasalvia A, Quattrone D, Mule A, Szoke A, Selten JP, Turner C, Arango C, Tarricone I, Berardi D, Tortelli A, Llorca PM, de Haan L, Bobes J, Bernardo M, Sanjuan J, Santos JL, Arrojo M, Del-Ben CM, Menezes PR, Velthorst E, Murray RM, Rutten BP, Jones PB, van Os J, Morgan C and Kirkbride JB & European Network of National Schizophrenia Networks Studying Gene-Environment Interactions Work Package, G(2018) Treated incidence of psychotic disorders in the multinational EU-GEI study. JAMA Psychiatry 75, 36–46.
Kasanin J(1933) The acute schizoaffective psychoses. American Journal of Psychiatry 13, 97–126.
Kay SR and Sevy S(1990) Pyramidical model of schizophrenia. Schizophrenia Bulletin 16, 537–545.