Publisher’s version / Version de l'éditeur:
Semi-Solid Processing of Alloys and Composites
READ THESE TERMS AND CONDITIONS CAREFULLY BEFORE USING THIS WEBSITE. https://nrc-publications.canada.ca/eng/copyright
Vous avez des questions? Nous pouvons vous aider. Pour communiquer directement avec un auteur, consultez la
première page de la revue dans laquelle son article a été publié afin de trouver ses coordonnées. Si vous n’arrivez pas à les repérer, communiquez avec nous à PublicationsArchive-ArchivesPublications@nrc-cnrc.gc.ca.
Questions? Contact the NRC Publications Archive team at
PublicationsArchive-ArchivesPublications@nrc-cnrc.gc.ca. If you wish to email the authors directly, please see the first page of the publication for their contact information.
NRC Publications Archive
Archives des publications du CNRC
This publication could be one of several versions: author’s original, accepted manuscript or the publisher’s version. / La version de cette publication peut être l’une des suivantes : la version prépublication de l’auteur, la version acceptée du manuscrit ou la version de l’éditeur.
Access and use of this website and the material on it are subject to the Terms and Conditions set forth at
Investigation of the primary phase segregation during the filling of an industrial mold with semi-solid A357 aluminum
Pineau, Frédéric; Simard, Geneviève
https://publications-cnrc.canada.ca/fra/droits
L’accès à ce site Web et l’utilisation de son contenu sont assujettis aux conditions présentées dans le site
LISEZ CES CONDITIONS ATTENTIVEMENT AVANT D’UTILISER CE SITE WEB.
NRC Publications Record / Notice d'Archives des publications de CNRC:
https://nrc-publications.canada.ca/eng/view/object/?id=fecbdc11-28a1-4a21-8ec7-cc134bdc3ac9 https://publications-cnrc.canada.ca/fra/voir/objet/?id=fecbdc11-28a1-4a21-8ec7-cc134bdc3ac9
Investigation of the primary phase segregation during the filling of
an industrial mold with semi-solid A357 aluminum
Frédéric Pineau
,
Geneviève Simard
National Research Council, Aluminium Technology Centre, 501 Université Blvd E, Chicoutimi, Qc, Canada, G7H 8C3 frederic.pineau@cnrc-nrc.gc.ca, genevieve.simard@cnrc-nrc.gc.ca Keywords: Two-phase flow, metallography characterization, simulation validation data.
Abstract. Casting metal alloys in the semi-solid state is now becoming a well established manufacturing technique. But, the success of this technology necessitates a good understanding of the feedstock material behaviour. To obtain high quality components with semi-solid metal processing, a homogeneous distribution of phases must be maintained in the material during the die filling stage. Many parameters affect the process such as temperature, time and stress history, which influence the shape, size and connectivity of the particles that make up the slurry. The subsequent phase interaction mechanisms are quite complex and have direct effects on the flow and final micro-structure distribution of the cast part and thus, without any doubt, on its mechanical properties. Two-phase numerical models have been developed to account for the liquid-solid phase separation e.g. [1,2]. Several two-phase models have been elaborated on the basis of soil mechanics and consider that the phase interaction term is mainly due to the flow through a porous medium. Because of the difficulties of making direct measurements in an extremely hostile environment, there has been very little work done to validate these models. In order to fill this gap, a better understanding of the phase distribution and phase segregation mechanisms during the filling step is
required. In this work, the post-solidification primary α-phase distribution inside an industrial
semi-solid cast part has thus been investigated. A thorough metallographic analysis has been performed using an upright microscope coupled to a Clemex image-analysis software. The results
were then processed to produce a map of the final α-phase distribution. Many different grain scales
have been observed in the solidified part and their distributions seem to be closely associated to the velocity field. Contacts between moving particles seem to play an important role in the phase distribution and show many similarities to granular materials. This latter aspect should be considered in the development of new constitutive models for semi-solid slurries.
Introduction
Different models have been used so far to reproduce the flow of alloys in the semi-solid state. A recent review of the literature is presented in reference [3]. Among the many available models, the simple power law approach, e.g. [4], gives fairly good results in term of flow front calculations as long as the process parameters remain unchanged. But any little variation in the process parameters will affect the next filling. The power law model is not able to reproduce the pressure distribution in the mold which means that it does not replicate entirely the physical properties of the metallic slurry. Moreover, there are more and more reports in the literature of the presence of segregated zones observed in many cast parts [5,6]. Evaluation of solid volume fraction distributions in semi-solid processes is crucial since this parameter has an effect on the local viscosity and consequently, on the filling of the mold. The volume solid fraction also controls the subsequent evolution of the microstructure in the part. For the industry, a homogeneous distribution of the solid particles is preferred in order to maximize the structural and fatigue properties.
In semi-solid metal processing, the volume fraction as well as the size, shape and distribution of the particles depend strongly on the thermo-mechanical history of the flowing material. These values are quite difficult to obtain by direct measurements. Quenching parts from the mushy state is
one of the techniques employed to characterize the microstructure of a solidifying alloy. By doing so, it is supposed that the residual liquid will solidify with a morphology which can be distinguished from the material that solidified prior to the quenching step [7,8]. This works well for small
samples when the cooling rate is in excess of about 100oC/s [7]. With real cast parts, the picture is
by far more complicated. First, the feedstock material, (the billet), has an initial distribution of α
particles that have distinctive particle sizes and morphologies that depend on the process employed to obtain the semi-solid material. Second, during the injection phase, the material is deformed and sheared. This gives rise to solid-liquid phase separation resulting from the velocity and pressure gradients as well as from the force interactions due to contact between particles. After the filling
and solidification stage, the final α-phase distribution is composed of several length scales that
differ among each others by many orders of magnitude. Note that the observed phase distribution in the part results from the complete thermo-mechanical history of the material, from the shut sleeve up to the quenching step.
In this work, a technique used to investigate the distribution of the primary α-particles after the
injection step is presented. It is assumed that the biggest α-particles are closely related to the
primary α-phase present in the billet before injection. It is also presumed that the fine α particles
are either related to the presence of liquid that solidified quickly near the wall or by the existence of shearing planes that break some bigger particles. Considering the complexity of the problem, the technique presented remains approximate. It has to be kept in mind that the analyzed surfaces are two-dimensional views of a complex three-dimensional structure and that some information about the real three-dimensional network is necessarily lost in the process.
Experiment
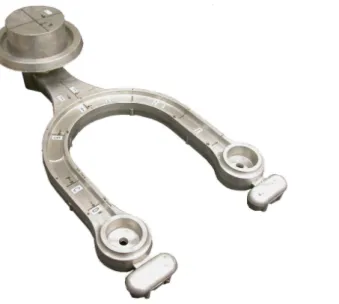
The experiment consisted to mold the suspension part shown in Fig. 1, which is representative of many semi-solid automotive applications using aluminum. Several parts have been produced with the ATC/NRC 600 ton Bülher machine. A piston velocity of 0.6 m/s was chosen to enhance the segregation mechanisms. Note that this velocity was rather high for this kind of part as it yielded metal front velocities in excess of 6 m/s. The third phase pressure intensification was set to 900 bar.
The alloy employed was a semi-solid aluminum A357 modified with strontium (100 ppm) obtained using the SEED process [9]. Each part was quenched in water shortly after ejection from
the mold. The average mold temperature was around 220OC.
Four samples labelled A, B, C, and D were produced from each part by cutting sections along the right arm as shown in Fig. 1. The samples were extracted from the part and prepared using an
automatic Tegrasystem grinding/polishing machine (sequentially 220 grits - 9µm - 3µm - 0.04µm).
Finally, the surfaces were chemically attacked (with a solution 1% HF) in order to perform the metallographic analyses.
The α-phase distributions resulting from the filling flow were then examined on these 4 planes.
Consider that the α-phase distributions on the final cast part encompass all the flow and thermal
history of the manufacturing process which includes unsteady flow and solidification. In the followings, keep in mind that direct correlations between the flow and the final phase distributions are not straightforward and that the information collected gives only a partial picture of the complex flow and solidification process.
Image analysis
Each sample has been analyzed using an Olympus BX51M upright microscope coupled to a Clemex image-analysis software. An assembly composed of 6000 micrographs has been created for each sampling section. As an example, a 3 x 3 sample viewed at 200X magnification is shown in Fig. 2. The globular structure observed is typical of a semi-solid A357 casting obtained using the SEED
process. On the inset, the primary α-phase as well as the eutectic phase are well defined. The
image analysis software has been programmed to discriminate the particles according to their
cross-sectional area. Particles whose areas are bigger than 500 µm2 are categorized as α+ and are assumed
to be related to the primary α-phase initially present in the billet. Particles whose areas are
comprised in the range 50 to 500 µm2 are defined as smaller α−-phase. Particles that lie in this range
are a mix of primary α-phase (the biggest) and part of the eutectic phase (the smallest). Finally,
particles with areas lower than 50 µm2 are defined as very much smaller α− − particles which form
part of the eutectic phase. For each rectangular sampling region, (see inset, Fig. 2), the image analyzer calculates the percentage area of α+ (light grey), α− (dark grey), and the eutectic phase,
composed of α-- (white) and black background. These values are then stored in the upper left corner
of the image. The data are next associated with a Cartesian mesh and passed to the visualization software Vu® [10] in order to examine the results.
Note that the phase distribution percentages are calculated on each rectangular sampling region.
Some errors can be introduced on the edges, by considering parts of bigger particles as small α−,
like on the bottom edge of the rectangular sampling section where the tip of a big α particle “A” is
considered as a small α− particle in the sampling window, (see Fig. 2). The overall section average
phase distribution throughout the casting is depicted in Fig. 3. Note that for this casting, the
concentration of α+ is higher in section A, where packing occurs. It decreases to a value of about
0.53 at section B and then increases slowly. The global value of about 0.55 solid fraction content of
α+ in the part corresponds to the assumed initial fraction of solid of the billet estimated by
temperature measurements (at about 586 oC).
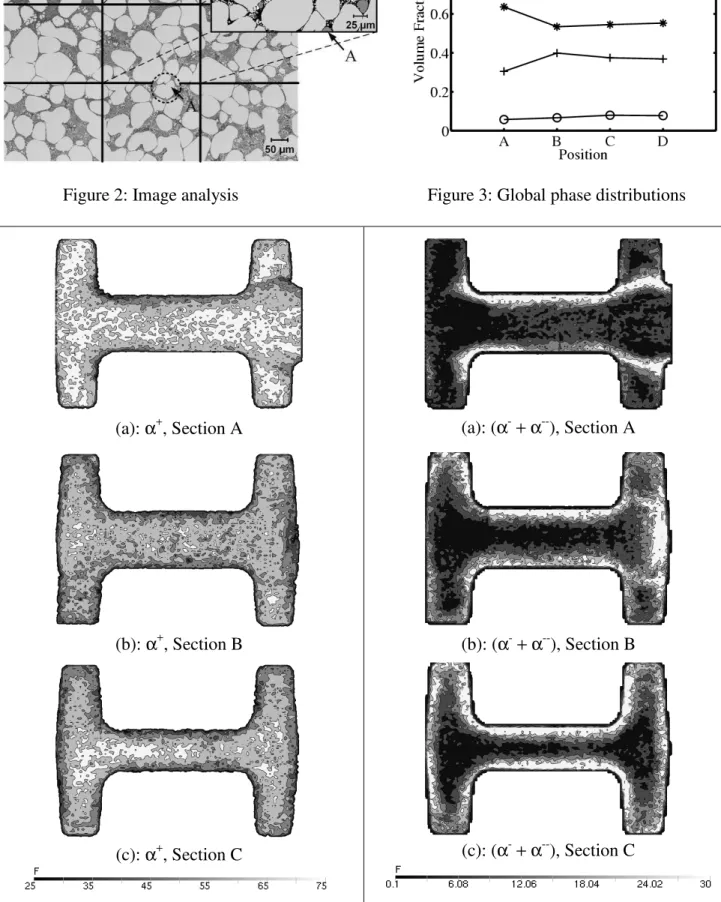
The α+-phase distributions are shown in Fig. 4 while the sum of α- and α-- are depicted in Fig. 5
for the different part sections. Fig. 4-(a) and 5-(a) depict the phase distributions in section A. Note that this section is on the symmetry plane near the gate and the flow is mainly directed from right to left. It is shown that the biggest particles tend to migrate toward the middle of the section, away from the walls, (Fig. 4-a). The biggest particles are also packed on the left hand side because the flow of semi-solid metal collides on the left wall and expels liquid toward the free surfaces by the mean of pressure gradients.
Figure 2: Image analysis Figure 3: Global phase distributions
(a): α+, Section A (b): α+, Section B (c): α+, Section C (a): (α-+α--), Section A (b): (α-+α--), Section B (c): (α-+α--), Section C
Evidence of shear bands is observed (note the dark bands on the right hand side of the section in
Fig. 4-(a), where the material gets into the mold. Figure 5-(a) depicts the small (α- + α--)particle
distributions, which are principally located where the concentration of the primary α-phase is lower,
near the walls and in high shear rate regions.
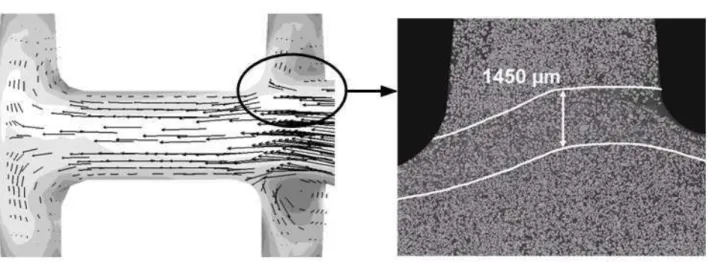
A close up of the quenched microstructures at the upper right area of section “A” is shown in Fig. 6 where the “shear band” is clearly visible on the micrograph. The width of the band is about 1450
µm, which corresponds to 15 times the average size of the particles present in the slurry. The
presence of a shear band in the material is typical of granular flow deformation. Similar observations have already been mentioned in the literature, for instance in reference [5,6].
The general flow field obtained by finite element calculation, (using the code presented in
reference [2]), at one time during injection is shown on the left. The corresponding calculated α
-phase distribution is superposed on the vector field. The grey spectrum for the α-phase distribution
goes from 0.48 (dark) to 0.52 (clear). Note that in this calculation, the particles are assumed to be
100 µm constant diameter spheres. The latter is a rather ideal case compared to the experimental
situation and the degrees of comparison between the computed and measured phase distributions are only qualitative in this case.
Fig. 4-(b) and 5-(b) represents the α distributions in section B. The flow is now mainly normal
to the section and a boundary layer like structure is developing due to temperature and velocity gradients. Note that the shear bands created by the flow at the gate are still visible on the right side. Also, the lower concentration of particles on the right wall is probably caused by the change of direction of flow at the fan gate junction.
The phase distributions in section C are shown in Fig. 4-(c) and 5-(c). In this section, the flow is completely transverse. The velocity gradients force the bigger particles to move in regions of lower
velocity gradients, away from the wall, see Fig. 4-(c). Accordingly, the smallest α particles are
rather uniformly distributed close to those walls, see Fig. 5-(c). The presence of these fine particles
near the wall can result from the volume of α particles being replaced by the eutectic phase when
the former migrate to the center of the section. Then, rapid solidification at the wall yields fine particles. The phase distribution in section D is very similar to the one of section C and is thus not reproduced here.
These results show clearly some well identified zones where particles are grouped together according to their size. In a solidifying semi-solid flow, many factors can affect the particles size and shape. High shear rate regions may result in particles fragmentation. Also, in high solid fraction semi-solid slurries, particles in contact in a high shear region can push one another apart and increase the space between them in order to rearrange. This property known as Reynolds’
dilatancy draws more liquid in the shear area, which then produces small α particles as
solidification progresses. Conclusions
A technique has been presented to evaluate the phase distributions in aluminum semi-solid cast parts. The phase distribution in an industrial semi-solid aluminum casting has been investigated. Segregation due to shearing has been noticed near walls along which there are normal velocity gradients. Bands of apparently increased liquid fraction have been detected in high shear zones within the material. These bands are similar to the ones found in sheared saturated granular
materials [5] and are characterized by the presence of small α particles. Evidence of phase
separation due to pressure gradients has also been observed. Although the method employed to analyze the post filling phase distribution remains approximate, it brings to the fore some of the mechanisms involved in the flow of the solidifying metallic suspension. It also emphasizes the presence of many different particle sizes in the final part. This latter feature as well as the mechanisms mentioned above will have to be taken into account for the development of more realistic constitutive laws for semi-solid slurries.
Acknowledgements
The authors wish to express their gratitude to Rio Tinto Alcan and the National Research Council of Canada (NRC) for permission to publish this work. The authors want to express special thanks to their colleagues at Rio Tinto Alcan (Joseph Langlais, Alain Lemieux and Clément Boudreault), at ATC (Dany Drolet, Marie-Ève Larouche, Chang-Qing Zeng, Hughes Blanchette) and at STAS (Stéphane Leclerc) for their help and support given in this work.
References
[1] A. Biarlobrzeski, M. Kotynia and J. Petera: AIP Conf. Proc Vol. 907 (2007), pp. 1130-1135 [2] F. Pineau, F. Ilinca and J-F Hétu: Proc. MCWASP XI Conf, Opio France (2006) pp 1063-1070 [3] H.V. Atkinson: Progress in Materials Science Vol. 50 (2005), pp. 341-412
[4] L. Orgeas, J-P Gabathuler et al: Model Simulat Mater Sci Eng Vol 11 (2003), pp. 553-574 [5] C.M. Gourlay and A.K. Dahle: Nature Vol. 445 (4) (2007), pp. 70-73
[6] C.L. Martin: Nature Vol 445 (4) (2007), pp 34-35
[7] E. Tzimas and A. Zavanliangos: Journal of Material Science Vol. 35 (2000), pp. 5319-5329 [8] L. Salvo, M. Pana et al : Proc. MCWASP XI Conf, Opio France (2006) pp 351-358
[9] D. Doutre, J. Langlais and S. Roy: Proc. 8th Int. Conf. on Advanced Semi-Solid Processing of
Alloys and Composites (CD), Limassol Cyprus (2004). [10] Invisu Inc. Vu visualization software, (www.invisu.ca)