Publisher’s version / Version de l'éditeur:
Vous avez des questions? Nous pouvons vous aider. Pour communiquer directement avec un auteur, consultez la première page de la revue dans laquelle son article a été publié afin de trouver ses coordonnées. Si vous n’arrivez pas à les repérer, communiquez avec nous à PublicationsArchive-ArchivesPublications@nrc-cnrc.gc.ca.
Questions? Contact the NRC Publications Archive team at
PublicationsArchive-ArchivesPublications@nrc-cnrc.gc.ca. If you wish to email the authors directly, please see the first page of the publication for their contact information.
https://publications-cnrc.canada.ca/fra/droits
L’accès à ce site Web et l’utilisation de son contenu sont assujettis aux conditions présentées dans le site LISEZ CES CONDITIONS ATTENTIVEMENT AVANT D’UTILISER CE SITE WEB.
Technical Memorandum (National Research Council of Canada. Division of
Building Research); Issue 88
READ THESE TERMS AND CONDITIONS CAREFULLY BEFORE USING THIS WEBSITE.
https://nrc-publications.canada.ca/eng/copyright
NRC Publications Archive Record / Notice des Archives des publications du CNRC :
https://nrc-publications.canada.ca/eng/view/object/?id=4628b96e-b3e8-4b79-9749-1d2741157196
https://publications-cnrc.canada.ca/fra/voir/objet/?id=4628b96e-b3e8-4b79-9749-1d2741157196
NRC Publications Archive
Archives des publications du CNRC
This publication could be one of several versions: author’s original, accepted manuscript or the publisher’s version. / La version de cette publication peut être l’une des suivantes : la version prépublication de l’auteur, la version acceptée du manuscrit ou la version de l’éditeur.
Access and use of this website and the material on it are subject to the Terms and Conditions set forth at
Annual Report of the Canadian Papers Presented at the Sixth
International Conference on Soil Mechanics and Foundation
Engineering
NATIONAL RESEARCH COUNCIL
CANADA
ASSOCIATE COMMITTEE ON GEOTECHNICAL RESEARCH
CANADIAN PAPERS PRESENTED AT THE SIXTH
IN'TERNATIONAL CONFERENCE ON SOIL MECHANICS
AND FOUNDATION ENGIN'EERING, MONTREAL, SEPTEMBER 1965
TECHNICAL MEMORANDUM NO.
88
OTTAWA
DECEMBER 1965
PREFACE
The Sixth International Conference on Soil Mechanics
and Foundation Engineering was held in Montreal, Canada, from.
8 to 15 Septem.ber 1965.
This was the second such conference held
in North Am.erica, the first being at Cam.bridge, Massachusetts, in
1936.
The Second, Third. Fourth and Fifth Conferences were held in
Europe at Rotterdam. in 1947, Zurich in 1953, London in 1957, and Paris
in 1961.
This Technical Mem.orandum. contains the reprints of the
seven Canadian papers appearing in the Proceedings of the Sixth
Inter-national Conference.
This is in keeping with the practice followed by
the Associate Com.m.ittee for the past Conferences.
The International Society of Soil Mechanics and Foundation
Engineering is com.posed of m.ore than forty National Sections.
The executive
body for the Canadian Section is the Associate Com.m.ittee on Geotechnical
Research (form.erly the Associate Com.m.ittee on Soil and Snow Mechanics)
of the National Research Council.
The principal function of the Canadian
Section is to assist in the further developm.ent and application of soil
m.echanics in Canada.
Enquiries with regard to the Canadian Section will
be welcom.e; they m.ay be addressed to the Secretary, Associate Com.m.ittee
on Geotechnical Research, c/o Division of Building Research, National
Research Council, Ottawa 2, Canada.
Robert F. Legget,
Chairm.an.
Ottawa
TABLE OF CON TENTS
The Engineering Behaviour of a Canadian Muskeg
A Comparison of Laboratory Results with In-Situ
Properties of Leda Clay
Triaxial Shear Characteristics of a Compacted
Glacial Till under Unusually High Confining Pressures
The Effect of Pore Pressures on the Undrained Strength
of a Varved Clay
The Rates of Consolidation for Peat
Bearing Capacity of Pile Groups under Eccentric
Loads in Sand
Induced Pore Pressures during Pile-Driving
Operations
J. I. Adams
C. B. Crawford and
W.J. Eden
A. E. Insley and
S. F. Hillis
D. L. Townsend,
G. T. Hughes and
J .A. Cruickshank
N.E. Wilson,
N. W. Radforth,
1.
C. MacFarlane and
M. B. Lo
H. Kishida and
G. G. Meyerhof
K. Y. Lo and
A. G. Stermac
1/1
The Engineering Behaviour of a Canadian Muskeg
Le Comportement technique d'une tourbiere canadienne
J. I. ADAMS, Supervising Engineer, Soils Section, Research Division, Hydro-Electric Power Commission of Ontario, Toronto, Canada
SUMMARY
The engineering behaviour of a Canadian muskeg was studied both in the laboratory and in the field.It was shown that the strength of the peat was essentially frictional and that its permeability varied widely during consolidation. Two distinct stages of consolidation were observed, a short-term stage which is believed to be the expulsion of free pore water in the peat, and a long-term stage which is believed to be the compression of the solid peat matter. Long-term pore pressures were observed which are believed to be associated with the compression of the solids.
"MUSKEG" IS ORGANIC TERRAIN which has resulted from the incomplete decomposition of surface vegetation. It consists of dead and fossilized organic matter known as peat sup-porting a surface layer of living vegetal matter. The living layer ranges in consistency and stature from grasses and mosses to relatively high bushes and trees. Although peat is by nature fluid and compressible, its properties are variable and are largely determined by the living matter from which it originates. The correlation of the living layer with the co-existing peat layer was observed by Radforth (1952) and formed the basis of his engineering classification of muskeg. Although muskeg is found in many parts of the world, its presence in the northern hemisphere is most noticeable in northern Europe, the U.S.S.R., and Canada. In Canada, as will be seen in Fig. I, muskeg covers more than 50 per cent
FREQUENCY OF OCCURRENCE
o
HIGH [:=JMEDIUM QLOW ',AF'TER R.W. RADFORTH PHD McMASTI[R UNIVERSITY}FIG. J.Map of Canada showing areas of muskeg occurrence.
SOMMAIRE
Le comportement technique d'une tourbiere canadienne a fait
I'objet d'etudes tant en laboratoire que sur Ie terrain. De ces etudes, il ressort que la resistance de la tourbe est essentiellement une resistance de frottement et que sa perrneabilite varie
con-siderablernent durant la consolidation. Deux etapes distinctes de consolidation ont ete observees, I'une
a
court terme qui, croit-on, est I'expulsion de I'eau capillaire Iibre, et l'autrea
long terme qui, croit-on, est la compression de la tourbe solide. On a observe des pressions capillairesa
long terme et ron pense qu'elles sont associeesa
la compression des solides.of the land surface south of the tree line, and its presence has presented formidable obstacles to the development of natural resources in the north. In the development of hydraulic power sites in northern Ontario, problems associ-ated with muskeg determine to a large extent the economic feasibility of many potential power projects.
Studies of the engineering properties of peat were under-taken by the Ontario Hydro Research Division in 1960. Initial laboratory tests included those of consolidation. per-meability, and triaxial compression. Instrumentation of peat underlying several embankments has been carried out, and an attempt has been made to relate field to laboratory behaviour. Although much of this work has been presented earlier (Adams, 1961, 1963), the results of all of the work. including some recent laboratory studies, are now presented and reviewed. The behaviour of peat with respect to strength and compressibility is discussed, and general concepts are suggested which may be helpful in predicting the engineering behaviour of muskeg.
LOCATION AND CLASSIFICATION OF MUSKEG
Studies of muskeg were made at three locations in the Moose River basin, as shown in Fig. I. The muskeg-cover classification and the results of physical tests on the peat at the three locations are shown in Table I. At each of the locations shallow embankments were constructed on muskeg for the purposes indicated in the table. Instrumentation of the peat foundations was carried out and measurements of settlement and pore-pressure development were made during and subsequent to construction. "Undisturbed" bulk samples of the peat were obtained from each location and used in laboratory studies.
LABORATORY STUDIES
The literature reveals uncertainty as to whether peat be-haviour is frictional or cohesive. Hanrahan (1954), for instance, held that the strength of peat was essentially cohesive. Others considered the possibility that the fibre tensile strength might influence peat behaviour. With respect
TAHLF I. I'IIVSICAL I'H(lI'EHTlES .\'<D CLASSfFICATlON OF PEAT
Location
1 Little LonR Rapids (;S 1;1('Cl'SSroad
2 AbitihiCanyon GS (scw.lRt' IaRoo11
embankment)
3 Harmon GS (block d.nu \ • Radforth cl.issitic.tlion 1!l,-,2),
:\1II"kq,· ('over \'('at· .\1)I,BEl " O. :1 11 1·/1 " o. 2 1'[:[ B \ ; iI Ii ·1 U' per cent dry wt: :!(HH.OO ;;'-",-42;'; ;1;:0 ;1/.-, 1 (\2 pH 4.8-63 6./ (J,2
Ash per cent dry wt. 12.2 to 22 .". lij.SS 12.27 _____1 4 6 10
«-«
-z----C) DRAINED. ANISOTROPIC CQ\IISQ..IDATION / / , ' / "',.} »: ᄋOセSVNセ;
8 . . , / --: ",'" ./ / ッセM^MセKセセNNNNNNNNZZLL[ZMLLMセセセセMM[ZMセセNNNNNNLL[MLMセBBBBGM[ o 10 I IS I ..:C ,5 6, .,. 6),
Ai UNDRAINED nセmally CONSOLIDATED 1 0 , . . . . - - - , '0 BJ UNDRAINED PRECONSOLIDATECtr,:
6 I!N "0-1 4 Consolidation TestsConsolidation tests were carried out on samples from the three locations shown on Fig. 1. The thicknesses of
"Where Ko
=
O"a/O"lfor zero lateral strain. FIG.3. Triaxial stress plots.solidated isotropically under 2, 10, and 30 psi confining pressures. Two samples were unloaded after isotropic con-solidation under 10 and 30 psi and tested at preconcon-solidation ratios of 5 and 15 respectively. Drained triaxial tests were made on two samples of peat which were consolidated ani-stropically (zero lateral strain) and then failed by increasing 17' 1or decreasing QWGセN Stress plots of all the triaxial tests are given in Fig. 3. It will be seen that in all tests the stress plots at failure (maxHtGQO\tGセI fall generally on a single line through the origin, and that the angle of shearing resistance in terms of effective stress indicated from these tests is high (eV
=
48°). Correction for rate of volume change was applied to the drained tests but the correction was found to be insig-nificant. The Knvalue of the peat for the two drained tests
was calculated to be of the order of 0.3.· The preconsoli-dated samples showed a slight prestress effect but it would appear that this effect is minor for even highly preconsoli-dated material.
I
I
10-)
10' PERMEABILITYI'( - FT 'MIN 105
Permeability Tests
Permeability tests were carried out on remoulded peat in an 8-in.-diameter settlement-permeability device. The peat was consolidated under successive increments of vertical compression. At the completion of each loading period the permeability of the peat was determined h\ a falling head test. Fig. 2 shows that the peat W<lS initi.I1]\·quite pervious
FIG. 2. Permeability versussample height.
but became relatively impervious under high compressive loads. Of significant interest is the linear variation of the logarithm of k, the coefficient of permeability, with the logarithm of H, the thickness of sample. Similar findings were reported by Miyakawa (1960).
Strength Tests
Samples of peat were prepared from "undisturbed" bulk samples obtained at location 2. Undrained triaxial tests with pore-water-pressure measurements were carried out on samples which were saturated by back pressure and con-·"Primary" consolidation is considered here as that portion occurring mainly under an excess hydrostatic pressure, and "secondary," that portion occurring mainly under zero, or neg-ligible hydrostatic pressure.
to the consolidation of peat. the observed behaviour was similar in most instances, hut the interpretation of results varied from the opinion that the consolidation of peat was essentially "primary," to one that it was essentially "secon-dary."> All appeared toagree that settlement was continuous. A good example of the long-term behaviour of peat was given by Huisman (1936), who cited embankments on peat (Holland) in which continuous settlement, linear with the logarithm of time, was recorded for more than eighty years. Another consistent observation was that of the marked change in the permeability of peat with change in volume (see, for example Mivakawa, 1960). The testing descrihed below was carried out with the hope of resolving some of the uncertainties.
2000 1000 1000 Lac I Lac a Lac ,
o
LOC I ® LOC 2 G) LOC, F!ELD VALue; 100 CONSOLIDATING PRESSURE - PSF 100 CQolSOLIOATING PRESSURE - PSF o O,Q4 INCHES I 370 INCHES • 340 INCHES t:.6 "\0 INCHES , 'i 15 INCHES • '50 INCHES c 1,50 INCHESFIG. 5. Initial consolidation.
LABORATORY VALUES He
LABORATORY VALUES FIELD VALUES Ho 0,1 04 0.01 0 . 0 5 2 = 0 - - - -...GMGMセMMMMMMGMMMMMMMMMMMMG 0.04 セ >-« c
d
Lセ z o U ..J < ;: zIi 0
0.1,I
COMPARISON OF LABORATORY AND FIELD BEHAVIOUR In each of the field embankments at the three locations indicated on Fig. 1, instruments were installed in the peat
FIG.6. Long-term consolidation.
relationship between the initial compression of the peat and the magnitude of the applied load. It will also he seen that at higher pressures the relationship for the peat from location 1 differs from those for locations land 3.
It has been shown that the long-term consolidation of peat is generally linear with the logarithm of time. As the slope of this plot appeared to vary in a logical manner with both applied load and sample thickness. it was thought to be significant for relating laboratory and field behaviour. The concept was originally suggested by Buisman (19311)
and was mentioned more recently by Miyakawa (1960). For all tests carried out, the slope of the long-term log plot was calculated and the value
C.
was determined by divid-ing the slope value by the thickness of the peat (H0 - So)at the start of the long-term compression. The
C.
values plotted against the logarithm of the applied load are shown in Fig. 6. It will be seen that an approximate grouping was obtained indicating a general relationship for the rate of long-term consolidation with the magnitude of the applied load. Also, the relationship for the peat from location 1 differs from those for locations 2 and 3.lu'" c;
'"
>-« 'l u, 0'"
'"
I U Z Z'"
Il: ::J'"
'"
'"
Il: u,'"
Il: () u, 20 10 20 10 '0 -50 50 40 40 30 30 TIME IN MINUTES \. Tl ME IN MINUTES ---==-_=--,---1 :0 20 C 64It-.I
I'--.
• セ, 1[:MAXIMUN PORE PRESSURE READING OF 64 INCHES 10 / , - TO 50 MIN
K-C"'N
\ 50 G.,4 IN \ o8 -MMMMMMMMセM '--1_---1-L 0 --.---1---...--1- --1--- 1- -_1._1_. 0 0.1 10 10 100 1000 10000 TIME IN MINUTES SAMPLE THICKNESS He 34 IN CONSOLIDATION PRESSURE - 570 PSF" OJ 0' l Cfl 06 c a I 0the samples at e shown in Fig. 5. On the 8-in.- and 4.5-in.-diameter samples the excess hydrostatic water pres-sure was meapres-sured during the tests by noting the rise in water level in fine-bore plastic tubing connected to the base plates of the samples, drainage being allowed to the top surface.
*
The consolidation loads were varied from 30 to l,OOO psf. and were applied in single increments, as well as in multiple increments (t1P/P=
I).The results of a typical test on peat are shown in Fig. 4 in セ hich settlement and pore pressure are plotted to dif-terent time scales. In each time plot (arithmetic, square root. and logarithm) it will be noted that there is an initial settlement, So, occurring in a relatively short period of time (tn
=
5 min). The settlement continues but atFIG.4. Typical consolidation curve.
a much slower rate which is approximately linear with the logarithm of time. These results are reasonably typical of all tests carried out in the present study. It may be noted that the excess pore pressure was almost entirely dissipated during the initial consolidation period; a residual pressure of low magnitude (I inch of water) remained, which decreased slightly with time.
The initial settlementSo was calculated for each test and expressed as the ratio (tJI/H0) (change in height over initial height). This value was plotted to the logarithm of the applied load as shown in Fig. 5. Although the points are scattered, they fall within a band indicating a general ·The measurements are obviously in error during rapid volume change but are considered accurate when the rate of volume change is relatively low.
r u
TAnLE IT. DESCKIl'TInS OF FIELD SECTln\;s l:\STKI'\IF\;TFIl
·Cordllroy mat used Oiltop of muskeg.
foundation prior to construction, and measurement of foundation settlement and pore-pressure development were recorded both during and subsequent to placing the embank-ment material. Descriptions of the sections instruembank-mented are given in Table II.
During construction of each emhankment a large settle-ment was recorded immediately on first application of load. By the end of the construction period the consolidation occurred at a much lower rate. Although the settlement was irregular it was believed to be essentiallv linear with the logarithm of time. The pore-pressure 'development was appreciable and in the case of the deepest peat (15 ft at location I) approached the vertical unit weight of the embankment. In all cases the pore pressures appeared to he continuous. The settlement and pore-pressure measurements from the three locations were plotted to the logarithm of time (Fig, 7).
To compare the field consolidation with the laboratory consolidation, the immediate settlement expressed as セhOhッ was calculated from each of the embankments instrumented as well as the coefficient of secondary consolidation
C".
These values were plotted on Figs. 5 and 6 to compare with the lahoratory relationships. TheC\
values shown cover a comparatively short period. the maximum period being about IJ2 years at location 1. It will be seen that the field values of AH/ H andC.'
for locations 1 and 3. plot within the laboratory range. The field values from location1 plot belowDISCUSSION
The consolidation of peat was observed in the laboratory and in the field to occur in two distinct stages. In an initial stage relatively large-magnitude compression occurs in a short period. The duration of the initial stage is in terms of minutes in the laboratory and in terms of days or weeks in the field. for the cases observed. A long-term stage follows in which the rate of settlement is much less and essentiallv linear with the logarithm of time. It was shown that the magnitude of the initial settlement was directly related to peat thickness and applied load, and that both field and laboratory measurements confirmed this general relationship. Further, it was shown that the rate of long-term consolida-tion could be related to peat thickness and applied load. This relationship also was confirmed by laboratory and field measurements although the latter cover a comparatively short period.
It has heen shown that the permeability of peat decreases in a predictahle manner with reduction in volume. and this behaviour is believed to be a significant characteristic of peat. Although not shown in the testing, it is believed that the solid constituents of peat contain a high percentage of water and are compressihle. The following concept of the consolidation of peat is suggested and is based primarily on the above two assertions. On application of load, the free pore water in the peat is expelled under excess hydrostatic pressure. Since the peat is initially quite pervious and the percentage of pore water is high, the magnitude of con-solidation is large and this period of concon-solidation is short. As the peat undergoes a large volume change the permea-bility is significantly reduced. During this period the effective consolidating pressure is transferred from the pore water to solid peat fabric in a manner similar to the primary con-solidation of clay. Unlike mineral soil the solid peat is com-pressible and will sustain only a certain proportion of the the laboratory range. At this location, however, compres-sible marl was found underlying the muskeg, and the field values were calculated on the basis of the peat thickness only.
dell''''till dellsetill セッヲ I marl ",ft marl dellse
uu
-I )e"cription of underlviuj; mineralsoil - - - . _ - - - - ,-----Depth Depth lI.lllskeg of lill uf pe.u cL!s,ill-I.ocnt ion (ft ) (ft ) ca tion
- - - _ . - - - - -M M M セ M M M M M M M M M -L\·
n
11..
f) ,\ IIIlB·
.,o ;) 14.0 HI·:I !-:l 2,\ -; 0 .-" (i 1/ I 2B l.i (1 ..\ -; " " ., -t+
:--i,I 1)1-'1 1\ . ) 106 iセ 105 TIME IN MINUTES LOCATION NO 30
Ho1- 8.1' T = 4.4' r-x It:•
>-.:i
.1
30 103 20 10 HO= PEAT THICKNESS - FT T = THICKNESS OF EMBANKMENT - FT BLANKETi
BLANKETA
....
"J
<s, IV
DYKE...I ,lorl'V.,: セt '. f' , 1'-" 1,1: 1&.
\.' " IC QPセ 105 106 10 12 HO = 5.6' T - 7,0' FILL ADDED----('"00
セ|hqM
4.7' I T = 15,0' RPQMMM⦅セ セ FILL ADDED セL セIB _...i.ii'i ..ILl \,
....- ... --, セia ,
...1.
セ..
, 1 •• · - - - - ' L , ".
セ , ': "" 10-' エoセ 105 106 til...
xi!
10 セ I-ffi :l セ 20[- _ l-I-...
til TIME IN MINUTESLOCA TION NO I LOCA TION NO 2
FIG. 7. Results of field instrumentation. 6
total effective stress, depending on the thickness and permea-bility of the peat mass. An equilibrium condition is eventu-ally achieved when the rate of compression of the solid peat is the same as the rate of compression of the peat mass, at which time the pore pressure. or more probably the hydraulic gradient, becomes constant.
If the flow of water through peat is according to Darcy's law. i.e., dH/dt
=
iK, where the hydraulic gradient i is a constant. and the coefficient of permeability K varies with thickness according to the relationship shown in Fig. 2, i.e.,logK.K o
=
ClogH H o• it can be shown that H, the peatthickness. will vary approximately with the logarithm of time. The field and laboratory observations tend to support this concept.
CONCLUSIONS
The strength of the peat is shown to be essentially fric-tional and in accordance with the principle of effective stress. Although the behaviour of the peat is similar to that of granular material, it is only slightly dilatant even when highly preconsolidated. A somewhat unique characteristic of peat is an unusually low Kovalue. Since this value implies that appreciable shear stresses occur during normal con-solidation. the magnitude of construction pore-water pres-sures is particularly significant in determining the stability of peat.
The consolidation of peat is shown to occur in two dis-tinct stages: an initial stage which for most cases can be considered immediate and a long-term stage which continues indefinitely at a slow rate. General relationships for the
magnitude of the initial consolidation and the rate of long-term consolidation were developed from laboratory data with which the field measurements show reasonable agree-ment. It is suggested that the initial consolidation is the result of expulsion of the free water in the peat mass and that the long-term consolidation is the result of expulsion of water contained in the solid peat matter.
ACKNOWLEDGMENTS
The writer would like to acknowledge the assistance and co-operation given by Mr. C. T. Enright and Mr. S. Mikoliew of the Ontario Hydro Hydraulic Generation Department.
REFERENCES
ADAMS, J.I. (1961). Laboratory compression tests on peat.Proc.
Seventh mオウォ・セ Research Conference, Tech. Memo. No. 71
andOntario Hydro Research News, Vol. 14, pp.35-40.
- - - (1963). A comparison of field and laboratory measure-ment in peat, Proc. Ninth Muskeg Research Conference
and Ontario Hydro Research Quarterly, Vol. 15,pp. 1-7.
BUiSMAN, A. S. K. (1936). Results of long-duration settlement tests.Proc, First International Conference on Soil Mechanics
and Foundation Engineering, Vol. I, pp. 103-6.
HANRAHAN, E. T. (1954). An evaluation of some physical properties of peat. Geotechnique, Vol. 4, pp. QPXセRSN
MIYAICAWA, I. (1960). Some aspects of road construction over
peaty or marshy areas in Hokkaido, with particular reference
to tilling methods. Sapporo, Japan, Civil Engineering
Research Institute.
RADFORTH, N. W. (1952). Suggested classification of muskeg for the engineer. Engineering Jour. (Canada), Vol. 35,
1/7
A Comparison of Laboratory Results with In-Situ
Properties of Leda Clay
Comparaison des essais de laboratoire avec Ies proprietes
ill situde I'argile Leda
C. B. eRAWFORD, Head, Soil Mechanics Section, Division of Building Research, National Research Council, Ottawa,
Canada
W. J. EDEN, Research Officer, Soil Mechanics Section, Division of Building Research, National Research Council, Ottawa, Canada
SUMMARY
Test results on Leda clav from eleven locations at Ottawa show that the undrained strength and preconsolidation pres-sure increase with decreasing elevation in general accordance with classical theory. In those locations where a substantial geo-logical unloading has occurred the strength has been maintained, revealing the importance of true cohesion as a component of shear strength. This field evidence is particularly useful in assessing and interpreting laboratory shear tests on this soil.
THE l.EDA CLAYor EASTERN CANADAis an unusual soil, quite similar to the clays of Scandinavia (Bjerrurn, 1954; Kall-stcnius, 1963). It is very compressible under load, shrinks substantially on drying, and is composed of inert particles and relatively non-swelling clay minerals (Brydon and Patry, 1961). The brittle, sensitive structure of the clay, when disturbed, transforms into a liquid mass and it is this charaetcristic that limits confidence in the ability to sample and to interpret lahoratory tests for the stress-deformation properties of the natural soil. This paper is a correlation of laboratory and field observations within a limited area which results in some fundamental and practical concepts of more general interest.
GEOLOGY
For many years Lcda clay has been considered a marine deposit of the Champlain Sea which invaded the Ottawa and St. Lawrence River lowlands toward the end of the glacial period. It is recognized that there must have been a substantial fresh water influence in the Ottawa area because it was several hundred miles from the open sea. Recent geological work (G add, 1963) has suggested that these lowlands carried the substantial drainage of the upper Great Lakes after the semi-marine period and that much of the marine clay was eroded and redeposited. This would explain the generally low pore water salt concentrations (Table 1).
The open, flocculated structure of the redeposited clay can be attributed to residual cations from the original deposit. Further evidence of redeposition is the general observation that marine shells occur in layers as half-shells and without the orientation expected in natural deposition. Also the clays are generally low in carbonates whereas the reverse is a feature of marine deposits.
SOMMAIRE
Des essais sur de I'argile Leda obtenue en onze endroits diffe-rents dans la region d'Ottawa indiquent, en accord avec la theorie classique, qu'en general Ia resistance au cisaillemcnt en teneur d'e au constante et Ies pressions de preconsolidation augmentent avec une elevation decroissantc. Lcs sols, aux endroits qui ont suhi un dcchargemcnt geologique suhstantiel, ont cependant maintenu leur resistance originale. Ceci revelo l'importance de la cohesion vraie comme composante de la resistance au cisaille-ment. Cette preuve ill situ est tout particulierernent utile dans revaluation ct I'interprctation des essais de resistance au cisaille-ment en laboratoirc.
rig. 1, a map of the Ottawa area, is based on reports by Brandon (1961) and Gadd (1963) and shows rock out-crops or till (shaded), deep deposits of postglacial sediments (enclosed in hatching) with shallow deposits between. The major clay deposits occur in what appear to be previous channels of the ancient Ottawa river. Eleven borings (A to K) ranging in surface elevation from 171 feet to 330 feet are shown on the map. Average properties of the soil at each boring (below the drying crust) are given in Table 1.
At the Sewage Plant and 'W;lkley Road sites (locations B and K, Fig. 1) block samples were obtained at depth and some results of tests on these are listed under numbers BB and KK (Table I).
Most of the soils are highly plastic (Ill = 30-40) except for :i middle layer usually occurring between elevation 170
and 200 feet. The upper values of sensitivity are of little significance because they depend very greatly on the method of testing (Eden and Kubota, 196 I). Salt content of the pore water is generally less than 2 grams/liter except in boring C where it increases to 13.7 grams/liter at great depth. This may account for the greater than normal in-crease in strength with depth and for the higher than average plasticity at boring C.
CONSOLIDATION PROPERTIES
The more plastic specimens of Lcda clay have a low coefficient of recompression, a characteristically sharp break at the preconsolidation pressure, and a high coefficient of virgin compression. The clays of low plasticity are more difficult to interpret and usually indicate a lower than average preconsolidation pressure. A limited investigation showed the load increment ratio to have little if any effect on the pressure-void ratio curve (Hamilton and Crawford,
lEGEND:
c.::::.:JBedrock and Ti II Areas (....,.. ...,... More Than 50' 01 Sediments
_._.- City limits
A Boring
FIG. 1.Map of Ottawa region (geology after Gadd (1963) and Brandon (1961)). 1959) but it can also be shown that the measured
pre-consolidation pressure can be doubled by rapid increases in effective stress as compared with slow increases (Crawford, 1964).
A positive check on the laboratory compression parameters is possible only by field observations. Measurements on a number of structures and earth fills have confirmed approxi-mately the recompression characteristics but only one well-documented case of virgin compression is under study (Eden, 1961). A general relationship between preconsolida-tion pressure and elevapreconsolida-tion had been shown previously (Eden and Crawford, 1957; Crawford, 1961) and is developed further in this paper.
UNDRAINED SHEAR STRENGTH
The most consistent and reproducible undrained shear tests of Leda clay are made in the field with a vane appa-ratus. Unconsolidated compression tests on specimens from thin-walled piston samplers usually yield values from one-half to the full field vane strength. The lower values are attributed to sample disturbance and to the reduced effective 32
stress level in the laboratory test. Increasing the time to failure in the laboratory appears to decrease the com-pressive strength by about J0 per cent per log cycle. Because the soil is so brittle (often failing in unconfined compression at less than 1 per cent strain) the usual undrained test in the laboratory or the field reaches failure in less than 5 minutes.
CONSOLIDATED, UNDRAINED SHEAR STRENGTH When undisturbed specimens of the brittle, sensitive clay are consolidated in a triaxial compression device, it is appa-rent that the natural, rather rigid structure is partially destroyed. A considerable amount of consolidation must occur to compensate for the loss of structural strength (Crawford, 1963) and such a test does not represent many actual problems. A study of triaxial test results, however, and the effective stress paths followed in the specimens reveals some useful general characteristics.
A common feature of most triaxial tests on Leda clay from the Ottawa area is that once the natural preconsolidation pressure has been exceeded by the ambient pressure, the undrained shear strength is equal to about 30 per cent of the
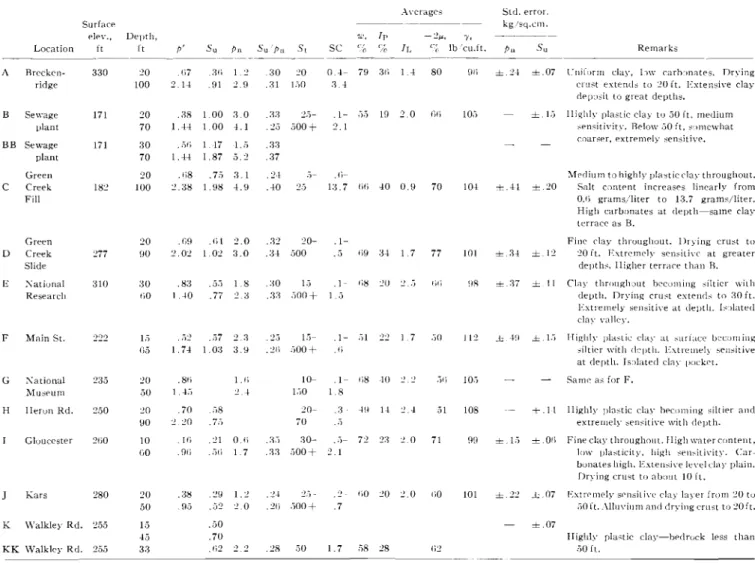
T,\BLE 1. SL\I:.\L\R\' OF SOIL PROPERTIES -Location Surface elev., it Depth, It p' Su Pn SC Averages '(L't II' - ZQセエ セOi cn Hゥセ II. c;, lbrcu.ft , Std.error. kgysq.crn . Pu Su Remarks . -A Brecken-ridge 330 zo 100 ,(i7 .31; 1:2 .30 :20 11 .91 2.9 .31 ].,0 0.1- 79 3'; 1.1 80 3.1
01; ± :2-1 ±. 07 Unifur rn clav. low ca rh-mare s. Dr ving cru st e xte nds to :20ft. Extensive clay dpp:Jsittogreat depths.
B Sewage plant BB Sewage plant 171 171 20 70 30 70 .38 1. 00 3 . 0 .SNセ 2.,- . 1- .", 19 2.0 r,1; . -l-! 1.00 -l .1 .:2;) .:")00
+
2. 1 ..セiゥ 1.17 r.s .33 .H 1.87 5.2 .3710., ± Lj l lighlvplastic clay tv 50 ft. medium
se nsitiv-itv. Below50ft , somewhat coarser, e xt re mel y sensitive.
Green C Creek Fill 182 20 100 .es NWLセ 3.1 .:2·1 .j-
.1>-2.38 1.98 1.IJ .10 2" I:J.7 (;I; 10 0.9 70
M eeliu m to highly pla stic cla y throughout.
10--1 ±.41 ± 20 Salt content increases linearly from
0.1) grams/liter to 13.7 gra mx/Iite r, High carbonates at depth-same clay terrace as B. Green o Creek Slide 20 00 .';9 .o.t 2.0 .32 20- .1-セ . 0:2 .0:2 3 .0 . ;)-1 ;j00 .;j 1)9 3-1 1 7 77 101
Fine clay throughout. Drying crust to ±.;:U ± 12 20{t. Ext rc mcl y sensitive at greater
dent hs. ll iaher terrace thanB. E Xat icnal Research F Main St. 310 :JO oo .S:) .5;") 1 8 NZセo Lj .1 fiS:!O :2.;') lit; 1.·10 .77 2.:, .33 .,00+ 1.j ,;):2 .;")7 2,3 .:2.) 1;"i- .1- ;ll 'F) 17 .")0 1.74 1.0:) 3.9 .:!Ii ;")00+ ,Ii
9R ᄆNセW ± 11 Clay t.hrou ghout bt-coming siltier with depth. Drying crust extends to セッ ft.
Extremely sensit Ive at depth . Isolated clay valley.
J12 J.: MセHャ .± lti Hirrlrlv plast ic clay ut sudan; b.-co ming
silticr withdepth, Extremelyseusit ive
at depth. Isolated clay poc kct .
Hi .:21 O,1i .:1,) 30- .s- 7'1. 2:3 :2.0 71
.9{; .,,1; 1.7 .33 ,,00+ 2.1
90 ±};") ±.Of\ Fineclaythroughollt.Highwatprcontpnt,
Iov...· plasticit y, high sensitivit y. Car-bonateshigh.Extenslvelevel clay plain, Dryingcrustto about 10it. G Xa tional Museum H llerun Rd. Gloucester 235 250 20 90 10 1;0 .se 1
1.,
.70 .,',8 :20 .I ; ) 1.Ii :2.Mセ 10- .1- 1;8 ·10 [,,0 8 20- .3 セo I! 2.4 70 .;) ,")t) 10,") .51 108 Same as forF.+.1-1 l l ighl y nlast ic olav hecoming silt ler and
extremelysensitivewithdepth.
Kars セXP 20
50
NZセs .:!I:J 1.:2 NZRMセ :2,j- ,-, /i0:20 :2.0 oo . 9;) N[セQR :2.0 .:W ,)00+ .7
101 ± 2:2 3.:.07 Extrt-mclv scnsitivc clay layerfrom:20 tu ;)0ft..-\IlIlViIlITlanddrying crust to:!O ft • K Walkley Rd. セUU KK Walkley Rd. 255 15 45 3.3 .50 .70 . /i2 :2.:2 .:28 ;30 1.7 ,,8 28 ±.07
Highly plastic clay-e-bed rock less than
,,0it. . _
-p' = effective overburden stress, kg-'sq.cm.: Suセ undrained shear strength, kgr'sq.crn.: Pn'---- prcconsnl idation pressure, kg z'sq.cnr.: SC = salt content grams/liter.
in Fig. 2. A generalized cross-section is included with Fig. 1 to illustrate the inferred original surface elevation of the clay deposit.
All strength tests were made with a field vane apparatus and consolidation tests were performed on specimens ob-tained with a thin-walled piston sampler except for a series of tests on block samples from sites Band K. At site B the usual tests were made before construction and then block
FIG.2.P«andSuin relation to elevation. consolidation pressure, or Sui P
=
0.30. Ifthe effective stresspath during such a test is examined, it will be seen that the specimen is substantially overconsolidated at failure and it has been contended that the strength is maintained at the reduced effective stress by intrinsic stresses or cohesion. Itis further argued that if this effect is reduced by assessing the shearing resistance at stresses less than failure, a maximum friction angle for the material is of the order of 1T", Al-though this has been referred to as a true angle of friction. it would be greater than the true angle if the soil had a significant intrinsic stress effect (cohesion) under conditions of normal consolidation (Crawford, 1963).
FIELD COMPARISONS
The significant soil properties from eleven borings are collected in Table I. The surface elevation is given for each location and the vertical effective stress (p'), the undrained shear strength (Sn), and the laboratory measured precon-solidation pressure (Pu) are given at two depths. The upper depth is at the bottom of the drying crust and the lower depth is at the bottom of the boring. Each figure was obtained from a statistical evaluation of many tests (standard errors are recorded in Table I) and the resulting straight lines showing P« and Su in relation to elevation are plotted
100 1.0 ),0 SlHSS,l(GICM l LEG[ND 1.0 33
samples were obtained at intervals during excavation to a depth of 70 feet. Consolidation and compression tests were performed on these samples and they arc noted on Fig. 2 as BB.
The preconsolidation pressure measured on the block samples from site B is more than 1 kg/sq.cm. higher than that measured on the tube samples. Similarly the strengths measured on block samples arc nearly double those obtained with the field vane. The authors are of the opinion that the field vane may be inappropriate for testing such stiff ovcrcon-solidated clays and this could account for the failure to show an increase in strength with depth. Previous tests on block samples from higher elevations compared more favourably with tube samples.
DEDUCTIONS FROM LABORATORY AND FIELD OBSERVATIONS Laboratory and field observations must be correlated in order to establish confidence in dealing with these sensitive clays. On the basis of the previous discussion an attempt is made therefore to review in a geological sense the stress history of typical sections of the soil deposit and to relate this to present strength and effective overburden stresses.
To begin, an assumption was made that the average Sui P
ratio of the original normally consolidated clay was equal to 0.30. This assumption is based on the logical concept (pro-posed by Skempton, 1948) that the shearing resistance (Su)
developed in a normally consolidated clay deposit is related to the overburden pressure (p). Further studies by Skemp-ton, by Bjerrum (1954), and by Osterman (1960) led to a limited correlation between the Sui Pratio and plasticity. The logic of this relationship is not so obvious and there is a substantial discrepancy between field and laboratory values, especially for soils of low plasticity (Osterman, 1960; Bjer-rum and Simons, 1960). There maybe several reasons for this discrepancy including, in particular, variations in iso-tropy. From published values for other clays and from observed relationships between undrained strength and pre-consolidation pressure (Table I) on Ottawa clays and from triaxial tests the value of Sulp = 0.30 was chosen.
2 ) •
veセGicBャ EFfECTIvE STRESS I(GiCM1
FIG. 3. Relation between preconsolidation pressure, strength, and existing effective stresses for three locations. In Fig. 3 the average preconsolidation pressure at upper and lower levels for three locations (Table I) is plotted on the averageSui pline. Other borings fit into the same pattern. It is reasoned that if the undrained strength could have been measured when the entire thickness of soil was normally consolidated under its own weight the strength would have been equal to that indicated. Furthermore, if the strength test was carried out without drainage, then the vertical effective stress at failure would be equal to the consolidation pressure and tan-1
S,/
pwould represent the maximum possible angleof shearing resistance in terms of vertical effective stresses.
Ifpart of the resistance was due to true cohesion, then the true angle of friction would be somewhat lower. t。ョセャ
Slip is approximately equal to 17° and the interpretation is
therefore compatible with previous deductions based on the triaxial test (Crawford, 1961). The usual interpretation of triaxial tests, in the authors' opinion, gives much too great an effective angle of friction due to the overconsolidation at failure. A similar conclusion has been reached by Osterman
(1962).
Joined to each of the points that represent strength and effective stress under normally consolidated conditions are points representing existing undrained strength at the present vertical effective stress. The effective stresses on the in-situ undrained shear plane arc assumed to remain unchanged during test due to equal increases in pore pressure and total stresses. The dashed lines infer the possible effective stress path during geological unloading. Of primary interest is the fact that the strength has been maintained after a substantial reduction of effective stresses in the ground. This is attri-buted to a form of metamorphosis in which bonds develop between the soil particles under sustained pressure and prevent swelling and loss of strength when the overburden stresses are relieved geologically. The retained strength under reduced effective stresses must be attributed to cohe-sion rather than to increased friction angle.
In those locations, such as BB, in which the strength at present is higher than the geologically inferred strength, this may be accounted for by one or more of the following reasons: the assumed Sulp may be too low, as suggested by observed Sui Pro for the borings; the measured preconsolida-tion pressure may be too low particularly at great depths when the sensitivity is high; the strength may have increased by cementation; the measured strength may be too high when compared with consolidation properties which are measured at much slower rates of strain. The last-noted reason may be the most important one when the influence of strain rate on structural deformation is recalled. The determination of the proper rate of testing for a particular problem is probably the most important gap in present knowledge.
CONCLUSIONS
1. Engineering evidence is compatible with geological evidence of the complex history of the Ottawa clays. Current thinking suggests two major types of clay-one a reworked product of the other.
2. The good correlation between laboratory and field tests when related to absolute elevation provides a sound basis for evaluating geological history and increases confidence in the test results.
3. This clay has been relieved of effective stresses in nature without substantial loss of strength. The residual strength is attributed to true cohesion.
4. When effective stresses are relieved by the build-up of pore pressure in a triaxial test, the shearing resistance has often been attributed to the mobilization of a rather large friction angle. It follows from these observations of stress release in the field that this is in fact a true cohesion resis-tance and the usual interpretation of the triaxial test on such clays is strongly questioned.
5. Because rate of loading has a great influence on the performance of most clays, it is a factor that must be taken into account when comparing shear and consolidation properties. This is emphasized by the higher than expected undrained strength at some of the locations described.
6. Sample disturbance is an important factor as shown by comparison of block and tube samples. It is probably of most significance on samples which have experienced the greatest amount of stress release.
ACKNOWLEDGMENTS
The authors are indebted to their colleagues in the Soil Mechanics Section of the Division of Building Research for much of the work represented by this paper which is pub-lished with the approval of the Director of the Division.
REFERENCES
BJERRUM, L. (1954). Geotechnical properties of Norwegian marine clays. Geotechnique, Vol. 4, pp. 49-70.
BJERRUM, L., and N. E. SIMONS (1960). Comparison of shear strength characteristics of normally consolidated clays.
Research Conference on Shear Strength of Cohesive Soils,
pp. 711-26. American Society of Civil Engineers.
BRANDON, L. V. (1961). Preliminary report on hydrogeology,
Ottawa-Hull area, Ontario and Quebec. Geological Survey
of Canada, Paper 60-23.
BRYDON, J. E., and L. M. PATRY (1961). Mineralogy of Cham-plain Sea sediments and a Rideau clay soil profile. Canadian
Jour. Soil Science, Vol. 41, pp. 169-81.
CRAWFORD, C. B. (1961a). Engineering studies of Leda clay, in
Soils in Canada, Royal Society of Canada, Special
Publica-tions No.3, pp. 200-17. Toronto, University of Toronto Press.
- - - (1961 b). The influence of strain on shearing resistance of sensitive clay. Proc. American Society for Testing and
Materials, Vol. 61, pp. 1250-76.
- - - (1963). Cohesion in an undisturbed sensitive clay.
Geotechnique, Vol. 13, pp. 132-46.
- - - (1964). Interpretation of the consolidation test. Pre-sented to the Technical Conference on The Design of
Foundations for The Control of Settlements, American Society of Civil Engineers (Evanston, Ill.), June, 1964. EDEN, W. J. (1961). Field studies on the consolidation properties
of Leda clay. Proc. Fourteenth Canadian Soil Mechanics
Conference, Tech. Memo. No. 69, pp. 107-27. National
Research Council (Canada), Associate Committee on Soil and Snow Mechanics.
EDEN, W. J., and C. B. CRAWFORD (1957). Geotechnical proper-ties of Leda clay in the Ottawa area. Proc. Fourth
Inter-national Conference on Soil Mechanics and Foundation
Engineering (London), Vol. 1, pp. 22-7.
EDEN, W. J., and 1. K. KUBOTA (1961). Some observations on the measurement of sensitivity of clays. Proc, American
Society for Testing and Materials, Vol. 61, pp. 1239-49.
GADD, N. R. (1963). Surficial geology of Ottawa map area,
Ontario and Quebec. Geological Survey of Canada, Paper
62-16.
HAMILTON, 1. J., and C. B. CRAWFORD (1959). Improved determination of preconsolidation pressure of a sensitive clay. American Society for Testing and Materials, Special
Technical Publication No.254, pp. 254-70.
KALLSTENIUS, T. (1963). Studies on clay samples taken with
standard piston sampler. Swedish Geotechnical Institute,
Proc., No. 21.
OSTERMAN, 1. (1960). Notes on the shearing resistance of soft clays. Acta Polytechnica Scandinavica (263/1959), Stock-holm.
- - - (1962). A theoretical study of the failure conditions in
saturated soils. Swedish Geotechnical Institute, Proc., No. 20.
SKEMPTON, A. W. (1948). A study of the geotechnical properties of some post-glacial clays. Geotechnique. Vol. I, pp. 7-22.
2/23
Triaxial Shear Characteristics of a Compacted Glacial Till
under Unusually High Confining Pressures
Caracteristiques de cisaillement triaxial d'une moraine glaciaire cornpactee sous des pressions laterales
tres elevees
A. E. INSLEY, Partner, R. C. Thurber and Associates Ltd., Victoria, Canada
S. F. HILLIS, Senior Soils Engineer, CASECO Consultants Ltd., Vancouver, Canada
SUMMARY
The paper describes the equipment and techniques used and results obtained from a series of triaxial shear tests carried out on 6-inch diameter specimens of glacial till compacted at three different moisture contents. Since the till will be used as the core material for an exceptionally high rockfill dam, the tests were carried out at unusually high confining pressures, up to 450 psi. In addition to standard drained and consolidated-undrained tests, special drained tests, which involved measuring the load inside the cell by means of strain gauges, were performed to evaluate the magnitude of piston friction in the apparatus.
It is concluded that the high confining pressures have little effect on the shear-strength parameters of the till in terms of effective stresses, but a considerable effect on the pore-pressure parameter
A
f which is increased from the usual low value for this type of material as the confining pressure is increased.THE TESTS DESCRIBED are part of a laboratory testing pro-gramme being carried out on the core material for the proposed Mica Creek dam. This dam will be on completion one of the highest earth or rockfill dams in the world, and the major power structure of the Columbia River Develop-ment in Canada.
Since the dam will rise 650 feet above the river bed and some 790 feet above the lowest point in the underlying bedrock channel, the normal stresses which will exist near the base of the structure will be much higher than those usually encountered in soils engineering practice. In order to simulate those stresses, the triaxial shear tests were per-formed at effective confining pressures varying from 50 psi to the unusually high value of 450 psi.
Furthermore, in order to include most of the particle sizes found in the natural soil, the test specimens were made 6 inches in diameter.
DESCRIPTION OF MATERIAL
The material tested is a well-graded, slightly plastic glacial till containing 17 per cent gravel to IJf in., 41 per cent sand, 32 per cent silt, and 10 per cent clay. The liquid and plastic limits are 21 per cent and 17 per cent respectively. The standard Proctor dry density, corrected to include particle sizes up to l)f in. is J36 pef and the optimum moisture content is 9.8 per cent. The specific gravity of the material varies from 2.75 to 2.80. The gravel sizes are mainly granitic gneiss and quartz with some friable schist. Mica flakes are present in the fines.
SOMMAIRE
L'article decrit l'equipement, les techniques utilisees et les resultats obtenus apres une serie d'essais triaxiaux faits sur des echantillons d'argile rocailleuse d'origine glaciaire de diametre de 6 poucescornpactes
a
trois differentes teneurs en eau. Comme ce sol devait etre utilise pour la partie centrale d'un barrage en enrochement exceptionnellemcnt haut, les essais furent executesa
des contraintes ambiantes peu communes, allant jusqu'a 450 livres par pouce carre.En plus des essais standards draines et consolides non-draines, on a effectue des essais draines speciaux pour mesurer la friction du piston dans la cellule. On conclut que les contraintes
arn-biantes tres grandes ont peu d'effets sur les parametres de resistance au cisaillement exprimes en fonction des contraintes effectives. Ellcs ont ccpendant un effet considerable sur Ie para-metre de pression interstitielle
A
f qui augmente avec la contrainteambiante.
TESTS PERFORMED
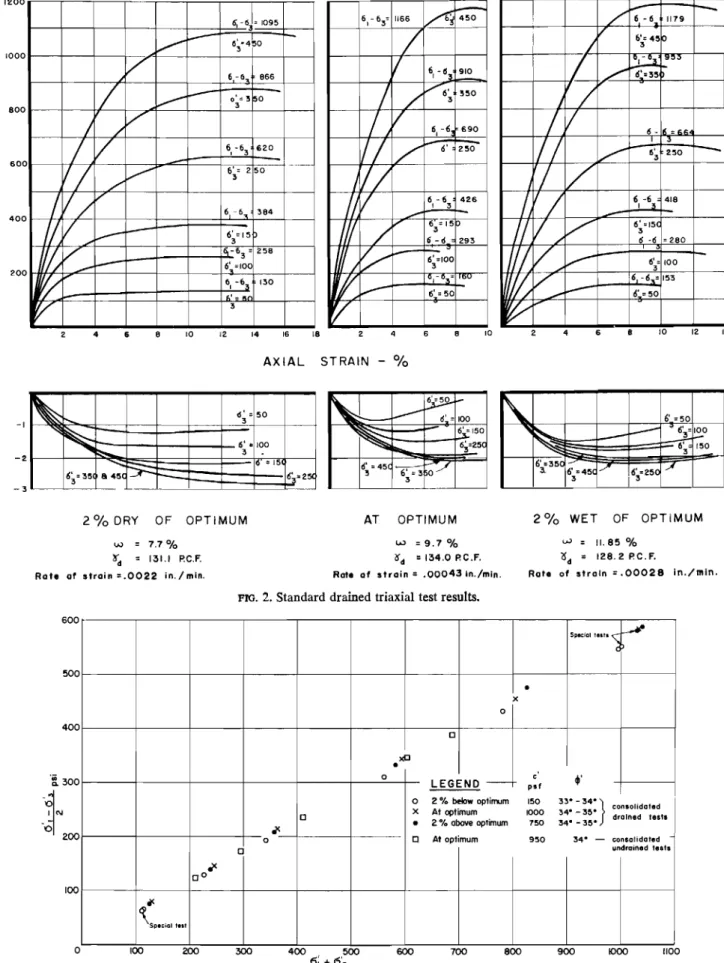
In order to determine the effective stress parameters, a total of 18 standard drained triaxial tests were carried out on specimens compacted at optimum moisture content, and at 2 per cent below and 2 per cent above optimum.
As a check on the parameters obtained from the drained tests, and to obtain some measure of the pore-pressure behaviour, five consolidated-undrained triaxial tests with pore-pressure measurements were performed on specimens compacted at optimum moisture content.
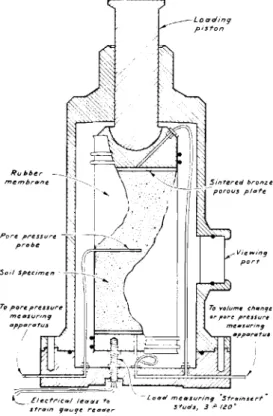
As will be noted, the triaxial cell used has a large-diameter piston which slides in a fixed bronze bushing. There is thus the possibility of piston friction influencing the loads as measured. It was decided, therefore, to modify the apparatus so that the load could be measured inside the cell (which of course eliminates any concern in this regard), and to carry out special drained tests using the modified equipment.
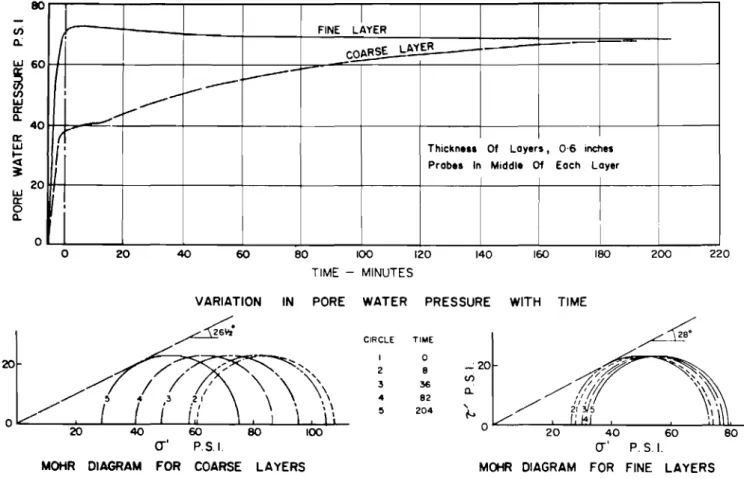
This has been done, but only three results of long-term tests are available yet. These results, obtained from the special drained triaxial tests performed at both 2 per cent dry and 2 per cent wet of optimum, are considered of interest and are reported herein. With these latter tests it was also decided to check that the times to failure were sufficient to ensure that no significant pore pressures developed during shear. This was done by inserting a probe into the specimen at mid-height to check that there was no difference in pore pressure between the middle and the back pressure applied at the ends.
TESTING EQUIPMENT
The apparatus and layout is similar in design to that developed at Imperial College and, despite the high con-fining pressures and large-diameter test specimens required, almost all of the equipment can be obtained readily from commercial suppliers. The triu xial cell and loading system were supplied by Clockhouse Engineering Ltd. and the pressure supply and pore-pressure units by Wykeharn Far-ranee Engincering Ltd. The load-sensitive studs used for the special drained tests were manufactured by the Strainsert Company.
The triaxial cell can accept specimens 6 inches diameter and 12 inches high, and since it is made of steel a maximum confining pressure of 1500 psi can be used. The piston through which the axial load is applied is 3Ji inches in diameter and is of precision-honed stainless steel running in a fixed bronze bushing. Leakage past the piston during a test is inhibited in a conventional manner by floating a thin laver of castor oil on top of the cell water.
_---Loaain9 piston Uゥョエ・イセイゥ 「イッBコセ -- porousーャエャエセ .,-Vieowin9 port " - Loa. meolllslIrh'/9 GDエヲGャjオBGウセイエB s 'fulis, 3 ,;;'IZO'
FIG. 1.Section through triaxial cell.
For the special drained tests, it was necessary to design and assemble a new cell base as shown on Fig. 1. With this base, the axial load may be measured inside the cell by the three load-sensitive studs which support the pedestal upon which the soil specimen is mounted. These studs were specially designed for this purpose. Each contains two elec-tric strain gauges so orientated that they are sensitive to axial load only and are unaffected by thc cell water. The studs are more sensitive to load than a proving ring of an equivalent range. In order that a mid-height porc-prcssure probe may be fitted into the specimen, provision is made in the new base for an additional prcssure connection. To eliminate joints, the probe is made of one continuous length of flexible nylon tubing. For all the tests described, the porous end plates placed against the ends of the test specimens were of sintered bronze to prevent breakage under high compression stresses.
The latex rubber membranes used to seal the specimens had a wall thickness of 0.02 or 0.03 inches.
The pressure supply system, which is capable of applying pressures up to 500 psi, is the mercury pot type (Bishop and Henkel, 1962). The standard system has been modified to supply this increased pressure, and to fit the laboratory layout. Nylon tubing and high prcssure couplings are used throughout. The pore-water-pressure measuring unit is the conventional null indicator, and the early steel type (Bishop and Henkel, 1962) was found to be adequate without modification. The loading frame used has a maximum capa-city of 100,000 pounds and the machine is gear-driven to provide a constant rate of strain which can be varied from 0.16 to 0.0001 inches per minute.
PROCEDURES
The soil was pre-mixed to the desired moisture content and allowed to "cure" for at least 24 hours prior to compac-tion. The compaction was carried out in a 3-part mould of 6 inches inside diameter, and was achieved by 56 blows of a standard drop hammer on Bf-inch-thick layers. Immediately after compaction, the specimens were removed from the mould, measured, and weighed. Except in the case of the special drained tests dry of optimum, wool wicks were placed around the perimeter of the specimens to accelerate uniform pore-pressure distribution. For all tests, the specimen was enclosed in a single rubber membrane coated with silicone grease.
For both standard and special drained tests, the material was saturated before testing. This was accomplished by first placing the specimens on a pedestal separate from the cell and subjecting them for a period of about 7 days to a small flow developed by applying a suction of -2 psi at the top and -0.5 psi at the bottom. Records of the air and water flows were kept throughout. The specimens were then placed in the cell and increasing increments of ambient pressures applied and the resulting pore prcssures observed. Pore-pressure parameter B values (Skernpton, 1954) of 0.95 or greater were accepted as an indication of full saturation. Back pressures of 40 to 50 psi were also applied during the consolidation and shear stages to further ensure saturation. For the consolidated-undrained tests, the specimens were tested at the compaction moisture content without a back pres-sure. Owing to the high initial degree of saturation obtained, both as compacted and after application of the high cell pressures, and the high values of pore pressure which result from these cell pressures, it was considered that satisfactory and applicable readings could be obtained without a back pressure and with the coarse porous end plates.
Testing speeds for both types of test were chosen using the consolidation behaviour as a guide (Bishop and Henkel, 1962) .
For the special drained tests, a porc-prcssurc probe was also installed into a pre-drilled hole at the mid-height of the specimen. In addition, in order to actually measure the piston friction, the deviator stress applied to the specimen was measured simultaneously inside and outside the triaxial cell.
RESULTS
Standard Drained Tests
The stress-strain-volume change relationships are shown on Fig. 2 and a plot of (IT'! - itGセIOR versus (IT'l
+
IT':J)/2 at failure is shown on Fig. 3. Apart from the numerical 2451200 'DOD en a... 800 en en w a:: ... 600 en a::
o
... 400 <l > w o 200 6,MVャGPYセ
V
セ 6'·.;bo
-3' /
6-6 866/
V
...
ッセ] SセP/
/V
I
V
6 -6 620 I 3 :II
セ 6'= 2 50 ----/ ' 3I.
/ /
, / 6 - 6, 384セ 1/
--
-
6' = 15 30
/
-6 3=RセX.-
-
Vセ =100V
6,-6,' 130 s,'=an' /
30
セ 6 - 6 = 1166 450 I 3/
V
6, -d:t 910L.---I
/
/ 6 '3 350/
V
6,-6 690II
-:
6' 250,//
,I
6 - 6 426 I 3-/
63= 15 6 -d 293/y
6'=100 3r.
ッLMッセセ IOU...--
6' =50V
l
-:
6 -6 1179 -I V Vセ] 450/
/
セ
953 . / 6'=35J /
I
/
6 -iセ = ....,II
3V
Vセ 250r--'I
/
Ii
/
6 1-63' 418II
/ /
-:
6' =15 3 6 ·6 = 280(1/
/
...-
6'= 100 3セ
/ '
6-6.= 153.-
-
6'e50セ
4 6 10 12 '4 16 18 4 '0 2 4 6 10 12 14セ
... d' = 503セ
6'.100 b... 3 =15 Vセ] 35 a45C-K "'""-= Vセ] 2S1 セ°
Z <l a:: -I ... en u -2 0:: ... -3 W :::!E ::J -.Jg
2%
DRY OF OPTIMUM w = 7.70/0 セ、 131.1 P.C.F. Rate af strain =.0022 in./min.AXIAL STRAIN -
%
AT OPTIMUM
w =9.7 0/ 0
セ、 =134.0 P.C.F. Rate af strain=.00043In./mln.
Vセ] 100 Vセ 150
2
%
WET OF OPTIMUMw = 11.85 0/ 0
'6d = 128.2P.C.F.
Rate of strain =.00028 in./mln. FIG. 2. Standard drained triaxial test results.
sー・cゥ。ャャ・ウエャセ セ Cl
•
x 0 0 xc•
0 LEGEND - pstc 41' ° 2 °/0 belowoptirR.Im 150 33· - 34.} X At optimum 34· -35· consolidated 0 1000 drained test.•
2 °/0 above optimum 750 34· - 35· J< 0 0 At optimum 950 34· - consolidated 0 undrained lests J< 0 ° j<セspNcゥqi
te.t 600 500 400 100 o 100 200 300 400 500 セi 2 os 600 700 800 900 1000 1100200 versus0"3' 400 100
...
--0'-"...1...
V
0 Ic-:
V
.,/' ,)o
0.3 200 3006
3 - PSIFIG. 5. Consolidated-undrained triaxial test results,
A
f 0.2A
fo.
6' -Mox.-A- jf...-
セ 634 5 0 6 3---V
セV 6セWW Ii
I 3-
VNセ 350;/
V
6 6 691 I 3l/
I ' --or--6 3セ セUP1/
""""'"
6,MVSセTWU / "セ !セO
V
セMセセ 42+---
6F150 I'//
V QVSセ 100...-
6 -VNセ 48V
MMイMMエMセ I I I 400 0::o
I-<[s
UJ o en a. I en セ 600 0:: I-en 800values of shear-strength parameters (Fig. 3), the principal points of interest from the test results are as follows:
1. There is little difference in the measured shear strength of the material compacted at the three different moisture contents. The slightly lower strength of the material com-pacted dry of optimum can be accounted for by reference to the volume change curves shown on Fig. 2, where it will be noted that, unlike specimens compacted at the other moisture contents, throughout the entire stress range the dry of optimum specimens showed no tendency to dilate. This, and the higher failure strains, may be due to the drier material developing a more "flocculated" structure during compaction (Seed, et al., 1960).
FIG.4. Consolidated-undrained triaxial test results.
AT OPTIMUM
Special Drained Tests
A summary of the results of these tests is given in Table I, and for comparison with the other tests, a plot of 2. For all three compaction moisture contents, there is only a very small decrease in the slope of the shear strength envelope with increase in confining pressure. Again, this can be related to the volume change behaviour shown on Fig. 2 where it is apparent that, for a given compaction moisture content, the slopes at failure of the axial strain versus volu-metric strain curves do not vary substantially within the range of confining pressures used. This is in contrast to the behaviour of sands, or sands and gravels (Hall and Gordon, 1963; Hirschfeld and Poulos, 1963; U.S. Army Corps of Engineers, 1963, 1964; R. A. Spence Ltd., 1963), and can be attributed to the presence of fines and the well-graded nature of the till.
3. The testing time to failure required to ensure a fully drained condition during shear increased as the compaction moisture increased. This again can probably be related to the structure developed during compaction.
Consolidated-Undrained Tests with Pore-Pressure Measurements
The stress-strain-volume change relationships are shown on Fig. 4, and a plot of (cr'I - o/セI /2 versus (cr'I
+
o/セI /2at maximum effective stress ratio is shown with the drained test results on Fig. 3. A plot of
A
r (Skempton, 1954) versus effective confining pressure, also at maximum effective principal stress ratio, is given on Fig. 5. A study of these results reveals two points of interest:1. The shear-strength characteristics in terms of effective stress are almost identical to those obtained from the stan-dard drained tests.
2. The pore-pressure parameter.,If increases considerably
from the usual low value for this type of material as the confining pressure increases.
16 16 14 12 14 12 10 8 10 STRAIN -
%
6 4 4 6 AXIAL w 9.7% 'lJ"d 133.9 PC.F. Rate of strain =.00080 In. Imln.160 en a. 120 I UJ 0:: :J 80 en en UJ 0:: a. 40 UJ 0:: 0 a.
TABLE 1. RESl:LTS OF SPECIAL DRAINED TESTS
Maximum deviator stress measured Compaction moisture content (per cent) 7.4 7.9 11.4 Effective confining pressure (psi) 50 450 4.50 Rate of strain (min.) 0.0022 0.0022 0.00028 Failure strain per cent 12 14 11 Outside cell (psi) 124 1104 1160 Inside cell (psi) 124 1100 1151 Mid-height residual pore pressures
at failure (psi) (in excessof back pressures)
o
+7.0
o
(CT'1 - CT'a)/2 versus (CT't
+
CT'3)/2 at failure is shown on Fig. 3. Since only three tests have yet been performed, it would be unwise to assume that the results are completely representative. However for these tests, three interesting facts are apparent.I. The shear-strength values are almost identical to those obtained from the standard drained tests.
2. The amount of piston friction in the apparatus was negligible. This fact is particularly significant considering that the specimens contained gravel sizes, were strained to at least 14per cent, and, in the case of the specimen compacted wet of optimum, the testing time was about Sスセ days. It should be pointed out, however, that the specimens failed by uniform bulging with almost no tilting of the top cap.
3. Although there were some small pore pressures de-veloped in the centre of the specimen during the initial stages of shearing when the rate of volume change is greatest, these soon dissipated and the pore pressures at failure were zero or negligible. This is of interest considering that the time to failure for the specimens compacted dry of optimum was only about 15 hours.
CONCLUSIONS
It is considered that the following conclusions can be drawn from the series of triaxial tests carried out on this compacted glacial till.
1. The effective angle of shearing resistance is about 34° and the measured apparent cohesion varies from about 150 psf to 1000 psf, depending on the compaction moisture content.
2. Increasing confining pressure to 450 psi has little effect on the effective shear-strength parameters. This fact is attributed to the well-graded nature of the material and to the high percentage of fines which inhibit any substantial alteration of the volume change, or dilatancy, characteristics throughout the range of confining pressure used.
3. In contrast to conclusion (2), the ratio of pore pres-sure to deviator stress at failure,
At,
is increased considerably as the confining pressure is increased.4. On the basis of a limited number of tests, the amount of piston friction which occurs with the cell used would appear to be small.
5. The method of measuring the load inside the cell by
3 load-sensitive bolts is successful and straightforward. 6. Even at the highest confining pressures, no difficulties were experienced with single rubber membranes or with the porous end plates.
7. Commercially available equipment and conventional testing techniques can be adequately adapted to suit a testing programme on fairly large-diameter specimens of glacial till at high effective confining pressures.
ACKNOWLEDGMENTS
The authors wish to thank the British Columbia Hydro and Power Authority and CASECO Consultants for permis-sion to publish the results. They would also like to acknowl-edge the assistance given by Mr. R. E. Johnson who suggested the use of the Strainsert studs.
REFERENCES
BISHOP, A. W., and D. J. HENKEL (1962). The triaxial test.
London, Arnold.
HALL, E. B., and B. B. GORDON (1963). Triaxial testing using large scale high pressure equipment. ASTM/NRC,
Sym-posium on Laboratory Shear Testing of Soils (Ottawa).
HIRSCHFELD, R.
c.,
and S. J. POULOS (1963). High pressure triaxial tests on a compacted sand and an undisturbed silt. ASTM/NRC, Symposium on Laboratory Shear Testing ofSoils (Ottawa).
R. A. Spence Ltd. (1963). Unpublished report to CASECO Consultants Ltd.
SEED, H. B., J. K. MITCHELL, and C. K. CHAN (1960). The strength of compacted cohesive soils. American Society of Civil Engineers, Research Conference 0/1 Shear Strength of
Cohesive Soils.
SKEMPTON, A. W. (1954). The pore pressure coefficients A and
B.Geotechnique,Vol.4,pp. 143-7.
U.S. Army Corps of Engineers (1963). Unpublished report to CASECO Consultants Ltd.
U.S. Army Corps of Engineers (1964). Unpublished report to CASECO Consultants Ltd.