HAL Id: insu-03188432
https://hal-insu.archives-ouvertes.fr/insu-03188432
Submitted on 2 Apr 2021HAL is a multi-disciplinary open access archive for the deposit and dissemination of sci-entific research documents, whether they are pub-lished or not. The documents may come from teaching and research institutions in France or abroad, or from public or private research centers.
L’archive ouverte pluridisciplinaire HAL, est destinée au dépôt et à la diffusion de documents scientifiques de niveau recherche, publiés ou non, émanant des établissements d’enseignement et de recherche français ou étrangers, des laboratoires publics ou privés.
Temporal trends, sources, and relationships between
sediment characteristics and polycyclic aromatic
hydrocarbons (PAHs) and polychlorinated biphenyls
(PCBs) in sediment cores from the major Seine estuary
tributary, France
Thomas Gardes, F. Portet-Koltalo, Maxime Debret, Kevin Humbert, Romain
Levaillant, Michel Simon, Yoann Copard
To cite this version:
Thomas Gardes, F. Portet-Koltalo, Maxime Debret, Kevin Humbert, Romain Levaillant, et al.. Temporal trends, sources, and relationships between sediment characteristics and polycyclic aro-matic hydrocarbons (PAHs) and polychlorinated biphenyls (PCBs) in sediment cores from the major Seine estuary tributary, France. Applied Geochemistry, Elsevier, 2020, 122, pp.104749. �10.1016/j.apgeochem.2020.104749�. �insu-03188432�
Journal Pre-proof
Temporal trends, sources, and relationships between sediment characteristics and polycyclic aromatic hydrocarbons (PAHs) and polychlorinated biphenyls (PCBs) in sediment cores from the major Seine estuary tributary, France
Thomas Gardes, Florence Portet-Koltalo, Maxime Debret, Kevin Humbert, Romain Levaillant, Michel Simon, Yoann Copard
PII: S0883-2927(20)30241-9
DOI: https://doi.org/10.1016/j.apgeochem.2020.104749
Reference: AG 104749
To appear in: Applied Geochemistry
Received Date: 4 June 2020 Revised Date: 27 August 2020 Accepted Date: 27 August 2020
Please cite this article as: Gardes, T., Portet-Koltalo, F., Debret, M., Humbert, K., Levaillant, R., Simon, M., Copard, Y., Temporal trends, sources, and relationships between sediment characteristics and polycyclic aromatic hydrocarbons (PAHs) and polychlorinated biphenyls (PCBs) in sediment cores from the major Seine estuary tributary, France, Applied Geochemistry, https://doi.org/10.1016/ j.apgeochem.2020.104749.
This is a PDF file of an article that has undergone enhancements after acceptance, such as the addition of a cover page and metadata, and formatting for readability, but it is not yet the definitive version of record. This version will undergo additional copyediting, typesetting and review before it is published in its final form, but we are providing this version to give early visibility of the article. Please note that, during the production process, errors may be discovered which could affect the content, and all legal disclaimers that apply to the journal pertain.
40 30 0∑PAHs concentrations (mg kg10 20 -1) 2015 2005 1965 1975 1985 1995 30 ∑PAHs (mg kg -1) 20 10 0 0.63 0.65 0.67 0.69 0.71 0.73 RC/TOC R² = 0.84 0.7 0.4 0.6 0.5 IP / (IP+Bghi) 0.5 0.55 0.6 0.65 0.7 Tempor al tr end Petroleum Combustion Grass / Wood / Coal Combustion 2 1.5 0 0.5 1 ∑PCBs concentrations (mg kg-1) 2015 2005 1965 1975 1985 1995 2 1.5 0 0.5PCB28 / PCB1531 Journal Pre-proof
Temporal trends, sources, and relationships between sediment
1characteristics and polycyclic aromatic hydrocarbons (PAHs) and
2polychlorinated biphenyls (PCBs) in sediment cores from the
3major Seine estuary tributary, France
45
Thomas Gardes1,2,*, Florence Portet-Koltalo2, Maxime Debret1, Kevin Humbert1,2, Romain
6
Levaillant1, Michel Simon1, Yoann Copard1
7 8
1Normandie Univ, Rouen, UNIROUEN, UNICAEN, CNRS, M2C, 76000 Rouen, France.
9
2Normandie Univ, Rouen, UMR CNRS 6014 COBRA, 55 Rue Saint Germain, 27000 Evreux, France.
10
*Corresponding author: [email protected]
11 12
Abstract
13
Temporal trends in polycyclic aromatic hydrocarbons (PAHs) and polychlorinated biphenyls
14
(PCBs) were reconstructed from sediment cores collected from two ponds downstream of the
15
Eure River watershed. PAHs exhibited a positive correlation with fine fractions, but mainly
16
with the refractory organic carbon measured in the sediments, which suggests PAH inputs
17
from materials largely composed of refractory carbon (e.g. soot). Since the 1940s, PAH
18
concentrations have ranged between 2.93–38.20 and 2.27–28.20 mg kg-1. Based on the
19
temporal distribution of isomers and diagnostic ratios, the PAHs in the sediments were found
20
to be predominantly of pyrogenic origin, particularly in the 1940s–1960s, when PAH levels
21
were particularly high. PCBs also showed an affinity with the fine fraction and with refractory
22
organic carbon, albeit less so than PAHs. Since the 1940s, PCB concentrations ranged
23
between 0.02–1.57 and 0.09–1.60 mg kg-1. The recorded PCB temporal trends were mainly
24
associated with the production, consumption, and banning of these chemicals in France.
25
According to the temporal distribution of PCB congeners, high levels in the 1950s–1970s
26
were linked to "technical mixture" discharges into waterways, which were mainly composed
27
of "low chlorinated congeners", whereas PCB levels after the 1970s were of atmospheric
28 origin. 29 30 Keywords 31
Temporal trends; PAHs; PCBs; sediment cores; refractory organic carbon
32 33
1. Introduction
34 35
Persistent organic pollutants (POPs) are ubiquitous environmental contaminants that began
36
to be widely produced and consumed after the Second World War (Bigus et al., 2014). These
37
organic compounds are not only very stable and therefore difficult to degrade or biodegrade,
38
but are also often very toxic (Bigus et al., 2014). Additionally, these compounds are generally
39
highly hydrophobic (Wan et al., 2011; Tobiszewski and Namieśnik, 2012) and therefore tend
40
to bind to suspended particulate matter (SPM) transported by rivers, thereby accumulating in
41
aquatic systems (Zennegg et al., 2007).
42
Polycyclic aromatic hydrocarbons (PAHs) are POPs that are released into the environment
43
both from natural (e.g. fires, volcanoes) and anthropogenic sources (e.g. incomplete
44
combustion processes, petroleum product leakage), the latter becoming predominant in the
45
twentieth century (Bigus et al., 2014). PAHs enter aquatic environments via atmospheric
46
deposition, wastewater discharge from industrial sites, or surface runoff from urban or
47
industrial areas (Heemken et al., 2000). Petrogenic PAHs (i.e. those derived from petroleum
48
products or kerogen maturation) are generally emitted directly into aquatic environments,
49
whereas pyrogenic PAHs (i.e. those derived from combustion processes) can be emitted
50
directly into aquatic environments (e.g. from use or release of coal tar, creosote, manufactured
51
gas plant wastes and leaking or improperly disposed of used motor oil) or first emitted into
52
the atmosphere and subsequently enter aquatic environments (Tobiszewski and Namieśnik,
53
2012). Atmospheric PAH emissions may be associated with particles; alternatively, these
54
compounds may occur in the gaseous phase when emitted at high temperatures, after which
55
they may condense onto particles upon cooling (Tobiszewski and Namieśnik, 2012). PAHs
56
are generally adsorbed onto fine particles but can be transferred from fine to coarser particles
57
through aggregation over time (Oliveira et al., 2011). PAHs preferentially accumulate in
58
sediments after entering streams due to their hydrophobicity and generally undergo few or no
59
changes over many years (Hatzinger and .Alexander, 1995; Douglas et al., 1996; Page et al.,
60
1999). Unlike light PAHs (2–3-ring PAHs), which are more volatile and metabolisable by
61
microorganisms, heavy PAHs (4–6-ring PAHs) are considered to be relatively stable within
62
sediment matrices. This accumulation in the sediment can be modulated by the sediment’s
63
composition and characteristics (e.g. particle size, organic carbon (Corg) content) (Means et
64
al., 1980; Tobiszewski and Namieśnik, 2012). Notably, PAHs in streams are preferentially
65
adsorbed onto fine particles (Karickhoff et al., 1979), and thus fine particle sedimentation
66
leads to the concurrent sedimentation of associated PAHs. PAHs are preferentially adsorbed
67
onto Corg-rich matrices, and therefore the Corg content in the sediment matrix controls PAHs
68
behaviour in sediments (Karickhoff et al., 1979; Zhang et al., 2004; Shi et al., 2007).
69
Moreover, a significant correlation between PAHs and Corg (and soot) levels tends to occur
70
when PAHs are derived mainly from atmospheric inputs (Tsapakis et al., 2003).
71
Polychlorinated biphenyls (PCBs) are synthetic compounds that were used in various
72
industrial activities due to their high thermal stability and dielectric properties. Their
wide-73
spread use, especially after the Second World War, has therefore led to a significant
74
accumulation of these compounds in the environment (Piérard et al., 1996; Breivik et al.,
75
2002). In France, the use of PCBs was banned in 1987 due to their proven toxicity (Decree
76
87-59, 1987). The transport of PCBs from terrestrial sources to aquatic environments may
77
result from direct inputs, following leakage from systems containing them (Abarnou et al.,
78
1987; Duursma et al., 1989), or from atmospheric deposition following volatilization
79
(Chevreuil et al., 1989; Quémerais et al., 1994; Granier and Chevreuil, 1997). In the
80
atmosphere, PCBs are predominantly present in their gaseous phase, after which they bind to
81
particles through atmospheric deposition (Granier and Chevreuil, 1997). Similar to PAHs,
82
PCBs are very chemically stable and are only minimally transformed during the
83
sedimentation process. Due to their lipophilic nature, PCBs accumulate in soils and sediments
84
by binding to fine particles that are rich in organic matter (OM) and have a high
surface-to-85
volume ratio (Karickhoff et al., 1979; Gschwend and Wu, 1985). Nevertheless, Piérard et al.
86
(1996) observed that the affinity of PCBs to OM cannot fully explain the distribution of
87
sediment PCB concentrations, and that particle size is the major factor explaining their
88
distribution. Specifically, PCBs generally accumulate in fine particles, especially highly
89
chlorinated PCBs, which have a particular affinity for fine fractions (< 63 μm), whereas low
90
chlorinated PCBs have more affinity for coarse fractions (> 63 μm) (Piérard et al., 1996;
91
Salvadó et al., 2013).
92
Based on sediment cores collected in accumulation areas (e.g. dams, floodplains, ponds), the
93
temporal trends of PAHs and PCBs can be reconstructed (Sanders et al., 1992; Van Metre et
94
al., 1997; Budzinski et al., 1997; Bertrand et al., 2015; Cai et al., 2016). Thus, it is possible to
95
reconstruct the contamination trends of a watershed, generally in relation to the intensification
96
of significant anthropogenic activities since the industrial revolution (i.e. over the past ~150
97
years). Sediment deposits typically provide insights into multiple contaminant sources and
98
therefore it is necessary to discriminate sources by analysing the distribution of PAH isomers
99
and PCB congeners over time via measured-concentration diagnostic ratios (Budzinski et al.,
100
1997; Yunker et al., 2002; Franců et al., 2010; Cai et al., 2016).
101
The Seine River watershed is among the most heavily impacted watersheds in Europe
102
(Meybeck, 2002) and therefore the Seine River has been afflicted with substantial heavy
103
metal (Le Cloarec et al., 2011) and organic contaminant (Lorgeoux et al., 2016) burdens.
104
Although many studies have examined POP contaminations in water, SPM, and sediments in
105
the Seine River (Chevreuil et al., 1990; Chevreuil and Granier, 1991; Chevreuil et al., 1998;
106
Blanchard et al., 2007; Lorgeoux et al., 2016), few studies have focused on its tributaries (e.g.
107
the Marne River) (Chevreuil and Granier, 1991; Ollivon et al., 2002) or the Seine estuary
108
(Abarnou et al., 1987; Marchand, 1989; Van Metre et al., 2008). Regarding the latter, only the
109
works of Van Metre et al. (2008) have focused on sedimentary archives downstream of the
110
estuary; however, contamination sources in this area appear to be intra-estuarine.
111
The main Seine estuary tributary is the Eure River. Moreover, the Eure River watershed was
112
recently found to carry significant heavy metal burdens since the 1940s, which may have
113
impacted the sediment quality of the Seine estuary (Gardes et al., 2020a, 2020b). Therefore,
114
this study aimed to establish a link between sediment deposit characteristics and POPs, as
115
well as to reconstruct the temporal trends in PAHs and PCBs accumulation based on sediment
116
cores collected downstream of the Eure River watershed. The distribution of some PAH
117
isomers and PCB congeners was also studied to determine contaminant sources and the
118
evolution of these sources over time.
119 120
2. Materials and Methods
121 122
2.1.Description of core sites
123 124
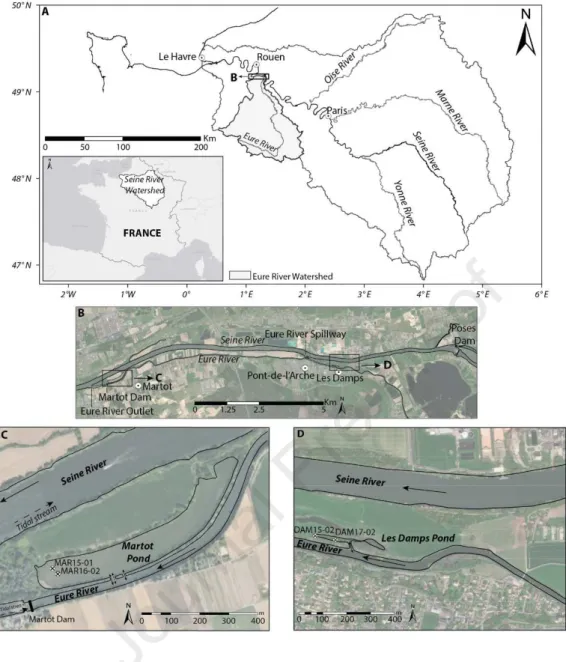
The Eure River (watershed: 6017 km²; mean annual flow: 22.13 ± 6.69 m3 s-1) is one of the
125
largest tributaries of the Seine River (i.e. only surpassed by the Yonne, Marne, and Oise
126
rivers) and the main contributing river in its estuarine section (Fig. 1A). Les Damps Pond
127
(average depth: 50 cm; area: < 1 ha) and Martot Pond (area: ~7 ha) are located approximately
128
10 km and less than 1 km upstream of the Eure River outlet, respectively (Fig. 1B). Unlike
129
Les Damps Pond, Martot Pond is affected by the Seine estuary during tidal flows through the
130
Eure River outlet. Moreover, Martot Dam, located 200 m downstream of the Martot Pond,
131
prevented tidal flows (for tidal coefficients lower than 70) until its removal in October 2017.
132
Sediment cores were collected using a UWITEC® gravity core and 90 mm diameter PVC
133
tubes. The water-sediment interface was preserved for each coring. For Les Damps Pond,
134
sediment cores DAM15-02 and DAM17-02 were collected in January 2015 and January 2017,
135
respectively (Fig. 1C; Table 1). For Martot Pond, sediment cores MAR15-01 and MAR16-02
136
were collected in January 2015 and February 2016, respectively (Fig. 1D; Table 1). This study
137
was conducted on sediment cores from two accumulation zones to (i) ensure that the recorded
138
temporal trends were representative of a global signal and (ii) determine whether
139
sedimentation in Martot pond was impacted by inputs from the Seine estuary.
140 141
2.2.Grain size and total organic carbon analysis
142 143
Grain size distribution was measured by laser diffraction (LS 13320 Particle Size Analyser
144
Beckman Coulter™). The measurements were conducted every cm by integrating 1 cm on the
145
MAR15-01 and DAM15-02 cores.
146
Sediment cores were analysed using Rock-Eval 6 (RE6) pyrolysis ("Turbo" model RE6
147
pyrolyzer; ISTO laboratory, University of Orléans; see details in Copard et al. (2006)). Total
148
organic carbon content (TOC; %) was measured and OM quality was determined by
149
measuring the hydrogen index (HI; i.e. indicator of the hydrogen richness; mg HC g-1 TOC)
150
and oxygen (OI; indicator of the degree of oxidation of the OM; mg O2 g-1 TOC) (Lafargue et
151
al., 1998; Carrie et al., 2012). Additionally, the residual carbon content (RC; %), which
152
corresponds to the refractory Corg (obtained during the oxidation phase), was also measured
153
(Lafargue et al., 1998). The measurements were conducted on the MAR15-01 and DAM17-02
154
cores at 1- and 2-cm intervals, respectively.
155 156
2.3.Particulate PAHs/PCBs extraction, analysis and quality control and assurance
157 158
Each sediment core segment was freeze-dried, crushed, and stored at -25 °C. Afterwards,
159
PAHs and PCBs extractions were performed using microwave-assisted extraction (MAE)
160
(MarsX, CEM Corporation). Approximately 2–3 g of sub-samples were taken from each dried
161
portion of the sediment cores and spiked with 15 µL of surrogate standards (perdeuterated
162
fluoranthene and benzo[a]pyrene, and PCB156 at 100 mg L-1). Each sub-sample was
163
extracted in duplicate with 40 mL of a toluene:acetone 1:1 (v:v) mixture at 130 °C for 30 min
164
(1,200 W). The extracts were filtered through 0.2-µm PTFE filters, evaporated, and
165
reconstituted in 1.5 mL toluene. Each extract (990 µ L) was mixed with 10 µ L of two internal
166
standards (perdeuterated phenanthrene and perylene at 100 mg L-1), after which 1 µL of the
167
resulting mixture was injected (splitless mode, 285 °C) into a gas chromatographer (6850
168
series, Agilent), coupled with a mass spectrometer (5975C series). The separation was
169
performed using a 60 m × 0.25 mm i.d. DB-5MS capillary column (0.25 µm film thickness;
170
J&W Scientific), with helium as the carrier gas (1.4 mL min-1). The oven temperature was
171
programmed at 60 °C for 1.2 min, increased to 190 °C (40 °C min-1) and then to 305 °C (6 °C
172
min-1). The MS detector operated at 70 eV. Quantification was based on selected ion
173
monitoring to improve sensitivity. The extraction method was validated using a certified
174
reference sediment (CNS391, Sigma-Aldrich). Mean recoveries (n=5) were in the 86.3–
175
125.8% range for the 16 priority PAHs (US EPA, 2015) and in the 81.9–113.6% range for the
176
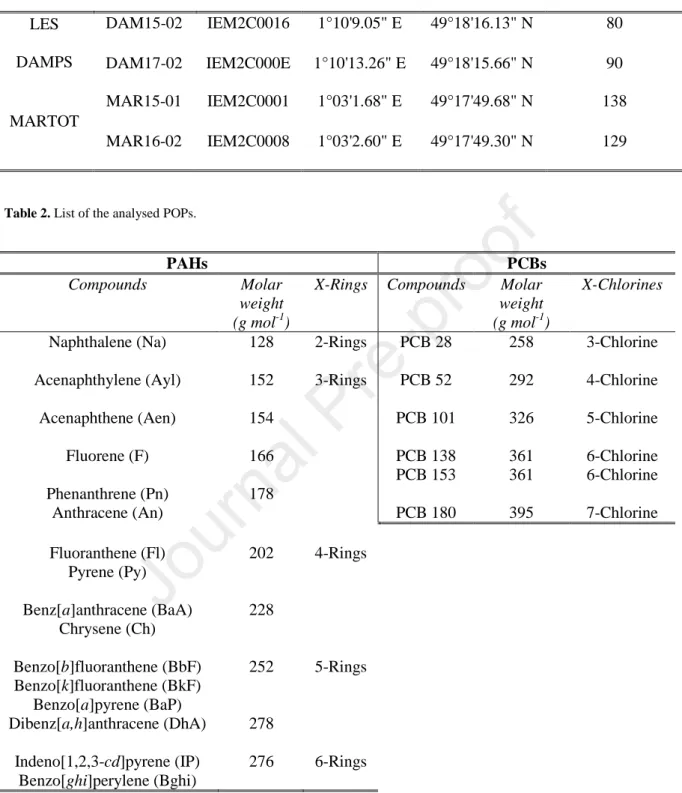
6 studied PCBs. Table 2 summarizes all PAHs and PCBs studied herein.
177 178
3. Results and discussion
179 180
3.1.Sedimentology characteristics of the sediment cores
181 182
The sediment deposits in Martot Pond are characterised by two sedimentary facies, as
183
previously described by Gardes et al. (2020b). The “Seine Unit” facies corresponds to
184
sediment deposits from the Seine River watershed until the early 1940s, when Martot Pond
185
was connected to the Seine channel. The grain size distribution exhibited a low D50 (D50 =
186
13.8 ± 7.0 μm), the TOC content (TOCmean = 1.75 ± 0.33%) was low, HI (HImean = 147 ± 24
187
mg HC g-1 TOC) was constant, OI (OImean = 260 ± 35 mg O2 g-1 TOC) increased to 103.5 cm
188
followed by a decrease, and the average RC/TOC was 0.76 ± 0.01. The “Eure Unit” facies, for
189
which an age model has been established, corresponds to the Eure River inputs since the
190
1940s, with a sedimentation rate of 12.73 ± 2.2 mm y-1 (Gardes et al., 2020b). For this facies,
191
the grain size distribution was centred around a D50 of 33.9 ± 7.8 μm and the TOC content
192
(TOCmean = 3.88 ± 1.49%) increased towards the surface, with high contents (TOC = 8.26 ±
193
0.19%) in the 9–12 cm range. Unlike OI (OImean = 150 ± 17 mg O2 g-1 TOC), HI (HImean =
194
279 ± 23 mg HC g-1 TOC) increased from the transition between the two facies. RC/TOC
195
(RC/TOCmean = 0.70 ± 0.02) decreased from the interface between the two facies and
196
continued to decrease towards the surface (Fig. 2).
197
The sediment deposits in Les Damps Pond are also referred to as the “Eure Unit” facies, and
198
correspond to the Eure River inputs since the 1940s, with a sedimentation rate of 12.2 mm y-1
199
(Gardes et al., 2020b). These sediment deposits are characterised by a grain size distribution
200
centred around a D50 of 29.5 ± 6.7 μm, comparable to that measured for the "Eure Unit" facies
201
in Martot Pond, with a constant TOC content (TOCmean = 5.36 ± 0.47%) that is slightly higher
202
than that of Martot Pond. HI (HImean = 302 ± 23 mg HC g-1 TOC) and OI (OImean = 145 ± 10
203
mg O2 g-1 TOC) showed a slight increase towards the surface. RC/TOC (RC/TOCmean = 0.68
204
± 0.02) decreased towards the surface, similar to our observations in Martot Pond (Fig. 2).
205
In Martot and Les Damps ponds, HI and OI for the “Eure Unit” facies suggested a mix
206
aquatic/terrestrial origin (Gardes et al., 2020b) and the mean RC/TOC values were similar and
207
comparable to those measured in the surface sediments of other European rivers (e.g. the
208
Danube, Elbe, Ebro, and Meuse rivers; Poot et al. (2014)). For both ponds, the sedimentation
209
rates were found to be high (e.g. ≥ 10 mm y-1), and therefore it is unlikely that the sediments
210
are affected by early diagenesis processes (Van Metre et al., 1997; Callender, 2000).
211 212
3.2.Relationships between PAHs, PCBs, and sediment characteristics
213 214
In Martot Pond, PAH and PCB concentrations were determined on the MAR16-02 core
215
(Sections 3.3 and 3.4), whereas the grain size distribution and TOC contents (and associated
216
OM parameters) were determined on the MAR15-01 core (Section 3.1). In Les Damps Pond,
217
PAH and PCB concentrations were determined on the DAM17-02 core (Sections 3.3 and 3.4),
218
as well as TOC contents, whereas grain size distribution was determined on the DAM15-02
219
core. Therefore, the measurements were averaged over decades for each core to determine the
220
correlations between PAH and PCB contents and grain size or OM in both ponds.
221
In both ponds, total PAH concentrations (∑PAHs) and light (2-3-ring) or heavy (4-6-ring)
222
PAHs exhibited weak positive correlations with the clay fraction (< 2 μm) (0.28 < R < 0.39
223
and 0.23 < R < 0.33 for Martot and Les Damps ponds, respectively) (Fig. 3A). In Les Damps
224
Pond, PAHs showed strong positive correlations with the fine fraction (< 63 μm), particularly
225
with the silt fraction (2–63 μm) (0.74 < R < 0.8). Finally, PAHs showed negative correlations
226
with the coarse fraction (> 63 μm) in Les Damps Pond (-0.69 < R < -0.75). Therefore, PAHs
227
tend to bind more strongly to the fine fraction (Karickhoff et al., 1979; Fernandes et al., 1997;
228
Shi et al., 2007), and more specifically to the silt fraction in Les Damps Pond, as previously
229
demonstrated elsewhere by Ab Razak et al. (1996) with sediment cores from the Kinnickinnic
230
River (US) and Burgess et al. (2001) with surface sediments collected in the Narragansett Bay
231
estuary (US), or to the clay fraction in the Martot Pond, as also reported by Zhang et al.
232
(2004) with surficial sediments of Deep Bay (China).
233
PAHs were negatively correlated with (i) the TOC in Martot Pond (-0.63 < R < -0.80), (ii)
234
HI (-0.48 < R < -0.77 and -0.89 < R < -0.93 for Martot and Les Damps ponds, respectively)
235
and OI (-0.27 < R < -0.76 and -0.55 < R < -0.6 for Martot and Les Damps ponds,
236
respectively). However, ∑PAHs showed strong positive correlations with the RC/TOC ratio
237
(R = 0.86 and R = 0.95 for Martot and Les Damps ponds, respectively) (Fig. 3A).
238
The distribution of PAHs in the sediment is thus partly controlled by the presence of fine
239
particles, but more predominantly controlled by the presence of refractory Corg. Moreover, in
240
Martot Pond, the correlation between PAHs and RC/TOC tended to increase with the molar
241
mass of the PAHs (from R = 0.53 for 2-ring PAHs to R = 0.91 for 6-ring PAHs). However,
242
this trend was not observed in Les Damps Pond, where the correlation between PAHs and
243
RC/TOC was very strong regardless of molar mass (0.91 < R < 0.95). A correlation between
244
the PAHs and the proportion of refractory Corg (i.e. RC/TOC) would thus demonstrate that
245
part of the PAHs was bound to refractory carbonaceous compounds. Such an affinity has been
246
previously identified, albeit from the RC (%) (Poot et al., 2014) and not from the RC/TOC
247
ratio. Additionally, PAHs showed a correlation with the RC/TOC ratio regardless of ring
248
number, but only in Les Damps Pond (Fig. 3B). However, this trend remains to be confirmed,
249
especially to determine whether the proportion of refractory Corg is indeed the limiting factor,
250
as suggested by the observed correlations.
251
PCBs showed positive correlations with the fine fraction (clay + silt) (0.20 < R < 0.56 and
252
0.16 < R < 0.71 for Martot and Les Damps ponds, respectively) and negative correlations with
253
the coarse fraction (-0.20 < R < -0.56 and -0.16 < R < -0.71 for Martot and Les Damps ponds,
254
respectively) (Fig. 3A). A positive correlation of PCBs with the fine fraction suggests an
255
affinity of PCBs for fine particles, but no clear trends (e.g. as a function of PCB chlorination
256
degree) were evident. Moreover, Piérard et al. (1996) demonstrated that low-chlorinated
257
PCBs showed an affinity for the coarse fraction, which was not observed in our study.
258
PCBs also showed negative correlations with TOC in Martot Pond (-0.69 < R < -0.79), as
259
well as with HI (-0.35 < R < -0.79 and -0.27 < R < -0. 92 for Martot and Les Damps ponds,
260
respectively) and OI (-0.37 < R < -0.72 and -0.15 < R < -0.79 for Martot and Les Damps
261
ponds, respectively) (Fig. 3A). However, the ∑PCBs showed positive correlations with the
262
RC/TOC ratio (R = 0.68 and R = 0.79 for Martot and Les Damps ponds, respectively). The
263
distribution of PCBs in sediments is thus partly controlled by fine particles and refractory
264
Corg, but the affinity between PCBs and refractory Corg is generally less marked than for
265
PAHs.
266 267
3.3.PAHs in sediment cores
268 269
3.3.1. General PAH trends in sediment cores
270
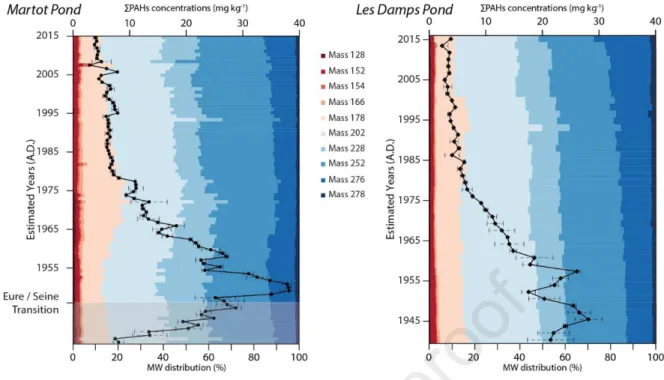
Total PAH concentrations were measured for the MAR16-02 and DAM17-02 cores (Fig. 4)
271
For the MAR16-02 core Seine Unit (78–90 cm), PAH concentrations ranged from 7.43 to
272
28.8 mg kg-1 (PAHmean = 19.9 ± 1.47 mg kg-1) and showed a constant increase towards the
273
Eure Unit. For the Eure Unit of the MAR16-02 and DAM17-02 cores, concentrations ranged
274
between 2.93–38.20 mg kg-1 (PAHmean = 12.70 ± 0.51 mg kg-1) and 2.27–28.20 mg kg-1
275
(PAHmean = 11.10 ± 0.89 mg kg-1), respectively. For the MAR16-02 core, the upward trend
276
measured in the Seine Unit continued after the transition to the Eure Unit, reaching a peak of
277
38.20 ± 1.70 mg kg-1 in the late 1940s. For the DAM17-02 core, high concentrations were
278
measured during the 1940s–1950s and two peaks were observed at 28.20 ± 2.44 and 26.10 ±
279
0.58 mg kg-1. PAH concentrations began to decrease from the 1960s to the early 1980s. For
280
the most recent deposition (post-1980s), concentrations were largely constant, ranging
281
between 4 and 6 mg kg-1 (MAR16-02: 5.87 ± 0.26 mg kg-1; DAM17-02: 4.00 ± 0.33 mg kg-1).
282
The two sediment records showed high concentrations during the 1940s–1960s, following
283
the trends determined for the Seine River (Lorgeoux et al., 2016). Notably, although the
284
maximum levels measured by these authors were more than twice those measured for the
285
lower reaches of the Eure River, the maximum values obtained in the Eure River were within
286
the same order of magnitude as the concentrations measured in sediments collected
287
downstream of the Marne River watershed (Ollivon et al., 2002). Moreover, the observed
288
maxima were higher than those measured in other French watersheds, such as the Loire River
289
watershed (Bertrand et al., 2015). Nonetheless, the Eure River watershed and the Eure River
290
flow were ~13 and 30 times lower than those of the Seine River and ~20 and 50 times lower
291
than those of the Loire River, showing the severity of PAH contamination in the Eure River
292
watershed, particularly during the 1940s–1960s. Moreover, the obtained maxima were also
293
higher than those measured in surface sediments of several large European lakes (Fernández
294
et al., 1999), SPM from several large French and European rivers (Rhone, Tamar, Scheldt and
295
Rhine rivers; Fernandes et al. (1999)), or in sediments from Canadian lakes located near an oil
296
sands mining site (Ahad et al., 2015). Concentrations for the most recent deposits are
297
comparable to those determined for recent sediment deposits in the Seine Basin (Lorgeoux et
298
al., 2016), SPM collected in the Seine River (Gasperi et al., 2009), or concentrations
299
measured in the Loire River watershed since the late 1980s (Bertrand et al., 2015). In
300
addition, some PAH concentrations recorded during the 1940s–1960s exceeded the probable
301
effect concentrations (PECs; equal to 22.8 mg kg-1 for total PAHs) defined by MacDonald et
302
al. (2000), as the level above which effects on benthic biota are likely to be observed,
303
demonstrating the potential toxicity of the accumulated sediments, especially in case of
304
remobilization.
305
The reconstruction of PAH temporal trends therefore demonstrated significant PAH
306
contamination but did not provide information on the sources responsible for these
307
contaminations. To achieve this, it was necessary to study the distribution of isomers over
308
time (Yunker et al., 2002).
309 310
3.3.2. Distribution of PAH molar weights and isomers throughout the cores
311
The abundances of 2-ring PAHs (mass 128; Na) were <1% and those of 3-ring PAHs
312
(masses 152, 154, 166, and 178) were between 11–23% and 10–18% of the total PAHs for
313
MAR16-02 and DAM17-02, respectively. Pn and An (mass 178) were the main components
314
of this fraction, representing on average between 11.1% and 12.4% of the total PAHs. 4-ring
315
PAHs (masses 202 and 228) were mostly represented with abundances between 34–51%
316
(MAR16-02) and 36–46% (DAM17-02). The abundances of the 5-ring PAHs (masses 252
317
and 278) were between 24–42% (MAR16-02) and 25–30% (DAM17-02). The abundances of
318
6-ring PAHs (mass 276; IP and Bghi isomers) were between 7–15% (MAR16-02) and 11–
319
25% (DAM17-02).
320
This important contribution of 4-, 5-, and 6-ring PAHs has been observed in other French
321
watersheds (e.g. Seine River watershed (Lorgeoux et al., 2016); Loire River watershed
322
(Bertrand et al., 2015)) and is frequently observed in sediments downstream or adjacent to
323
industrialized and/or urbanized areas (Yunker et al., 2002). Isomers with masses of 202, 228,
324
252, and 276 are the major components of gasoline and diesel soot, as well as coal
325
combustion emissions, of which the 202- and 252-mass isomers are predominant (Wang et al.,
326
1999; Yunker et al., 2002). Low molecular weight (LMW) PAHs (2-3-rings) are more
327
abundant in petrogenic products and low- to moderate-temperature combustion processes (e.g.
328
biomass and coal burning in homes), whereas high molecular weight (HMW) PAHs
(5-6-329
rings) are products of high-temperature combustion of coal or petroleum from large power
330
plants and factories or vehicular emissions (Ding et al., 2014). Thus, sediments of the lower
331
reaches of the Eure River exhibited an anthropogenic pyrogenic PAH signature (Yunker et al.,
332
2002), which can partly explain the strong correlation between PAHs and refractory Corg in
333
the sediments. Indeed, soot is mainly composed of refractory Corg (Poot et al., 2014) and the
334
strong link between PAHs and RC/TOC could confirm a predominant atmospheric input of
335
PAHs (especially heavy PAHs) through soot from combustion processes. Nevertheless, this
336
hypothesis must be further confirmed, as the link between PAHs and refractory Corg could
337
occur during transport or deposition of the latter on the watershed soils.
338
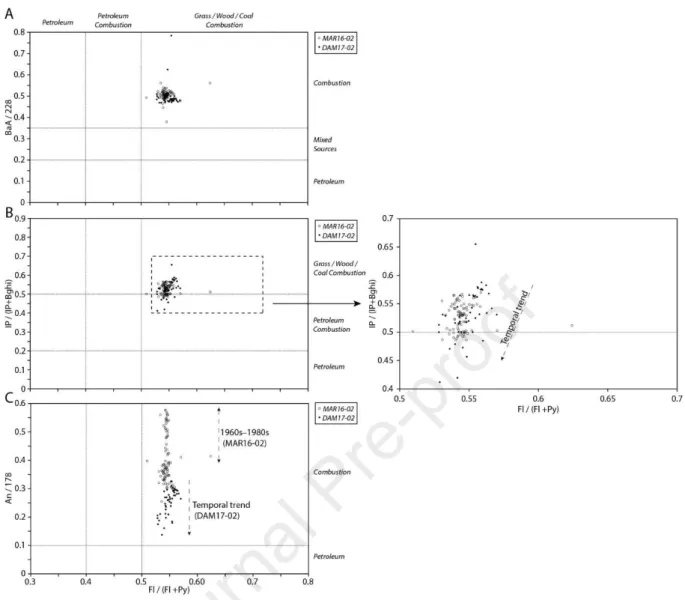
In addition to discriminating between pyrogenic and petrogenic sources, diagnostic PAH
339
ratios can be used to distinguish combustion sources (e.g. petroleum, coal, or wood
340
combustion) (Yunker et al., 2002). Therefore, different diagnostic ratios based on the ratios of
341
light and heavy PAHs were calculated (Fig. 5). The Fl and Py isomers were the first and third
342
most abundant isomers for MAR16-02 (Fl: 14.5%; Py: 12.1%) and DAM17-02 (Fl: 16.6%;
343
Py: 13.6%), respectively. All Fl/(Fl+Py) ratios exceeded 0.5 (Fl/(Fl+Py)mean = 0.54 ± 0.01 for
344
MAR16-02 and Fl/(Fl+Py)mean = 0.55 ± 0.01 for DAM17-02), which is suggestive of a strong
345
preponderance of coal and/or wood combustion as the main sources of PAH contamination
346
(Budzinski et al., 1997; Yunker et al., 2002), as in the Seine River watershed (Lorgeoux et al.,
347
2016). Moreover, the BaA and Ch isomers were among the most abundant for MAR16-02
348
(BaA: 8.8%; Ch: 8.4%) and DAM17-02 (BaA: 6.4%; Ch: 6.5%). The calculated BaA/228
349
(BaA / (BaA + Ch) vs Fl/(Fl+Py)) ratios were all greater than 0.45 (BaA/228mean = 0.51 ± 0.02
350
for MAR16-02; BaA/228mean = 0.50 ± 0.05 for DAM17-02), which also suggests that the
351
PAHs stored in the ponds of the lower reaches of the Eure River had pyrogenic rather than
352
petrogenic source signatures (Fig. 5A) (Yunker et al., 2002). However, no logic was
353
established in terms of temporality because the set of calculated ratios was limited to a
354
restricted domain with little variability.
355
The average ratios obtained from the isomers of mass 276 (IP/(IP+Bghi) vs Fl/(Fl+Py)) were
356
greater than 0.5 (IP/(IP+Bghi)mean = 0.53 ± 0.02 for MAR16-02; IP/(IP+Bghi)mean = 0.53 ±
357
0.04 for DAM17-02) but some values were below 0.5 (Fig. 5B). Fig. 5B shows that a
358
temporal trend could be identified: the IP/(IP+Bghi) ratio was below 0.5 the mid-1980s for
359
MAR16-02 and DAM17-02, due to an increase in the contribution of isomers with a mass of
360
276. This indicates that sources linked to petroleum combustion intensified from the late
361
1980s onwards; however, the BaA/228 ratio (Fig. 5A) was not descriptive of this temporal
362
evolution. BaA (MW = 228) and BaP (MW = 278) have been shown to be more sensitive to
363
photodegradation than most other PAHs (except An) when emitted to the atmosphere (Yunker
364
et al., 2002). Therefore, given that isomers with masses of 276 and 202 are more stable than
365
those with masses of 278 and 228, their use in diagnostic ratios allows for a better
366
differentiation between combustion sources without significant artefacts related to their
367
subsequent transformations.
368
The An/178 (An/(An+Pn) vs Fl/(Fl+Py)) ratios obtained for the two sediment records were
369
greater than 0.1 (Fig. 5C). A ratio of 0.1 indicates a very small proportion of An relative to
370
Pn. This is likely associated with substantial An photodegradation (i.e. given that An is much
371
less stable than Pn) from the combustion source to its final deposition via atmospheric
372
transport. On the other hand, the greater the distance from the combustion source to the
373
deposition zone, the more the ratio tends towards 0.1 (Yunker et al., 2002). However, in
374
contrast to previously studied ratios, the An/178 ratio averages are significantly different
375
within the two sediment records (An/178mean = 0.41 ± 0.09 for MAR16-02; An/178mean = 0.25
376
± 0.04 for DAM17-02) and their temporal trends were also distinct. In the case of the
377
DAM17-02 core, the ratio generally tended towards 0.10 from the 1940s to the present day,
378
i.e. towards a source corresponding mainly to combustion. This was also true for the
MAR16-379
02 core after the 1990s. However, the An/178 ratio for the MAR16-02 core exhibited high
380
values (> 0.4) over the mid-1960s–1990s due to an increase in An concentrations throughout
381
this period. Within the Seine River watershed, an enrichment in An in sediments was also
382
recorded from 1971 onwards, without its origin being determined (Lorgeoux et al., 2016). It
383
would appear that for the sediments of the Martot Pond, this increase started a few years
384
earlier and stopped around the 1990s. Nonetheless, these inputs may share the same origin,
385
which could be attributed to oil discharges in an aquatic system that did not undergo
386
combustion. As the transport of PAHs was not carried out through the atmosphere, An was
387
not affected by photodegradation and its concentration thus remained close to that of Pn
388
(Tobiszewski and Namieśnik, 2012). As mentioned previously, Martot Pond was likely
389
impacted by the contributions of the Seine estuary during tidal flows, which is not the case for
390
Les Damps Pond, located upstream. However, Martot Pond is close to the industrial areas of
391
Rouen, which were marked by strong petrochemical activity and significant river transport of
392
oil between the 1960s and 1990s. It appears that after the 1990s, oil leaks during transport
393
greatly decreased, leaving combustion processes as the only sources of sediment
394 contamination. 395 396 3.4.PCBs in sediments cores 397 398
3.4.1. General PCB trends in sediment cores
399
Total PCB concentrations were recorded for the MAR16-02 and DAM17-02 cores (Fig. 6).
400
PCBs were not detected in the Seine Unit (78–90 cm) of MAR16-02 core. In contrast, the
401
Eure Unit of MAR16-02 and DAM17-02 exhibited concentrations ranging between 0.02–1.57
402
mg kg-1 (PCBmean = 0.72 ± 0.05 mg kg-1) and 0.09–1.60 mg kg-1 (PCBmean = 0.50 ± 0.06 mg
403
kg-1). For MAR16-02, PCBs levels increased at the transition between the two sedimentary
404
facies and reached a peak of 1.57 ± 0.06 mg kg-1 in the late 1950s, whereas a 1.60 ± 0.12 mg
405
kg-1 peak was recorded in DAM17-02 in the late 1960s. A general downward trend in PCB
406
levels was then visible up to the surface of the sediment deposits. For MAR16-02, two
407
concentration peaks were observed despite the downward trend, the first around 1976 (PCB =
408
0.68 ± 0.13 mg kg-1) and the second in 1992–1996 with an extremely high concentration that
409
reached 16.8 mg kg-1. For the most recent sediment deposits (from the 2000s onward),
410
concentrations are relatively close or equal to 0.12 ± 0.01 mg kg-1 and 0.18 ± 0.05 mg kg-1 for
411
MAR16-02 and DAM17-02, respectively.
412
The general temporal trend of PCB contents was similar to previously reported trends in
413
France (Seine River watershed: Lorgeoux et al., 2016; Rhône River watershed: Desmet et al.,
414
2012), Europe (UK: Sanders et al., 1992; Germany: Bruckmeier et al., 1997; Italy: Combi et
415
al., 2020), and the US (Christensen and Lo, 1986; Van Metre et al., 1997), and were similar to
416
temporal trends in global PCB production and consumption (Breivik et al., 2002). The
417
maxima obtained during the 1950s–1970s (~1.6 mg kg-1 for the two ponds) were higher than
418
those historically recorded in several French watersheds, such as the Loire (1.2 mg kg-1,
419
Dendievel et al., 2019), Garonne (0.145 mg kg-1, Dendievel et al., 2019) and Rhône rivers
420
watersheds (0.28 mg kg-1, Desmet et al., 2012; 0.42 mg kg-1, Mourier et al., 2014); European
421
watersheds such as the Brno Reservoir, Czech Republic (0.08 mg kg-1, Franců et al., 2010);
422
the Esthwaite Water, England (0.05 mg kg-1, Sanders et al., 1992); or the Chattahoochee River
423
watershed, US (0.38 mg kg-1, Van Metre et al., 1997). It should be noted that total PCB
424
concentrations were calculated from 7 congeners in the cited studies and up to 22 for Sanders
425
et al. (1992), compared with the 6 congeners studied herein. Nevertheless, the maximum
426
concentrations recorded in the Eure River watershed remain lower than those recorded in
427
recent flood deposits in the Rhône River (Dendievel et al., 2019), the Seine River (2.31 mg
428
kg-1, Lorgeoux et al., 2016), or the Seine estuary, France (5 mg kg-1 ; Dendievel et al., 2019),
429
the Lippe River, Germany (2.63 mg kg-1, Heim et al., 2004), or Milwaukee Harbour, US (13.4
430
mg kg-1, Christensen and Lo, 1986).
431
The detection of PCBs prior to 1955 (i.e. the year in which PCB production and
432
consumption in France began to increase; Lorgeoux et al., 2016) may be consistent with the
433
fact that PCB production in France began approximately in the 1930s (de Voogt and
434
Brinkman, 1989). However, the maximum consumption recorded in France in 1975 does not
435
correspond to the maximum concentrations in sediments recorded a few years earlier. The
436
year 1975 also corresponds to the first bans on the use of PCBs in open systems (e.g.
437
plasticizers, carbonless copy paper, lubricants, inks, laminating and impregnating agents,
438
paints, adhesives, waxes, cement and plaster additives, casting and dedusting agents, sealing
439
liquids, fire retardants, immersion oils, and pesticides (de Voogt and Brinkman, 1989; Bigus
440
et al., 2014)), which may explain why it was after this date that the levels started to show a
441
substantial decrease, especially in Martot Pond. Additionally, PCB concentrations began to
442
stabilise to low levels in the early 1990s (with the exception of the 1992–1996 period in
443
Martot Pond), which can be linked to the cessation of PCB production in France in 1984 (de
444
Voogt and Brinkman, 1989) coupled with the ban on PCB use in France in 1987, including in
445
closed-system applications (e.g. cooling liquids in transformers, dielectric liquids in large and
446
small capacitors, heat-conducting fluids in heat-exchangers and fire- or heat-resistant
447
corrosion-free hydraulic fluids in mining equipment and vacuum pumps (de Voogt and
448
Brinkman, 1989; Kannan et al., 1992; Bigus et al., 2014)). In addition, some PCB
449
concentrations recorded during the 1950s–1960s exceeded the probable effect concentrations
450
(PECs; equal to 0.676 mg kg-1 for total PCBs) defined by MacDonald et al. (2000), as the
451
level above which effects on benthic biota are likely to be observed, demonstrating the
452
potential toxicity of the accumulated sediments, especially in case of remobilization.
453
Thus, the temporal reconstruction of PCB levels demonstrated a significant PCB
454
contamination within the Eure River watershed, but only an analysis of the distribution of the
455
congeners can allow for the determination of the contaminant sources.
456 457
3.4.2. Distribution of PCB congeners
458
Congener distributions were recorded for the MAR16-02 and DAM17-02 cores (Fig. 6). For
459
the Eure Unit of MAR16-02 core, PCB180 was, on average, predominantly represented
460
(23.1%), followed by PCB138 (22.1%), PCB153 (20.2%), PCB101 (15.0%), PCB52 (11.3%),
461
and PCB28 (8.2%). Therefore, 6-chlorine PCBs (PCB138 + PCB153) were predominantly
462
represented (42.3%). For DAM17-02, PCB138 represented on average 42.8% of the ∑PCBs,
463
which combined with PCB153 (8.1%) amounted to a 50.9% representation of 6-Chlorine
464
PCBs, whereas PCB101 represented on average 20.7%, followed by PCB180 (18.8%),
465
PCB52 (5.9%), and PCB28 (3.7%). PCB28, the globally least represented congener, was
466
detected beginning in the early 1950s, and its contribution has generally followed the trends
467
shown by PCB concentrations. However, during the peak of PCB levels in the late 1950s for
468
MAR16-02 and the 1960s for DAM17-02, PCB28 was the most represented congener (25.4%
469
and 26.5% respectively). From the late 1970s onwards, PCB28 represented less than 10% of
470
∑PCBs for MAR16-02, whereas it was almost no longer detected in DAM17-02. PCB52, the
471
second least represented congener, was detected from the beginning of the sediment records
472
and, similar to PCB28, followed the overall global PCB trends. However, PCB52 was the
473
second most represented congener during the 1950s peak concentration (21.7%) for
MAR16-474
02 and the third (21.9%) during the 1960s peak for DAM17-02. The contribution of this
475
isomer decreased overall afterwards (< 10%). PCB101 and PCB153 followed similar trends
476
for MAR16-02, with a strong representation at the Eure/Seine unit transition (>30%) and then
477
decreased as the PCB concentration increased. Following the peak PCB concentration, the
478
contribution of PCB101 decreased, although its contribution was approximately 20%,
479
whereas the contribution of PCB153 also stabilised at approximately 20%. PCB138 also
480
showed strong contributions from the Eure/Seine unit transition of the MAR16-02 core, which
481
also decreased as the PCB concentration increased. Afterwards, the contribution of PCB138
482
increased overall towards the surface as the PCB concentrations decreased. The distribution of
483
PCB101 was also important at the beginning of the DAM17-02 core (>40%). For the
484
MAR16-02 core, this congener decreased as PCB concentrations increased. In contrast to
485
MAR16-02, the contribution of PCB153 was low for DAM17-02 and showed an increasing
486
trend until the early 1980s (~17%). The contribution of PCB138 showed a broadly similar
487
behaviour to that of PCB153 and reached nearly 70% at the end of the 1980s. Finally,
488
PCB180 was only detected from the mid-1950s for MAR16-02 but its contribution increased
489
over time and was very significant from the late 1990s onwards. Conversely, PCB180 showed
490
a strong contribution at the beginning of the DAM17-02 record, which decreased with
491
increasing PCB concentration.
492
Releases of PCBs to the environment can result from inputs to watercourses through leakage
493
from facilities or discharges from landfills, as well as leaching from industrial or urban
494
surfaces, but also from atmospheric deposition, in which case PCBs are mostly transported in
495
particulate form (Zhou et al., 2001; Yang et al., 2012). More generally, industrial activities
496
and urbanization are the primary causes of sediment PCB pollution (Bigus et al., 2014).
497
France was one of the first countries to produce PCBs and is estimated to have contributed
498
approximately 10% of the global production from 1930 to 1984 (i.e. 134,654 t of the 1.5 Mt
499
produced globally) (de Voogt and Brinkman, 1989; Breivik et al., 2002). PCBs in France
500
were produced under the names "Phenoclor" and "Pyralene". Moreover, it can be assumed
501
that the "PCB technical mixture" used in France prior to 1987 was predominantly produced in
502
France, regardless of its form and use.
503
Comparing PCB isomers (and thus comparing PCBs according to their chlorination degree)
504
can be useful to identify the sources responsible for PCB releases to the environment and to
505
assess changes in their use within a given watershed (Franců et al., 2010; Cai et al., 2016).
506
Ratios of PCB28/PCB153 and PCB(28+53)/PCB(138+153+180) congeners were found to be
507
below 1 for most of the MAR16-02 (mean = 0.43 and 0.36, respectively) and DAM17-02
508
(mean = 0.61 and 0.17, respectively) cores (Fig. 7), confirming a dominance of "high
509
chlorinated congeners" that are generally present in the composition of hydraulic fluids or
510
thermostable lubricants, whereas "lower chlorinated mixtures" are used for less viscous
511
applications (Franců et al., 2010). However, these ratios were greater than 1 during the
high-512
concentration instances recorded in the late 1950s (Martot Pond) and 1960s (Les Damps
513
Pond), confirming the dominance of "low chlorinated congeners" during these periods (Fig.
514
7). This could be explained by a contribution from at least two distinct sources during certain
515
periods of high PCB use. If the production and use of formulations containing highly
516
chlorinated PCBs were staggered over the period spanning from the 1930s to the late 1980s,
517
the temporary dominance of low chlorinated congeners (tri-Cl and tetra-Cl) may indicate the
518
use and subsequent release of specific technical PCB mixtures, such as DP-3 or DP-4 (i.e. two
519
types of Phenoclor mixtures). These technical mixtures are equivalent to the Aroclor 1016 and
520
1242 mixtures (Kannan et al., 1992; Breivik et al., 2002), which are mainly composed PCBs
521
containing 2–5 chlorines (Frame, 1997; Breivik et al., 2002). These observations are
522
consistent with the reports of Franců et al. (2010) (Brno Reservoir, Czech Republic), whereby
523
the temporary dominance of lower chlorinated congeners corresponded to (accidental) input
524
from a former transformer and capacitor manufacturing plant that used a low chlorinated
525
technical PCB mixture called Delor 103 (equivalent to Aroclor 1242, which is produced in the
526
US). As previously reported by Cai et al. (2016) and Yang et al. (2012), the predominance of
527
heavy congeners could correspond to atmospheric inputs over long distances. However, this
528
occurred in countries that were not direct producers of PCBs at the time of deposition. Other
529
authors indicate that the presence of lighter PCBs is more suggestive of substantial
530
atmospheric contribution, given that these congeners are more susceptible to long-range
531
transport as they are less prone to photodegradation than highly chlorinated PCBs. Therefore,
532
the predominance of heavier PCBs seems to suggest a larger contribution of emissions from
533
local sources (Alegria et al., 2016). Halfadji et al. (2019) noted that sites contaminated with
534
highly chlorinated PCBs were near petrochemical industrial zones, which is also the case for
535
Martot Pond.
536
It should be noted that during the pollution peak recorded in Martot Pond during the 1992–
537
1996 period, the previously calculated ratios remained below 1, demonstrating the occurrence
538
of a pollution source that was distinct from that responsible for the heavy contamination a few
539
decades earlier. Given that the studied area was not impacted by major leaks associated with
540
the degradation of electrical installations, this sudden increase in contamination level could be
541
attributed to a very localised wild discharge. Notably, Les Damps Pond (located upstream) did
542
not show this intense pollution peak and the pollution date occurred very shortly after the ban
543
on the use of PCBs in France. Unfortunately, some industrial discharges continued even after
544
1987, as was the case in the Rhone River watershed, where high PCB concentrations were
545
recorded several years after cessation of their use (Desmet et al., 2012).
546 547 4. Conclusions 548 549
Journal Pre-proof
This study demonstrated that PAHs, particularly heavy PAHs, had a high affinity for
550
refractory Corg, whereas PCBs showed a lower affinity. The Eure River watershed has been
551
subject to significant POP contaminations since the 1940s, corresponding to the same order of
552
magnitude as that recorded in other French or European watersheds. The abundance of
553
different PAH isomers and their diagnostic ratios demonstrated that the high concentrations of
554
PAHs recorded during the 1940s–1960s were of pyrogenic origin (i.e. derived from
555
combustion processes), whereas certain signatures recorded in more recent deposits (up to the
556
1990s) exhibited an evolution towards a petrogenic origin. Furthermore, PCB temporal trends,
557
particularly their high concentrations during the 1950s–1970s, are generally linked to the
558
production, consumption, and bans on the use of PCBs in France. The distribution of PCB
559
congeners and certain congener ratios demonstrated that the high releases during the 1950s–
560
1970s were likely linked to the release of "technical mixtures PCBs" composed of "low
561
chlorinated congeners" into the river, whereas the most recent inputs were mainly attributed to
562
atmospheric inputs of "high chlorinated congeners", with the exception of a local high
563
undefined contamination recorded in Martot Pond.
564 565
Acknowledgements
566
This work is part of the OSS 276 project, financially supported by the Seine-Normandie
567
Water Agency (France). This work is support by the CNRS toward EC2CO grant
(Avant-568
Seine project). Gardes Th. grant was funded by the Region Normandie, which supports the
569
scientific consortium SCALE UMR CNRS 3730. CNRS also supports the French national
570
cyber-Repository (https://www.cybercarotheque.fr/) which is a portal for metadata associated
571
with marine, lake/river sediment cores stored in French laboratories. This project was initiated
572
by CLIMCOR project (http://climcor-equipex.dt.insu.cnrs.fr/).
573
Our paper is a contribution to ROZA-LTER-fr project : Retro-Observatory of sedimentary
574
Archive from French LTER (http://ccwbvps18.in2p3.fr/maps/visualiseur-coyoxhup#project)
575
which is a portal for data associated with marine, lake sediment cores stored in LTER French
576 laboratories. 577 578 References 579 580
Ab Razak, I.A., Li, A., Christensen, E.R., 1996. Association of PAHs, PCBs, 137Cs, and 210Pb with
581
clay, silt, and organic carbon in sediments. Water Science and Technology, Water Quality
582
International ’96 Part 4 34, 29–35. https://doi.org/10.1016/S0273-1223(96)00719-6
583
Abarnou, A., Avoine, J., Dupont, J.P., Lafite, R., Simon, S., 1987. Role of suspended sediments on the
584
distribution of PCB in the Seine Estuary (France). Continental Shelf Research, Dynamics of
585
Turbid Coastal Environments 7, 1345–1350. https://doi.org/10.1016/0278-4343(87)90038-0
586
Ahad, J.M.E., Jautzy, J.J., Cumming, B.F., Das, B., Laird, K.R., Sanei, H., 2015. Sources of
587
polycyclic aromatic hydrocarbons (PAHs) to northwestern Saskatchewan lakes east of the
588
Athabasca oil sands. Organic Geochemistry 80, 35–45.
589
https://doi.org/10.1016/j.orggeochem.2015.01.001
590
Alegria, H., Martinez-Colon, M., Birgul, A., Brooks, G., Hanson, L., Kurt-Karakus, P., 2016.
591
Historical sediment record and levels of PCBs in sediments and mangroves of Jobos Bay,
592
Puerto Rico. Science of The Total Environment 573, 1003–1009.
593
https://doi.org/10.1016/j.scitotenv.2016.08.165
594
Bertrand, O., Mondamert, L., Grosbois, C., Dhivert, E., Bourrain, X., Labanowski, J., Desmet, M.,
595
2015. Storage and source of polycyclic aromatic hydrocarbons in sediments downstream of a
596
major coal district in France. Environmental Pollution 207, 329–340.
597
https://doi.org/10.1016/j.envpol.2015.09.028
598
Bigus, P., Tobiszewski, M., Namieśnik, J., 2014. Historical records of organic pollutants in sediment
599
cores. Marine Pollution Bulletin 78, 26–42. https://doi.org/10.1016/j.marpolbul.2013.11.008
600
Blanchard, M., Teil, M.-J., Guigon-Moreau, E., Larcher-Tiphagne, K., Ollivon, D., Garban, B.,
601
Chevreuil, M., 2007. Persistent toxic substance inputs to the river Seine basin (France) via
602
atmospheric deposition and urban sludge application. The Science of the Total Environment
603
375.
604
Breivik, K., Sweetman, A., Pacyna, J.M., Jones, K.C., 2002. Towards a global historical emission
605
inventory for selected PCB congeners — a mass balance approach: 1. Global production and
606
consumption. Science of The Total Environment 290, 181–198.
607
https://doi.org/10.1016/S0048-9697(01)01075-0
608
Bruckmeier, B.F.A., Jüttner, I., Schramm, K.-W., Winkler, R., Steinberg, C.E.W., Kettrup, A., 1997.
609
PCBs and PCDD/Fs in lake sediments of Großer Arbersee, Bavarian Forest, South Germany.
610
Environmental Pollution 95, 19–25. https://doi.org/10.1016/S0269-7491(96)00118-2
611
Budzinski, H., Jones, I., Bellocq, J., Piérard, C., Garrigues, P., 1997. Evaluation of sediment
612
contamination by polycyclic aromatic hydrocarbons in the Gironde estuary. Marine
613
Chemistry, 4th International Symposium on the Biogeochemistry of Model Estuaries 58, 85–
614
97. https://doi.org/10.1016/S0304-4203(97)00028-5
615
Burgess, R.M., Ryba, S.A., Cantwell, M.G., Gundersen, J.L., 2001. Exploratory Analysis of the
616
Effects of Particulate Characteristics on the Variation in Partitioning of Nonpolar Organic
617
Contaminants to Marine Sediments. Water Research 35, 4390–4404.
618
https://doi.org/10.1016/S0043-1354(01)00179-8
619
Cai, Y., Wang, X., Wu, Y., Li, Y., Ya, M., 2016. Over 100-year sedimentary record of polycyclic
620
aromatic hydrocarbons (PAHs) and organochlorine compounds (OCs) in the continental shelf
621
of the East China Sea. Environmental Pollution 219, 774–784.
622
https://doi.org/10.1016/j.envpol.2016.07.053
623
Callender, E., 2000. Geochemical effects of rapid sedimentation in aquatic systems: minimal
624
diagenesis and the preservation of historical metal signatures. Journal of Paleolimnology 23,
625
243–260. https://doi.org/10.1023/A:1008114630756
626
Carrie, J., Sanei, H., Stern, G., 2012. Standardisation of Rock–Eval pyrolysis for the analysis of recent
627
sediments and soils. Organic Geochemistry 46, 38–53.
628
https://doi.org/10.1016/j.orggeochem.2012.01.011
629
Chevreuil, M., Blanchard, M., Teil, M.J., Chesterikoff, A., 1998. Polychlorobiphenyl behaviour in the
630
water/sediment system of the Seine river, France. Water Research 32, 1204–1212.
631
https://doi.org/10.1016/S0043-1354(97)00328-X
632
Chevreuil, M., Chesterikoff, A., Létolle, R., Granier, L., 1989. Atmospheric pollution and fallout by
633
PCBS and organochlorine pesticides (Ile-De-France). Water Air Soil Pollut 43, 73–83.
634
https://doi.org/10.1007/BF00175584
635
Chevreuil, M., Granier, L., 1991. Seasonal cycle of polychlorinated biphenyls in the waters of the
636
catchment basin of the river seine (France). Water Air Soil Pollut 59, 217–229.
637
https://doi.org/10.1007/BF00211831
638
Chevreuil, M., Granier, L., Chesterikoff, A., Létolle, R., 1990. Polychlorinated biphenyls partitioning
639
in waters from river, filtration plant and wastewater plant: the case for paris (france). Water
640
Research 24, 1325–1333. https://doi.org/10.1016/0043-1354(90)90149-Z
641
Christensen, E.R., Lo, C.-K., 1986. Polychlorinated biphenyls in dated sediments of Milwaukee
642
Harbour, Wisconsin, USA. Environmental Pollution Series B, Chemical and Physical 12, 217–
643
232. https://doi.org/10.1016/0143-148X(86)90011-X
644
Combi, T., Pintado-Herrera, M.G., Lara-Martín, P.A., Lopes-Rocha, M., Miserocchi, S., Langone, L.,
645
Guerra, R., 2020. Historical sedimentary deposition and flux of PAHs, PCBs and DDTs in
646
sediment cores from the western Adriatic Sea. Chemosphere 241, 125029.
647
https://doi.org/10.1016/j.chemosphere.2019.125029
648
Copard, Y., Di‐Giovanni, C., Martaud, T., Albéric, P., Olivier, J.-E., 2006. Using Rock-Eval 6
649
pyrolysis for tracking fossil organic carbon in modern environments: implications for the roles
650
of erosion and weathering. Earth Surface Processes and Landforms 31, 135–153.
651
https://doi.org/10.1002/esp.1319
652
de Voogt, P., Brinkman, U., 1989. Production, properties and usage of polychlorinated biphenyls, in:
653
Halogenated Biphenyls, Terphenyls, Naphtalenes, Dibenzodioxins and Related Products.
654
Topics in Environmental Health. pp. 3–45.
655
Décret n°87-59, 1987. Décret n°87-59 du 2 février 1987 relatif à la mise sur le marché, à l’utilisation
656
et à l’élimination des polychlorobiphényles et polychloroterphényles, 87-59.
657
Dendievel, A.-M., Mourier, B., Coynel, A., Evrard, O., Labadie, P., Ayrault, S., Debret, M., Koltalo,
658
F., Copard, Y., Faivre, Q., Gardes, T., Vauclin, S., Budzinski, H., Grosbois, C., Winiarski, T.,
659
Desmet, M., 2019. Spatio-temporal assessment of the PCB sediment contamination in the four
660
main French River Basins (1945–2018). Earth System Science Data Discussions 1–23.
661
https://doi.org/10.5194/essd-2019-167
662
Desmet, M., Mourier, B., Mahler, B.J., Van Metre, P.C., Roux, G., Persat, H., Lefèvre, I., Peretti, A.,
663
Chapron, E., Simonneau, A., Miège, C., Babut, M., 2012. Spatial and temporal trends in PCBs
664
in sediment along the lower Rhône River, France. Science of The Total Environment 433,
665
189–197. https://doi.org/10.1016/j.scitotenv.2012.06.044
666
Ding, S., Xu, Y., Wang, Y., Zhang, X., Zhao, L., Ruan, J., Wu, W., 2014. Spatial and Temporal
667
Variability of Polycyclic Aromatic Hydrocarbons in Sediments from Yellow River-Dominated
668
Margin [WWW Document]. The Scientific World Journal.
669
https://doi.org/10.1155/2014/654183
670
Douglas, G.S., Bence, A.E., Prince, R.C., McMillen, S.J., Butler, E.L., 1996. Environmental Stability
671
of Selected Petroleum Hydrocarbon Source and Weathering Ratios. Environ. Sci. Technol. 30,
672
2332–2339. https://doi.org/10.1021/es950751e
673