HAL Id: hal-01086746
https://hal-enpc.archives-ouvertes.fr/hal-01086746
Submitted on 24 Nov 2014
HAL is a multi-disciplinary open access
archive for the deposit and dissemination of
sci-entific research documents, whether they are
pub-lished or not. The documents may come from
teaching and research institutions in France or
abroad, or from public or private research centers.
L’archive ouverte pluridisciplinaire HAL, est
destinée au dépôt et à la diffusion de documents
scientifiques de niveau recherche, publiés ou non,
émanant des établissements d’enseignement et de
recherche français ou étrangers, des laboratoires
publics ou privés.
Distributed under a Creative Commons Attribution| 4.0 International License
Seine River basin (1994–2003) for Cd, Cr, Cu, Hg, Ni,
Pb and Zn
Daniel Thevenot, Régis Moilleron, Laurence Lestel, Marie-Christine Gromaire,
Vincent Rocher, Philippe Cambier, Philippe Bonté, Jean-Louis Colin, Claire
de Pontevès, Michel Meybeck
To cite this version:
Daniel Thevenot, Régis Moilleron, Laurence Lestel, Marie-Christine Gromaire, Vincent Rocher, et
al.. Critical budget of metal sources and pathways in the Seine River basin (1994–2003) for Cd, Cr,
Cu, Hg, Ni, Pb and Zn. Science of the Total Environment, Elsevier, 2007, 375 (1-3), pp.180 - 203.
�10.1016/j.scitotenv.2006.12.008�. �hal-01086746�
Critical budget of metal sources and pathways in the Seine River
basin (1994
–2003) for Cd, Cr, Cu, Hg, Ni, Pb and Zn
Daniel R. Thévenot
a,⁎
, Régis Moilleron
a, Laurence Lestel
b, Marie-Christine Gromaire
c,
Vincent Rocher
d, Philippe Cambier
e, Philippe Bonté
f, Jean-Louis Colin
g,
Claire de Pontevès
h, Michel Meybeck
haCentre d'Enseignement et de Recherche sur l'Eau, la Ville et l'Environnement (Cereve), UMR-MA 102, Université Paris 12 Val de Marne,
Faculté de Sciences et Technologie, 61 Avenue du Général de Gaulle, 94010 Créteil Cedex, France
bCentre d'Histoire des Techniques et de l'Environnement, CNAM, 5 rue du Vertbois, 75003 Paris, France
cCentre d'Enseignement et de Recherche sur l'Eau, la Ville et l'Environnement (Cereve), UMR-MA 102, ENPC, 6-8 Avenue Blaise Pascal,
Champs sur Marne, 77455 Marne-La-Vallée Cedex 2, France
dSyndicat Interdépartemental pour l'Assainissement de l'Agglomération Parisienne (SIAAP), Direction de la Recherche et du Développement,
82 avenue Kléber, 92700 Colombes, France
e
Unité de Science du Sol, INRA, RD10, 78026 Versailles Cedex, France
f
Laboratoire des Sciences du Climat et de l'Environnement (LSCE), UMR CEA–CNRS 1572, 91198 Gif sur Yvette Cedex, France
g
Laboratoire Interuniversitaire des Systèmes atmosphériques (LISA), Université Paris 12 Val-de-Marne, 61 avenue du Général de Gaulle, 94010 Créteil Cedex, France
h
UMR Sisyphe 7619, Université P. et M. Curie, boite 105, 4 place Jussieu, 75006 Paris, France Available online 30 January 2007
Abstract
River basin metal pollution originates from heavy industries (plating, automobile) and from urban sources (Paris conurbation: 2740 km2, 9.47 million inhabitants). The natural sources of metal have been found to be limited due to sedimentary nature of this catchment and to the very low river sediment transport (10 t km− 2y− 1). Several types of data have been collected to build the metal budget within the whole Seine River basin: field surveys, economical statistics and environmental models. Environmental contamination and related fluxes have been measured on atmospheric fallout, rural streams particles, and Seine River particles upstream and downstream of Paris and at river mouth. Metal pathways and budgets have been set up for (i) a typical cultivated area, (ii) a Paris combined sewer system, (iii) Paris conurbation and (iv) the whole catchment metal retention effect in floodplain and dredged material. Metal fluxes to the estuary have been decomposed into natural, urban domestic and other sources. The latter are within 1–2 orders of magnitude larger than waste water fluxes directly released into rivers according to an industrial census. These fluxes have been further compared to the annual use (1994–2003) of these metals. Metal excess fluxes exported by the river are now a marginal leak of metal inputs to the catchment (i.e.“raw” metals, metals in goods, atmospheric fallout), generally from 0.2 to 5‰. However, due to the very limited dilution power in this basin, the contamination of particles is still relatively high. The Seine River basin is gradually storing metals, mostly in manufactured products used in construction, but also in various waste dumps, industrial soils, agricultural and flood plain soils.
© 2007 Elsevier B.V. All rights reserved.
Keywords: Heavy metals; Budget; Seine; River; Cd; Cr; Cu; Hg; Ni; Pb; Zn
⁎ Corresponding author. Tel.: +33 1 45 17 16 25; fax: +33 1 45 17 16 27. E-mail address:thevenot@univ-paris12.fr(D.R. Thévenot).
0048-9697/$ - see front matter © 2007 Elsevier B.V. All rights reserved. doi:10.1016/j.scitotenv.2006.12.008
1. Introduction
Heavy metals in pristine river catchments originates from natural sources and processes as chemical weath-ering, soil erosion, fallout of natural aerosols from marine, volcanic or arid soils sources (Avila et al., 1998; Gaillardet et al., 2003). In impacted river catchments additional metal sources are multiple and metal contamination follows complex routes (Salomons and Forstner, 1984; Salomons et al., 1995). Metal contamination of the atmosphere by cities, smelters and industries spread pollutants from the local scale (Rühling, 2002) to the global scale (Nriagu and Pacyna, 1988). Soils can become progressively contami-nated by these inputs and by the use of some Cd-rich phosphate fertilisers or by the reuse of treated urban sew-age sludge on cropland (Mortvedt, 1996; Nicholson et al., 2003; Senesi et al., 1999; Soler Soler and Soler Rovira, 1996). Urban contamination has also multiple sources as road runoff (Xanthopoulos and Hahn, 1993; Sansalone and Buchberger, 1997; Legret and Pagotto, 1999), roof runoff (Good, 1993; Förster, 1996) which result in high metal loads in urban storm water (Malmqvist, 1983; Makepeace et al., 1995; Boller, 1997). Domestic and industrial sources of metals are multiple and urban sewers, which generally collects industrial waste waters, is a major metal contamination source in densely populated area (Stigliani et al., 1993; Stigliani and Jaffé, 1993; Bergbäck et al., 2001; Sörme and Lagerkvist, 2002).
Few metal budgets are available on river catchments as for the Rhine River (Stigliani et al., 1993; Stigliani and Jaffé, 1993), at the city scale as for Stockholm (Bergbäck et al., 2001; Sörme and Lagerkvist, 2002), in soils (Spiegel et al., 2003) and agrosystems (Moolenar and Lexmond, 1998) and on the generic anthroposphere in which metals are one type of material among others e.g. C, N or P (Baccini and Brunner, 1991; Brunner and Rechberger, 2003). Such budgets combine multiple types of data from environmental monitoring and economical statistics and from specific process studies conducted in atmosphere, soils, aquatic and artificial environments (sewers, impervious urban areas etc.).
The Seine River basin is exposed to most human pressures, excepted mining and smelting (Meybeck et al., 1998). As a result, the river is characterised by some of the highest nutrient contents (Billen et al., 2007-this volume) and by extreme metal contents in suspended or deposited particulates (Thévenot et al., 1998; Horowitz et al., 1999; Grosbois et al., 2006). The PIREN-Seine programme has been studying the patterns and trends of metal (de)contaminations since the early 1990s from the very local scale to the whole catchment, through multiple media from atmospheric fallout to dredged sediment.
This information is collected and synthesised here through a budgeting approach at various scales. In a companion paper (Meybeck et al., 2007-this volume), we are presenting the long-term evolution of metal contam-ination for more than fifty years through the Driver-Pressure-State-Impact-Response (DPSIR) scheme.
Average heavy metal budgets are presented here for a 10 year period (1994–2003) at four scales: (i) typical agricultural soil, studied at the plot scale (0.01 km2) (Azimi et al., 2003; Azimi, 2004), (ii) representative and experimental combined Paris sewer catchment receiving mostly domestic wastes (0.42 km2), (iii) the Paris conurbation area (2740 km2, 9.47 million inhabitants) and (iv) the Seine River catchment upstream the estuary (64,700 km2; 14 million inhabitants).
Three main questions are addressed in this paper from a river perspective:
1. Is it possible to build up the metal budget over the River Seine catchment using data from quite different origin and quality, many of them not having received thorough quality control?
2. How comparable are the excess metal fluxes resulting from the budget and those available from emission census?
3. How important are the metal leaks from human ac-tivities, compared to the overall circulation of metal? 2. The Seine River catchment and its conceptual budget
The Seine River catchment is characterized by a very high population density (average 215 people km− 2) essentially aggregated in Paris conurbation (2740 km2, 9.47 million inhabitants) which extends over the Upper Seine–Marne and Middle-Seine–Oise confluences (Fig. 1). This conurbation (415 municipalities) is further mentioned in this paper as Paris megacity: it comprises not only Paris city, named Paris intra muros (2.15 mil-lion inhabitants, 105 km2) and its adjacent municipa-lities, but also all cities in close connection to the former ones (building distance smaller than 200 m). It differs also from the 8 counties constituting the Ile-de-France region (11 million inhabitants, 12,100 km2).
The Seine basin (upstream of Poses) currently ac-counts for 25% of French agriculture production, 25 to 30% of French industrial activity and 23% of French population, for less than 10% of its total water flow and sediment transport. About 80% of waste water produced by Paris megacity population is collected into a single waste water treatment plant (Seine-Aval WWTP) that releases treated water few kilometres upstream of the
Middle Seine–Oise confluence (Fig. 1). Three large reservoirs, the Seine, Aube and Marne ones, receive seasonally bypassed waters from these rivers (Fig. 1); their overall sediment retention capacity is actually limited (Garnier et al., 1999).
Our conceptual model of the metal budget for the whole catchment is presented onFig. 2. It differentiates three types of data, from economical statistics and census (Ei), to measured fluxes at stations (Si) and calculated data (Ci):
○ Data from economical statistics (Ei): they concern mostly metal demand and material flow (E1: material flow inputs/outputs to cities and industries; E2: material flow inputs in animal food (E2a) and fertilisers (E2b); E3, E4: material flows within the anthroposphere, i.e. through urban, industrial and agricultural activities, including metal recycling, atmospheric emission (E5, E6: urban and industrial atmospheric emissions) and agricultural production (E14: crop export from cropland);
○ Field data at sites (Si) generated by the PIREN–Seine and partner research teams include atmospheric
fallout (S10, S11, S12: atmospheric fallout on forest and grass land, cultivated area and urbanised land), analysis of rivers and streams particulates (S17, S18: control stream stations in head waters; S19, S20: control river stations upstream/downstream Paris megacity; S21: net riverine export at river mouth), sewer and combined waste water (S22: sewage outputs from Paris megacity (dry weather, storm overflow); S26: anthropogenic leaks resulting from industrial waste waters inputs to the river (S26a) or to the domestic sewer system (S26b));
○ Calculated data (Ci) resulting from the combination of previous data, e.g. atmospheric transport (C7: aeolian erosion of cultivated soils; C8, C9: inputs/outputs of long range atmospheric contaminants), agricultural use of treated urban sewage sludge (C13), natural export of metal from soil erosion (C15), anthropogenic excess flux of metal in streams resulting from temporal storage in the soil (C16), or in the urban (C17) and industrial (C18) waste discharges.
Several long-term storage components are concep-tualised here, but not yet quantified: soils (storage A),
Fig. 1. Map of Seine River basin, limited by the river mouth at Poses and its 3 main reservoirs on (M) Marne, (A) Aube and (S) Seine rivers, and detailed map of Paris megacity, including Seine-Aval waste water treatment plant (S-A WWTP) and Paris intra muros (dark zone). Core samples were collected at (B) Bouafles, upstream Poses as well as in these 3 reservoirs. Atmospheric deposits were collected at (C) Chatou, (V) Versailles, Paris centre, (Cr) Créteil, (T) Thiais, (Co) Coulommiers, (F) Fontainebleau forest, (Mo) Morvan National park and (Vo) Vouzon forest.
urban and industrial structures (storage B) and waste dumps, polluted industrial soils (storage C). Other storage components (C23, C24) correspond to sediment retention in river reservoirs and floodplains, and to river sediment dredging for navigation and disposal (C25). All other components are tentatively quantified here.
In order to build up these budgets we have combined three types of data sources resulting from the PIREN– Seine studies, various types of censuses, and regular environmental surveys: (i) metal flux measurements were realized at atmospheric fallout stations (Azimi et al., 2003, 2005; Azimi, 2004; Garnaud et al., 1999), at various river stations on dissolved metals ( Elbaz-Poulichet et al., 2006), and particulate metals (Cossa et al., 1994; Horowitz et al., 1999; Meybeck et al., 2004; Grosbois et al., 2006), on Paris sewage waters ( Tusseau-Vuillemin et al., 2007-this volume) and sludge ( Mey-beck et al., 2007-this volume), river dredged material (Carpentier et al., 2002a,b); (ii) experimental field studies on several plots located at the Versailles agronomic station (Azimi et al., 2004), and on the
Marais urban catchment (0.42 km2) located in the
historical centre of Paris city (Chebbo et al., 2001; Chebbo and Gromaire, 2004): in this catchment multiple studies concerning roof runoff, street runoff and domestic sewage composition were realised (Gromaire et al., 2000, 2002; Kafi-Benyahia et al., 2005; Moilleron et al., 2005); (iii) material flows and census statistics: many of them are only available at the national level and have been downscaled for the Seine River catchment and/or Paris conurbation as the metal inputs (DGDDI, 2000), the metal uses (FEDEM, 2003), the fertiliser use
(Unifa, 2005), the metal contents in domestic solid
wastes (ADEME/INSAVALOR POLDEN, 1998); the
census of industrial waste water inputs to the Seine catchment is presently under revision using direct outlet monitoring realized at the county (département) scale (AESN, 2006).
3. Natural and anthropogenic atmospheric emissions and fallout
3.1. Atmospheric emissions for the catchment area Atmospheric emissions of heavy metals (E5 and E6, Fig. 2) have been estimated here using a national data set assembled by CITEPA which acts as the National Ref-erence Centre on Air Emissions for France (CITEPA, 2004). Total atmospheric emission of heavy metals in the Seine river basin has been estimated using data aggregated at the county level (Table 1). For the counties which are only partly included in the Seine River basin, values were prorated to population.
Emissions of heavy metals are produced mainly by the manufacturing industry and by energy transforma-tion (household waste incineratransforma-tion with energy recovery and combustion of coal and heavy fuel which contain traces of these elements). The amount of heavy metal generated by the combustion of fossil fuel is lower in France than in other European countries, since 79% electricity is produced by nuclear power and 15% by hydropower plants (INSEE, 2002). The estimated atmo-spheric metal emissions represent only 6 to 16% of the French ones, depending on the metal considered,
Fig. 2. Conceptual model of long-term metal fluxes and flows in the Seine river basin and data typology: (- - -) material flows; (_) environmental fluxes. E: data from economic statistics; S: environmental monitoring at key stations; C: estimated from combined information or models.
whereas the Seine River Basin welcomes about 30% of the French manufactures (INSEE, 2002). This discre-pancy could be related to the spatial distribution of industries, the Ile-de-France welcoming more industries from the tertiary sector which is less emitting. It could also result from better emissions treatment within industries located close to Paris.
3.2. Atmospheric fallout on catchment
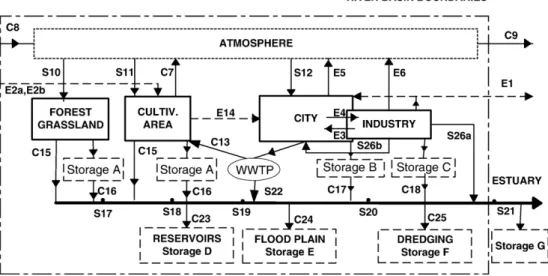
Two complementary experimental approaches have been used for assessing metal atmospheric fallout over the Seine River basin. (1) Total atmospheric deposits have been directly sampled at S10, S11 and S12 sites (Fig. 2) using validated protocols for collecting dry and wet deposits (Azimi et al., 2003). This direct fallout sampling was performed on 2 rural sites in the Morvan National Park and in Lamotte-Beuvron forest, at Vouzon station (47°39′N, 02°06′E) (S10 and S11) and on 3 to 6 suburban or urban stations (Versailles, Fontainebleau, Coulommiers, Chatou, Thiais, Paris centre and Créteil) (S12) (location of stations on Figs. 1 and 3). (2) Ter-restrial mosses were also considered to study atmo-spheric metal contamination. Mosses are known to be specific indicators of atmospheric wet and dry deposi-tion (Zechmeister et al., 2003; Onianwa, 2001). Such biomonitoring was studied (Gombert et al., 2004, 2005) as the French part of the 2000 European Moss Survey called “Atmospheric heavy metal deposition based on moss analysis” (Rühling, 2002) (Fig. 3A). The sampling points grid of was 30 × 30 km.
Statistical treatment of moss metal content allowed determination of 4 classes of contamination levels and the assessment of the areas of these 4 zones (Fig. 3B)
using a multi metal contamination index IPM (De
Pontevès et al., 2005) IPM¼X 7 1 1 7 ðMeÞ=ðAlÞstation ðMeÞ=ðAlÞreference
where ratios of moss metal levels, normalised to Al content, are compared at the collecting station and at a non polluted station, such as Vouzon. Seven trace elements are taken into account for IPM index: As, Cr, Cu, Cd, Hg, Pb and Zn.
As no direct fallout sampling site was available in the highest contaminated zone 4 (Oise valley and NE part of Seine River basin), zones 3 and 4 were merged for annual fallout assessment. Low, medium and highly contaminated zones cover 6300, 26,700 and 31,700 km2 respectively.Table 2presents the 2002 annual fallout of metals in each zone (average of annual fallout directly collected on sites of each zone) and the whole basin (area weighted).
The total fallout of metals includes four main sources: (i) local natural sources as soil dust erosion from the Seine basin, (ii) external inputs of particles derived from aeolian erosion, particularly from Sahara dust, (iii) local emissions of metals from anthropogenic sources and (iv) external inputs of metal from anthro-pogenic sources. Excess metal fallout is determined from total fallout minus sources (i) and (ii) and are compared to reported metal emissions from industrial and urban sources.
Both local and external sources of soil dust can be traced by the total aluminium fallout, commonly used as the source indicator element for Earth's crust (Taylor, 1964). The average Al fallout is 270 ± 25 kg km− 2y− 1
Table 1
Atmospheric emission in the Seine River basin upstream Poses (64,700 km2) by source category (year 2000): (1) annual atmospheric emission (t y− 1)
(CITEPA, 2004), (2) relative importance of major emission sources:‘–’ <1%; 1%≤x<10%; 10%≤xx<20%; xxx≥20% (calculated from CITEPA updated on 2005-02-17)
As Cd Cr Cu Hg Ni Pb Zn
1. Emission within basin(1)(E6) 2.4 1.5 16 29 1.6 34 35 140 Seine River basin/France ratio 0.09 0.1 0.06 0.16 0.12 0.15 0.14 0.1 2. Relative importance of emissions
Energy transformation xxx xxx x x xxx xxx xxx xxx Manufacturing industry xxx xxx xxx x xx xx xxx xxx Residential/tertiary x x x x x xx x x Agriculture/forestry – – – – – – – – Road transport – – – xxx – – x – Other transports – – – xx – – xx –
SeeFig. 2for metal flux coding.
(1)
The Seine River basin at Poses incorporates the following counties: Aisne⁎, Ardennes⁎, Aube, Côte d'Or⁎, Eure⁎, Eure-et-Loir⁎, Loiret⁎, Marne, Haute-Marne⁎, Meuse⁎, Nièvre⁎, Oise⁎, Paris, Maritime⁎, et-Marne, Yvelines, Vosges⁎, Yonne⁎, Essonne, Hauts-de-Seine, Seine-Saint-Denis, Val-de-Marne, Val d'Oise. (⁎) Counties only partly included in the Seine river basin.
based on data collected at all seven stations in 2002 (Azimi, 2004). An atmospheric fallout sampling cam-paign performed during the same period at Vouzon demonstrated that during two events (19 February and 25 June 2002) 51.1% of Al fallout was related to Sahara aerosols deposits (Leblond, 2004). It is assumed here that about 50% of the dust particles, containing aluminium, are originating from local sources with an Al content of
36,000 mg kg− 1(mean value within suspended solids at Seine River mouth) and 50% from the Sahara dust with much higher Al content (126,000 mg kg− 1). Therefore, the average dust fallout in the basin would be 81,000 mg kg− 1. Such combination leads to an estimate of a dust fallout rate reaching 3.3 t km− 2 y− 1 compared to an average exportation of suspended matter by the river to its estuary of 10.8 t km− 2y− 1(Meybeck et al., 1998), the
Table 2
Metal total atmospheric fallout (2002) and emissions (2000): (1) total atmospheric deposit within fallout zones (kg km− 2y− 1) and (2) whole catchment (64,700 km2) (t y− 1); (3) total emissions from catchment (t y− 1)
Al Cd Cr Cu Hg Ni Pb Zn
1. Fallout zones
Low metal fallout(1) 252 < 0.02 n.a. 0.58 0.0034 n.a. < 0.4 3.57
Medium metal fallout(2) 270 0.052 0.33 2.20 0.022 0.87 1.8 14
High metal fallout(3) 269 0.055 0.54 8.22 0.022 0.92 5.0 23 2. Whole catchment fallout
Whole basin fallout (S10 + S11 + S12) 17,377 3.3 26 323 0.76 52 209 1135 Soil dust fallout (C7 + C8)(4) 17,550 0.1 16 7 0.01 7 4.6 26 Excess fallout(4)(S10 + S11 + S12−C7−C8) 0 3.2 9.9 316 0.75 46 205 1109 3. Total emissions (Table 1) (E6)
n.a. 1.5 16 29 1.6 34 35 140 SeeFig. 2for metal flux coding andFig. 1for sampling location.
(1)Vouzon station;(2)Coulommiers station;(3)average of annual fallout sampled at Versailles, Chatou, Paris centre, Thiais and Créteil; (4) see text;
(n.a.) non available data.
Fig. 3. Metal atmospheric fallout assessment on the Seine River basin: (A) Spatial distribution of Pb level (mg kg− 1) in terrestrial mosses [(o) moss sampling stations within Seine River basin] (Gombert et al., 2004) and (B) multi metal (As, Cr, Cu, Cd, Hg, Pb, Zn) contamination index in mosses based onGombert et al. (2004)data [(o) stations operated by PIREN-Seine teams for direct atmospheric fallout sampling; Vouzon is located 100 km SW of the Seine Basin and used as a sub-pristine reference station].
net mechanical soil erosion rate by surface waters would be only 7.5 t km− 2y− 1.
A mixture of 50% local soil and 50% Sahara soils in the Seine dust fallout of aluminium, corresponds to an input of 217,000 t y− 1of soil dust containing 0.1 t y− 1of Cd, 16 of Cr, 7.0 of Cu, 0.015 of Hg, 6.9 of Ni, 4.6 of Pb and 26 of Zn (Table 2), assuming metals contents in such local soil to 0.4, 80, 25, 0.04, 30, 25 and 100 mg kg− 1 respectively and in Saharan dust (Avila et al., 1998) to 67.5, 39, 33, 17 and 142 mg kg− 1for Cr, Cu, Ni, Pb and Zn respectively. As Cd and Hg concentra-tions were not determined in such Saharan dust samples, we used the upper 75 percentile of their level in total suspended solids issued from world pristine streams, i.e. 0.5 and 0.1 mg kg− 1 respectively (n = 132 and 81, respectively). The selected metal levels in local soils are close to those recently published for the surface horizon of cultivated loess soils in northern France (Sterckeman et al., 2006).
Metal excess fallout rates measured in 2002 over the Seine River basin are in relatively good agreement, i.e. within an order of magnitude, with emission data collected from industries in 2000 (CITEPA, 2004) for Cd, Cr, Hg and Ni. However, for Cu, Pb and Zn, atmospheric emission data are 6 to 11 times lower than the excess fallout rates, implying an underestimation of industrial emissions (Table 1).
4. River particulate metal fluxes from natural soil erosion
The riverborne metal fluxes originating from the erosion of soil particles in the absence of human pres-sures is calculated on the basis of (i) an average river suspended particulate matter (SPM) specific load or
yield of 10.8 t km− 2y− 1(Meybeck et al., 1998) and (ii) a basin average metal content for pristine SPM (Horowitz et al., 1999; Meybeck et al., 2004).
The average contents in pristine background SPM can be determined by several approaches (Table 3): (i) the whole basin background is the combination of analyses of historical river deposits in an estuarine core (HD2, 5000 BP, Avoine et al., 1986) and in archae-ological diggings at Paris-Bercy (HD1, 3500 BP, Horowitz et al., 1999); (ii) the combination (∑L) of 7 sets of average metal contents (L1 to L7) in fine sediments present in forested streams (∅<100 μm, n = 23) draining a single rock type (Horowitz et al., 1999); ∑L is prorated to the relative outcrops of each rock type and to their relative SPM yields (Meybeck et al., 1998); (iii) at a given station background levels may also be determined for particulate sample according to the occurrence of quartz, calcite, Al and organic carbon (Meybeck et al., 2004). These approaches give very similar results that depend mostly on that Al content. The measured average Al level for the whole basin (Table 3, basin) is 33,000 mg kg− 1, close to 36,000 mg kg− 1resulting from∑L combination.
5. Metal budget in agricultural area
The overall stream output from rural areas (mean population density 20 inhabitants km− 2) can be esti-mated on the basis of fine sediments present in rural streams. Such general assessment has been completed by a direct experimental setup in order to assess metal flows and balance within agricultural soils, and to demonstrate their storage function (Fig. 2). Agricultural lands (Fig. 4) are impacted, at more or less long term, by the following inputs:
Table 3
Natural background levels in river particulates (mg kg− 1)
Al Cd Co Cr Cu Hg Ni Pb Zn L1 49,880 0.34 12 73 26 0.034 29 34 96 L2 21,000 0.2 7 29 7 0.02 24 16 72 L3 27,000 0.2 8 41 7 0.01 14 19 48 L4 20,000 0.1 5 30 6 0.05 9 14 28 L5 60,000 0.5 10 50 25 0.06 35 50 100 L6 49,880 0.34 12 73 26 0.034 29 34 96 L7 16,000 0.1 4 14 9 0.01 37 13 51 ∑L 36,535 0.26 10 52 14 0.023 27 26 76 HD1 45,500 0.35 4.5 50 12 0.02 20 24 100 HD2 – 0.34 – – 5 0.034 – 27 34 Basin 33,000 0.22 9 40 15 0.03 16 20 60
L1 to L7: averages of background level in fine sediments (< 100μm) from monolithological forested basins, (L1) argillaceous, (L2) limestone, (L3) mixed carbonated (alluvial), (L4) tertiary sands, (L5) crystalline rocks (Morvan only), (L6) marls and gypsum marls, (L7) chalk.∑L: river mouth background level combining all lithologies. Historical Deposits: (HD1) Paris–Bercy excavation (3500 BP), (HD2) Seine estuary (5000 BP,Avoine et al., 1986); (Basin) selected river mouth values (Thévenot et al., 2002).
• Metal present in livestock food supply (E2a) and in fertilisers or phyto-treatments (E2b),
• Atmospheric fallout (S11) (see Section 3),
• Use of urban sewage sludge (C13) as fertiliser (see Section 6).
For a complete budget of metals in agricultural soils, it is important to take into account the export of food and other cropped products (E14 and E1 outside the basin). The metal loss corresponding to aeolian erosion (C7) cannot be directly measured but could be estimated from Al fallout (S11), which is mainly attributed to this process (Table 2). Metal flows have been first quantified at the plot-scale, by using experimental plots located in Ile-de-France and then assessed at the Seine basin scale, taking into account the annual consumption of mineral fertilisers.
5.1. Fluxes and balances of Cd, Cu, Pb and Zn in a silt loam horizon with different cultivation systems
The studied site corresponds to experimental plots of the Institut National de Recherche Agronomique (INRA), devoted to the comparison of alternative culti-vation systems. Nevertheless, all crops are conducted following consistent and realistic sets of farming rules, under the physical and socio-economic context of Ile-de-France. Numerous data and samples were regularly collected and, for the present study, analyses of trace metal in spread fertilisers and cropped grains were performed. Total metal atmospheric fallout and metal concentration in large pore soil water were also
mea-sured during the year 2001–2002. The water drainage is calculated, using a water budget model. Erosion and run-off were considered as negligible. Further details on sites and methods, and on consistency and validation of these data are given byAzimi et al. (2004). Four annual fluxes and their balance were quantified for 3 farming systems and 2 types of crops, i.e. wheat and pea.Fig. 5 presents the results obtained for wheat in the organic (BIO) and productive (PRO) farming systems, which are the more contrasted ones.
Atmospheric deposition represents the major input of Cu, Pb and Zn. The phosphorus/potassium (PK) fertiliser used on the productive cultivation systems induced the largest input of Cd. Fertilisers permitted in organic farming induced much lower inputs of metals, except for Zn. The major results observed here are consistent with similar studies pursued at different
scales in Northern Europe (Moolenar and Lexmond,
1998; Nicholson et al., 2003).
Crop exports correspond to important fluxes of Zn and Cu, particularly for wheat under productive farm-ing. Agricultural drainage appears important for Cu, present at significant concentration in soil water. The other trace metals in soil water are often at concentration lower than the quantification limits, in that type of loamy soil at pH close to 7: thus, the corresponding fluxes were estimated with much uncertainty.
The balance of metal flows (BAL, Fig. 5)
demon-strates long-term accumulations of Cd, especially when PK fertilisers are applied, and Pb, due to atmospheric fallout, and a depletion of Cu. The Zn balance depends on the farming system.
Fig. 4. Conceptual long-term metal budget of an agricultural area. E2a: metal in food supply; E2b: metal in fertiliser; C7: aeolian erosion; C13: WWTP sludge deposit; C15a: superficial erosion of natural soils; C16a: superficial erosion of arable/cultivated soil; C15b: tile drainage of natural soils; C16b: tile drainage of arable soil.
5.2. Metal inputs due to mineral fertilisers
Many data and studies have been published about metal flows in agriculture as trace metal contents of fertilisers and urban sewage sludge spread on agricul-ture soils (the latter examined in Section 6). Phosphate fertilisers, such as those imported to the Seine River basin, are known for their significant content of some trace metals such as Cd (McLauglin et al., 1996). Simple N fertilisers are most widely used but contain little trace elements (McLauglin et al., 1996; Senesi et al., 1999).
According to French statistics (Unifa, 2005; Agreste, 2005), the total P consumption in 2003–2004, for both simple and composite fertilisers reaches 721,000 t P2O5 y− 1. According to Agreste (2005), the Seine basin corresponds to 20% of the national production cereals or oleaginous plants, and less for forage, vine and fruit. So, we are considering that the Seine basin receives about 20% of inorganic fertilisers applied in France. Using average metal content of P-containing fertilisers (McLauglin et al., 1996; Mortvedt, 1996; Keller and Schulin, 2003; Spiegel et al., 2003; Soler Soler and Soler Rovira, 1996) the trace metal inputs to the Seine River basin (Table 4) were assessed.
FromTables 2 and 4, it is concluded that metal inputs to the Seine River basin related to mineral fertilisation in agriculture are lower or much lower than through atmospheric deposition for Cu, Ni, Pb and Zn. On the
contrary, the Cd and Cr inputs to cultivated soils appear higher from fertilisation than from atmospheric fallout. The Cd, Cr and Ni inputs to cultivated soils from fertilisation are significantly larger than from reuse of WWTP sludge (Table 4).
5.3. General metal budget in rural area
These inputs to cultivated fields can be compared to the measured outputs from rural streams with low pop-ulation densities (10 to 43, average 23 inhabitants km− 2). These outputs have been estimated at 14 sites and compared to the metal fluxes derived from natural erosion (Thévenot et al., 2002). The excess metal contents are multiplied by an average TSS export rate of 10.8 t km− 2y− 1in order to generate excess metal loads: 3.4, 99, 0.57, 63, and 145 g km2y− 1for Cd, Cu, Hg, Pb and Zn respectively from rural area with 52.5% of cultivated land. The non-cultivated area, forest and grassland, are here assumed to generate zero excess loads and the domestic loads are here negligible, since most of the related population is using individual san-itation and is not connected to a sewer network. The excess loads from the cultivated area (34,000 km2) of the Seine River basin would reach 0.12, 3.4, 0.019, 2.1 and 4.9 t y− 1for Cd, Cu, Hg, Pb and Zn, respectively. These loads are far from balancing the sum of inputs toz soils from fertilisers, urban sludge reuse and
Fig. 5. Annual fluxes of metal on experimental cultivated fields (g km− 2y− 1): (Atmos: S11) atmospheric deposition, (Fertiliz: E2b) fertilisers, (Crop: E14) crops and (Drainage: C16b) leaching under the cultivated horizon, (BAL) balance = S11 + E2b−E14−C16b. Two wheat cultivation systems: (PRO) productive and (BiO) organic (Azimi et al., 2004). Uncertainties, resulting from variances of measured variables or heuristic evaluations. C13, C15 and C16a are negligible here. SeeFig. 4for metal flux coding.
atmospheric fallout, i.e. from 0.4 to 1.2% (Table 4), implying a gradual increase of the metal stocks in arable land. The retention of metals, as Hg and Pb, is probably much higher in rural area than the present estimate: before the leaded-gas ban and the control of Hg emissions from industrial sources, their fallout was probably an order of magnitude higher in the basin. The metal storage in soils should now be confirmed by direct analysis on soil profiles.
6. Urban and domestic wastes in Paris
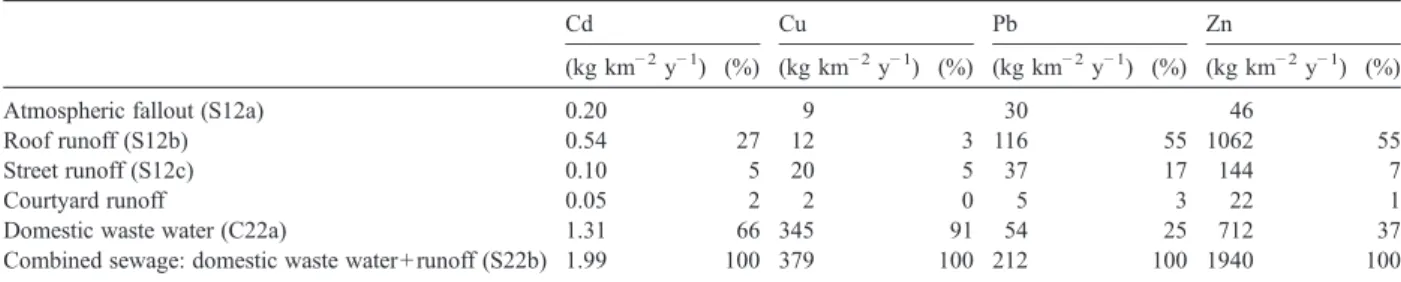
The major metals flows related to the Paris megacity area are presented inFig. 6. In addition to flows already identified inFig. 2, it specifies atmospheric emissions from housing, road traffic and industries (E5a, E5b, E6), atmospheric fallout (S12a), roof and street runoff (S12b and S12c), separate domestic sewer (C22a), residential combined (S22b) and separate (S22c) storm sewer, combined urban sewer overflows (C22d), untreated and treated waste water (S22e and S22f), industrial waste water released into rivers (E22g) or connected to urban sewer (E22h) and desilting of sewage network (C22i).
Urban atmospheric fallout, urban surficial runoff as well as combined domestic sewage have been quantified on the basis of an important field campaign led in 1996– 1997 on the Marais experimental catchment in central Paris (Chebbo et al., 2001; Chebbo and Gromaire, 2004; Garnaud et al., 1999). We are focussing first on a small
experimental sewer network, then we consider the urban and suburban Paris conurbation (Paris megacity). 6.1. Metal budget for a domestic combined sewer: the “Marais” experimental catchment
The Marais urban catchment (0.42 km2) is located in a densely populated area situated in the historical part of Paris. This residential district (29,500 inhabitants km− 2) with professional activities (small businesses, offices, administrations, resulting in 26,000 jobs per km2) is now almost devoid of industrial activity. Its surface is impervious at 91%, with roofs covering 54.4% of the catchment area and streets 23.2%. On this catchment, dry and wet atmospheric deposits of heavy metals were measured over a one year period (Garnaud et al., 1999). Runoff was collected and analysed from 11 roofs, 3 courtyards and 6 streets for about 20 rain events (Gromaire et al., 1999, 2001). Heavy metals released into the sewage system by wet street cleaning proce-dures were also quantified for the 3 sampled streets over 6 days (Gromaire et al., 2000). Heavy metal fluxes from domestic sewage only were quantified during the dry weather periods at the catchment outlet. All fluxes are presented inTable 5A.
Atmospheric fallout represents only a minor source for the metal fluxes issued from Marais catchment: 2% for Cu and Zn, 10% for Cd and 14% for Pb. This contribution might even have decreased since 1997, as
Table 4
Metal budget on Seine River basin: (A) cultivated area including (A.1) P-containing fertilisers, (A.2) urban sludge reuse and (A.3) atmospheric fallout on cultivated fields, and (B) rural area, i.e. including forest and grassland
Cd Cr Cu Ni Pb Zn A. Cultivated area
A.1 P-containing fertilisers
Average trace metal level in fertilisers (mg kg− 1P2O5) 40 200 50 50 10 200
Trace metal input per cultivated land area (kg km− 2y− 1)(1) 0.13 0.67 0.17 0.17 0.03 0.67 Trace metal input (E2b) (t y− 1) 5.76 28.8 7.2 7.2 1.44 28.8 A.2 Urban WWTP sludge reuse
Average trace metal level in Seine-Aval WWTP (1994–2003) (mg kg− 1d.m.) 8.5 124 762 48 365 2023 Trace metal input (C13) (t y− 1)(2)(3) 0.35 5.1 31 2.0 15 83
A.3 Atmospheric fallout (corrected for soil dust fallout)
Trace metal input to cultivated land area (kg km− 2y− 1)(2) (4) 0.049 0.15 4.9 0.70 3.17 17.1
Trace metal input (S11) (t y− 1) 1.66 5.22 166 23.9 108 583 B. Rural area (t y−1)
P-containing fertilisers and WWTP sludge reuse (E2b + C13) 6.11 33.9 38.4 9.2 16.4 112 Atmospheric fallout (S11)(5) 3.17 9.9 316 45.6 204.8 1109 Inputs to rural area (E2b + C13 + S11) 9.27 43.8 355 54.7 221.2 1221 Anthroposphere leaks from rural area (C16)(6) 0.12 n.a. 3.4 n.a. 2.1 4.9 Rural leaks/rural inputs (%) 1.25 n.a. 0.9 n.a. 1.0 0.4 SeeFig. 4for metal flux coding.
(1)Based on 144,000 t P
2O5annual consumption, representing 20% France consumption;(2)34,000 km2arable soil in the Seine River basin (EEA,
more recent fallout data on the same catchment (Azimi et al., 2005) reveals a significant decrease of Cd and Pb fallout (Meybeck et al., 2007-this volume).
Surface runoff represents the major source for Pb and Zn (respectively 75% and 63% of the annual flow), mainly due to roof runoff (55% of the annual Pb and Zn
Table 5
Tentative long-term urban budget for metals in Paris sewage system
A. Paris city combined sewage system: annual fluxes (kg km− 2y− 1) in atmospheric fallout, urban runoff and domestic waste water within Le Marais experimental urban catchment (0.42 km2) and distribution of each urban source within combined sewage (%)
Cd Cu Pb Zn
(kg km− 2y− 1) (%) (kg km− 2y− 1) (%) (kg km− 2y− 1) (%) (kg km− 2y− 1) (%) Atmospheric fallout (S12a) 0.20 9 30 46
Roof runoff (S12b) 0.54 27 12 3 116 55 1062 55 Street runoff (S12c) 0.10 5 20 5 37 17 144 7
Courtyard runoff 0.05 2 2 0 5 3 22 1
Domestic waste water (C22a) 1.31 66 345 91 54 25 712 37 Combined sewage: domestic waste water + runoff (S22b) 1.99 100 379 100 212 100 1940 100 B. Urban sewer network balance in Paris megacity urban sewer catchments (t y− 1) (2741 km2, 9.47 million inhabitants)
Cd Cu Pb Zn
Domestic waste water (C22a) 0.42 111 17 229
Urban runoff (S12b + S12c) 0.19 26 84 470
Industrial waste water input to sewer (E22h) 0.005 1.2 0.3 10 Combined sewer overflow (CSO) (C22d) 0.051 6.6 6.6 52 Sand extraction from sewer (C22i) 0.13 18 42 110 Calculated net input to WWTP (C22a + S12b + S12c + E22h−C22d−C22i) 0.43 113 53 547 Measured input to WWTP (raw sewage) (S22e) 2.70⁎ 160 49.5 300 C. Annual metal budget in Paris megacity liquid waste (t y− 1)
Cd Cu Pb Zn
WWTP sludge (C13) 0.76 68 32.4 180
WWTP treated waste water (S22f) 2.07⁎ 26 25.5 90 Direct industrial waste water inputs to river (E22g) 0.011 3 0.8 23 Total metal fluxes within liquid waste (C22d + C22i + C13 + S22f + E22g) 3.01⁎ 121 107 455 SeeFig. 6for metal flux coding. (⁎) probably overestimated: see text.
flow). This can be explained by the corrosion of metallic roofing materials (Gromaire et al., 2002) since, in central Paris, Zn roofing is dominant and concerns half of the roof area on Marais catchment. In addition, Zn is commonly used for gutters and down pipes, as well as for weather-tightness fittings, in tile roofing. Pb is also often used for roof fittings, especially on historical slate-covered buildings. As Cd is present as an impurity in all Zn artefacts, its release into roof runoff is also significant (27%).
For the Marais catchment, domestic sewage gener-ates only 25% of the annual Pb flow and 37% of the Zn flow. It is however the main vector for Cd (66%) and for Cu (91%). The important amounts of Cu in the domestic sewage can be attributed to the corrosion of the Cu tape water pipes inside the buildings.
6.2. Metal budget for Paris megacity sewers
The surfaces connected to urban sewers in Paris megacity can be divided into (i) continuous urbanised area (91 km2), (ii) discontinuous urban area (1087 km2), and (iii) industrial and commercial zones (222 km2).
The megacity sewer metal budget is based on information from several areas: (1) the Seine Aval waste water treatment plant (SA-WWTP) (Fig. 1), (2) the combined sewer overflows (CSOs), (3) the grit chambers of the sewer network, and (4) the urban sludge generated by the WWTP.
The Seine-Aval (Achères) wastewater treatment plant (SA-WWTP) which collects 6.5 million inhabitants in the late 1990s is monitored weekly by the Syndicat Interdépartemental d'Assainissement de l'Aglomération Parisienne (SIAAP), the institution in charge of Paris megacity sanitation. The daily volumes entering the waste water treatment plant are 24.2 m3s− 1on average between 1995 and 2004. The metal flux related to the produced sludge has been assessed from the survey of the weekly metal contents in SA-WWTP sludge between 1995 and 2004 and the annual production of sludge has been estimated at 61,000 t dry matter (d.m.). This sludge is partially reused on Seine River basin cultivated area (Table 4). The SA-WWTP treatment efficiency is 76, 70 and 49% for Cu, Zn and Pb respectively. For Cd, the actual treatment efficiency is difficult to assess because of the relatively low Cd level currently observed in both the raw and the treated sewage, often below the detection limit (DL). Therefore, for the purpose of our calculation, the Cd DL was used as substitute concentration below DL. These SA-WWTP data were extrapolated to the whole Paris megacity, prorating to the population, i.e. 6.5 and 9.5 million respectively.
Combined sewer overflows (CSOs) represent, within the Paris megacity, an important source of organic matter impacting strongly the Seine River quality (Even et al., 2007-this volume). The release of particulate metal from the main CSOs of the Parisian sewer system, situated at Clichy, La Briche and Achères, has been assessed using the volumes of wet weather urban discharge at these 3 locations.
Particulate metal in sands extracted from the sewer for maintenance purposes, for the whole Paris megacity WWTP catchment basin, has been evaluated using data from a 3-year survey conducted from 2001 to 2003 (Moilleron et al., 2005).
A summary of these fluxes is presented onTable 5B, using the following assumptions:
• Domestic waste water fluxes (C22a) were extra-polated prorating the population of the Marais catch-ment data (Table 5A);
• Urban runoff (S12b and c) for the continuous urban area: metal fluxes per km2 from Marais catchment were corrected in order to take into account the lower percentage of Zn roofs in suburbs (40% of the roof surfaces, instead of 55%);
• Urban runoff (S12b and c) for the discontinuous urban area, industrial and commercial zones: metal fluxes from Marais catchment were corrected assuming the absence of Zn roofs on these areas and using different runoff coefficients (0.8, 0.35 and 0.6 for Marais-continuous urban tissue, disMarais-continuous urban area, and commercial and industrial areas respectively); • Combined sewer overflows (CSOs) (C22d): total
suspended solid (TSS) median concentrations were
considered constant at 240 mg L− 1 for all CSOs
(Estèbe et al., 1998; Kafi-Benyahia et al., 2005); median values of particulate metal distribution fac-tors in CSOs reached 75, 93, 97 and 85% for Cd, Cu, Pb and Zn respectively as assessed during wet weather conditions at the Clichy main combined sewer of Paris megacity (Kafi-Benyahia et al., 2005); CSO particulate metal levels (Estèbe et al., 1998) have been recently revised during wet weather peri-ods (3.1, 504, 525 and 3600 mg kg− 1for Cd, Cu, Pb and Zn, respectively), using also wet weather sam-ples of Clichy main combined sewer;
• Sand extraction from sewer (C22i) was based on the metal contents of sediment extracted from the grit chambers of the City of Paris (5500 t d.m. y− 1 in 2001–2003), extrapolated to Paris megacity (9.47 mil-lion inhabitants) using the Ile-de-France 120,000 t y− 1 annual grit chamber extraction and a 66% average dryness value for such solid waste;
• WWTP sludge (C13) was based on a yearly produc-tion of 61,000 t (dry weight) of Seine Aval WWTP treated sludge, extrapolated to Paris megacity; • Treated waste water (S22f) was based on 1995–2004
data from the Seine Aval WWTP, prorated to the Paris megacity population;
• Direct industrial waste water inputs to river (E22g) were downscaled from the whole catchment to Paris megacity, prorated to the population (Table 7). The metal budget in Paris megacity liquid wastes is compared to actual metal flux received by WWTP (S22e onTable 5B): a relatively good agreement is found for Cu and Pb fluxes, indirectly validating the assessment procedure previously described. The measured annual Cd flux is higher than the estimated value, probably because the Cd concentration levels in raw sewage is often below DL. The calculated Zn input to WWTPs is 1.8 times larger than the measured input: this difference is likely to result from the presently rough estimate of the Zn containing roof material within Paris megacity, when extrapolating results from Le Marais experimental catchment (Table 5A).
There is a good agreement between annual fluxes measured in raw sewage (S22e) and output of Paris megacity WWTP (sludge C13 + treated waste water S22f) excepted for Cu (160 and 94 t y− 1, respectively). The direct industrial waste water input to river (E22g) is presently less than 5% of the Paris megacity total metal fluxes associated with liquid waste (Table 5C). This illustrates the present efficiency of treatment and recycling of industrial waste water.
The conceptual metal budget of the Seine catchment (Fig. 2) includes imports and exports to and from the catchment area (E1), the uses and transformations of metals (E3 and E4), long term storage in urban or industrial structures (storage B) and in waste dumps and polluted industrial soils (storage C). These fluxes and flows are discussed in the next section.
7. Use, transformation, stock and end of life of metals
The purpose of this section is not to establish the full Material Flow Analysis (MFA) of heavy metals in
the Seine River basin anthroposphere (Baccini and
Brunner, 1991; Brunner and Rechberger, 2003) but to illustrate, by selected examples, the respective weights of the different metal stocks. Focus is placed on Pb which is the best documented. Data is also presented on industrial sources of As, Cd, Cr, Cu, Hg, Ni, Pb an Zn into the environment, as collected by several
French administrations (ministries, national and regional agencies).
7.1. The Pb material flow
A tentative Pb budget on Seine basin area has been build, for the year 2000, including metal import–export balance, metal transformation, production of metal containing goods and metal recycling, Pb uses and Pb-containing solid waste management (Table 6A). Goods were clustered according to their environmental fate: (i) Pb accumulators which are highly recycled (theoretical recycling rate 90%), (ii) “Pb metal” in tubes, pipes, sheets, that are less recycled and have much longer life time, (iii)“Pb oxides and chemicals” including various products such as crystal glass, glasses for radiation protection, cathode-ray tubes, and (iv) tetraethyl Pb which is 100% emitted to the atmospheric environment from leaded gasoline, banned since 2000. Cumulated stocks since 1940 were evaluated with a model proto-type under development by Mouchel and Lestel, based on the integration and interpolation of data covering the 1940–2000 periods (Table 6B).
The Pb circulation model was first established at the scale of the French territory (550,000 km2) for which data are available. Data on metal production, Pb usages, goods imports/exports, percentage of recycled goods, environmental fate of domestic waste, etc. were derived from economical surveys (DGDDI, 2000; INSEE, 2002; FEDEM, 2003). Release in the environment was cal-culated as leaks of the industrial processes, from the Pb usages and from stocks. Pb circulation model outputs allow the estimates of the importance of environmental stocks such as Pb in sediments, in landfills and in soils. Transitory stocks such as Pb in the atmosphere were considered as negligible.
The Pb circulation was then established for the Seine basin area (64,700 km2) with different prorating for (i) the basin population (14 million vs. 60 million for France) for domestic and urban uses, and (ii) the per-centage of Pb related industries of the Seine River basin relative to France, for the transformation processes (Table 6A). This latter percentage is estimated as 30% for the production of accumulators, by considering the respective Pb recycling capacities inside and outside the Seine River basin, i.e. 50,000 and 105,000 t respectively (Vignes et al., 1998). For the Pb oxide production it reaches 100% (one major firm). For the other transfor-mation processes, the importance of the Seine River basin has been based on the relative importance of the basin industry, i.e. 30%. The negative values of the Pb import–export E1 (Table 6A) shows that exports from
the Seine River basin exceeds the imports: this has been true since many decades. The annual flows of new and recycled Pb are presently unknown at the Seine River basin scale: thus it is not possible to build-up the Pb mass balance at the basin scale (Table 6A).
As expected, the Pb fluxes into the environment due either to the transformation process, the use of goods or the abrasion of stocks are several orders of magnitude below the Pb circulation fluxes in the anthroposphere
(Table 6A). Atmospheric emissions resulting from the model and from direct fallout measurements (Section 3) both reach ca. 200 t y− 1, a significantly higher value than the 35 t y− 1assessed for atmospheric emission by the CITEPA administration (2004, see Section 3.1): such discrepancy is not yet explained. Inputs into waste water treatment plants are also in good agreement between the model values (61 t y− 1) and the extrapola-tion to the whole basin (73 t y− 1) of Pb inputs to the Seine Aval waste water treatment plant (Table 5B). The good agreement between values from the model and field data is a validation of the model and confirms the order of magnitude of Pb stocks.
Huge amount of Pb has been accumulated since centuries in cities as roof covers, pipes, cables shielding, oxide containing glasses, etc. (Table 6B). The standing stock of Pb in the automobile fleet is relatively limited (49,000 t), due to the short lifetime of accumulators (4 y). The total Pb stock cumulated from 1940 to 2000 was assessed as ca. 600,000t, i.e. 20 to 400 times the Pb annual import minus export estimates and 10 to 50 times the Pb annual transformation flows during the last decade (1994– 2003). Nevertheless such a comparison is not really significant since Pb recycling has dramatically increased since 1940.
7.2. Industrial wastes to atmosphere and river This material flow model has not yet been developed for metals other than Pb. Thus, in order to estimate metal pressures on the Seine River basin (Table 7), French administration data have been collected from the “Registre Français des Emissions Polluantes” edited by the French Ministry of Ecology and Sustainable Devel-opment (IREP, 2004). This database replaces the“Réseau National des Données sur l'Eau (RNDE)”, presently EauFrance, which was created in 1992 by the French Ministry of Environment and began to publish data on industrial release in 1996. Values published by IREP, originating only from registered and authorized indus-tries, are certainly underestimated and thus have been considered here as a minimum. For industrial atmospheric emissions, we selected data published byCITEPA (2004) (Table 1) which is considered as a maximum.
Following the European Water Framework Direc-tive (WFD, 2000), industrial waste waters are directly monitored since 2005, through a standardised protocol (24 h survey), for the 36 major pollutants listed in the Water Framework Directive (2000), including As, Cd, Cr, Cu, Hg, Ni, Pb and Zn (AESN, 2006). As only 300 industrial sewages over 900 were analysed in 2005– 2006, these measured fluxes were multiplied by 3.
Table 6
Tentative budget of Pb: (A) annual flows and fluxes in the Seine River basin (1994–2003) (t y− 1) and (B) assessment of cumulated stocks from 1940 to 2000 (t)
A. Annual flows (t y− 1)
E3–E4 Transformation within Seine River basin(1)(t y− 1) Accumulators 51,000 Metal/cables/alloys 13,000 Oxides and chemistry 22,000 Pb recycled within the Seine basin 42,000 E1 Pb import–export(1)(t y−1)
Accumulators −31,000 Metal (pipes, cables,…) −1400 Oxides and chemistry −15,000 Tetraethyl Pb 0 Leaks (t y− 1)
E5 + E6 Atmospheric emissions 184(1)/35(2)
S10 + S11 + S12 Atmospheric fallout 205(3) S12 (a + b + c) Pb in urban runoff 5.5(1)/124(4) E22h Pb in industrial sewage released
into domestic sewers(5)
0.5 S22e Input to WWTP (raw sewage) 61(1)/73(4) S22f Pb in treated waste water 29(1)/38(4) E22g Pb in industrial sewage directly
released into rivers
1.5(1)/1.1(5) C13 Pb in sludge produced by waste
water treatment plants
35(1)/48(4) C22d Pb in combined sewer
overflows (CSOs)(6)
10 C22i Pb in sand extracted from
sewer network(6)
62
B. Cumulated stocks from 1940 to 2000(1)(t)
Storage A Stocks in natural soils 100,000 Storage B Accumulators 49,000
Pipes, tubes, roofs 110,000 Oxide containing glasses 30,000 Cables shielding 60,000 Alloys 15,000 Printing characters 25 Storage C Stocks in landfills 200,000 Storage
D + E + F + G
Stocks in river and estuarine sediments
30,000 Total storage
(A–G)
594,000
SeeFigure 2for metal flux Coding.
(1)
Pb circulation model, see text;(2)Table 1;(3)Table 2;(4)Table 5B extrapolated to 14 million inhabitants;(5)Table 7;(6)Table 9.
Moreover 30% of the industrial waste water was con-sidered as released directly into rivers and 70% as connected to urban sewer and treated in waste water treatment plants (WWTP). As minor industries were not taken into account, the maximum of industrial input was estimated as twice the value obtained from the major industries.
The present budget of metal waste pathways to the environment for the Seine basin (Table 7) shows that the total outputs of Zn to the environment is significantly higher compared to Cr, Cu, Ni and Pb and is two orders of magnitude higher compared to As, Cd and Hg. Emissions to atmosphere is the most important pathway for all metals.
8. Retention of particulate metals within the aquatic system
Once in the aquatic system, heavy metals can be stored in the river corridor, in association with particulate matter, in natural sites such as floodplain and lakes (negligible in the Seine catchment) and in artificial sites as reservoirs; they can also be removed by dredging and disposed in specific land fills (Meybeck and Vörösmarty, 2005).
8.1. Deposition in reservoir
There are three major reservoirs on the Seine basin (Fig. 1), which are fed during 6 months by waters derived from the Marne, Aube and upper Seine rivers. Then the water is released during 5 months to sustain low flows on the Seine, particularly in its Parisian reach (Garnier et al., 1999).
Several cores (0.4–1.0 m length) were collected directly on the bottom of these three major reservoirs, at different time, during decennial emptying. Core dating has been realised by 137Cs and 210Pb methods (Le
Cloarec et al., 2007-this volume). The sediment accumulation rates vary, at the sites where cores were sampled, from 3 to 40 kg m− 2 y− 1 with an average of 20 kg m− 2y− 1. When extrapolated to the total area of the three reservoirs (92 km2) such rate would give an enormous amount of sediment storage, 1.84 Mt y− 1, i.e. more than twice the average sediment output at Poses for the whole Seine River basin. As these reservoirs intercept only a small fraction of the basin area and they receive river inputs during only half of the year, such high storage is unlikely.
Another storage estimate is based on the total volume of Aube, Seine and Marne river waters entering these reservoirs (1000 Mm3y− 1) with an average winter TSS
reaching 50 mg L− 1 during the period of filling.
Assuming the trapping efficiency to be at least 90% for such types of reservoirs (Vörösmarty et al., 1997), this would lead to total sediment storage of only 45,000 t y− 1 (Table 8). The discrepancy between this estimate and the one derived from core dating is probably due to the winnowing effect: when reservoirs are nearly emptied, their sediments are stirred by waves (the fetch exceeds 5 km in most directions) and transported downwards to the centre of reservoirs where they may accumulate. Any core taken from these areas would considerably overestimate the mean sediment accumu-lation rate for the whole reservoir. About every 10 years these reservoirs are completely emptied for inspection. This leads to a partial release of trapped sediments. The tentative budget proposed here cannot precisely account for these decennial events. The average metal contents in reservoir sediments ([C1] inTable 8) are derived from several cores.
8.2. Floodplain sediment accumulation
In the floodplain, the accumulation of fine sediment can have important implications for the fate of metal in a
Table 7
Pathways of metal wastes resulting from industrial activities (2003–2006) in the Seine River basin (t y− 1): selected value and range (see text)
As Cd Cr Cu Hg Ni Pb Zn
Total atmospheric and liquid waste 2.7 1.5 23.6 34.9 1.6 38.2 36.8 189 Atmosphere emissions (E6)(1) 2.39 1.48 15.6 29.1 1.61 33.6 35.2 140
Range(2) 0.2–2.4 0.3–1.5 1–16 0.3–29 0.3–1.6 2.7–34 6–35 0.6–140 Release into rivers (S26a)(3) 0.193 0.016 5.6 4.0 0.016 3.2 1.1 34.6
Range(4) 0.005–0.4 0.015–0.032 0.2–11 4–10 0.002–0.032 0.4–6 0.3–9 3–70 Release into urban sewer (S26b)(3) 0.083 0.007 2.4 1.7 0.007 1.4 0.5 14.8
Range(4) 0.01–0.16 0.007–0.1 0.5–5 0.3–4 0.003–0.16 0.2–2.8 0.2–2.8 0.5–30
SeeFig. 2for metal flux coding.
(1)CITEPA (2004)data;(2)minimum:IREP (2004); maximum:CITEPA (2004);(3)direct measurements (AESN, 2006);(4)minimum:EauFrance
large catchment (Walling et al., 1998). The assessment of present overbank deposition for the 64,700 km2Seine River basin is difficult and we are aiming here only at a realistic order of magnitude. Several tenths of cores were collected with percussion corer on representative areas in the different types of floodplain, from head-waters to mouth, in the Seine River and its major tributaries. All cores were analysed by gamma spectro-metry. First, 137Cs budget (Bq m− 2) was compared to reference values, as in soil erosion studies (Walling et al., 1998). A large variety of accumulation rates was observed, from total stability to channel filling. When sedimentation rate was high enough (larger than 1 cm y− 1), the history of 137Cs fallout was generally well printed in studied cores.
For small upstream reaches, overbank deposition has been neglected because of higher slope values (1.1, 0.4 and 0.2% mean values for Strahler orders 1, 2 and 3, respectively) and fine-grained material supply to the river by surface runoff.
For the middle reach of the Seine, the Bassée upstream Paris, constitutes a typical alluvial plain (slope below 0.1%, 840 km2) flooded every year. Its flooding, studied by Fustec et al. (1996) and Bendjoudi et al. (2002)is actually very complex, combining direct river overflow and phreatic groundwater inundation.
For higher Strahler orders (i.e. 6 and 7), such alluvial plain does not exist. Downstream Paris city, the Seine River corridor consists of few abandoned channels (i.e. ox-bows), flooded during high flow periods. Four of them were cored in the vicinity of Bouafles (Fig. 1): overbank accumulation rates were determined within the 5 to 25 kg m− 2 y− 1 range. Such sediment
accu-mulation sites are significant but geographically limited to scattered areas.
In conclusion, available data are still insufficient to enable an accurate assessment of over bank deposits. For a first assessment of the global metal retention, we are using rough estimates of sediment storage in the three types of reaches, i.e. reservoirs, upstream flood-plains and downstream oxbows (45,000, 50,000 and 5,000 t y− 1 respectively) (Table 8). Metal contents of sediment deposited in reservoirs and floodplains result from analyses of the related cores, for the 10 years old top part of cores (Meybeck et al., 2007-this volume). 8.3. River sediment dredging
In order to anticipate the management of dredged materials in the Seine basin, the quality of the sediments in the river is checked every 3 years before dredging operations by the Navigation Service of the Seine basin (SNS). The Seine basin sites are clustered in 3 groups, hence all of them are analysed within 3 years of sampling. However, for a given year, the sampling sites are randomly defined (Carpentier et al., 2002a,b). This is the reason why temporal evolution cannot be taken into account. The quantity of dredged sediment has ranged between 60,000 and 180,000 t y− 1 for the last fifteen years (Table 8). In the case of the Seine basin, the management of dredged sediments is of great environ-mental concern, since some dredged materials can be qualified as wastes (Meybeck et al., 2007-this volume). They are presently stored, at 70%, in disused gravel and sand quarries under a layer of water (Carpentier et al., 2002c).
Table 8
Retention of metal associated to river particulate matter in the river corridor
Cd Cr Cu Hg Pb Zn RPM
(1) Total reservoir retention (C23) [C1] 0.26 52 26 0.10 14 15
Mr1 0.012 2.34 1.17 0.005 0.63 0.68 45,000
(2) Floodplain (C24) [C2] 1.38 84 46 0.80 61 108
Mr2 0.026 3.18 1.70 0.013 1.25 2.50 55,000
(3) Dredging (C25) [C3] 1.70 47 31 0.40 43 140
Mr3 0.170 4.70 3.05 0.040 4.30 14.00 100,000
Total retention (1) to (3) Mrtot 0.21 10.2 5.9 0.057 6.18 17.18 200,000
Retention from natural sources [C]nat 0.26 52 14 0.023 26 76
Mrnat 0.052 10 3 0.005 5.20 15 200,000
Retention from anthropogenic sources⁎ Mrpol 0.16 0 3 0.05 1 2 200,000
Exported to estuary (1993–2002)
Particulate flux (t y− 1) Mp 1.75 87 84 1.25 87.5 315 700,000
Dissolved flux (t y− 1) Md 0.44 17 25 0.12 9 135
C23 to C25: estimated average metal contents during the 1995–2000 period (mg kg− 1d.m.); annual retention of particulate matter (RPM) and of metals (Mr1to Mr3) (t y− 1).
8.4. Sediment budgets and metal retention within the river network
As for many other river basins the sediment budget of the Seine River basin assessed in this paper presents uncertainty and perhaps bias. Our estimates of average suspended particulate matter (SPM) are derived from total suspended solids (TSS), a water quality indicator determined at a monthly frequency on surface river samples while SPM implies multiple vertical sampling across the river section, each associated with stream flow velocity measurements, at a much higher frequency during floods. In the absence of vertical profiles of SPM, a systematic underestimation of TSS due to surface sampling only cannot be ruled out.
The estimates for floodplain retention in stream orders ranging between 4 and 7 are still tentative and cannot be assessed from the upstream–downstream sediment budget at the ca. 36 water quality stations for which discharge-weighted long term average (TSS⁎) estimates are available, due to major uncertainties. The mass of dredged river bed sediment provided by the Seine river navigation authority (SNS) is more accurate. The combination of retention in reservoirs and flood-plain and of withdrawal of river sediment through dredging is tentatively presented in Table 8 for the period 1995–2000.
The total sediment retention (Mrtot) is estimated to reach 200,000 t y− 1, i.e. about the fourth of the total sediment discharged at river mouth (700,000 t y− 1), as based on TSS measurements at the Poses station. The apportionment of sediment retention upstream and down-stream Paris is a first estimate. Updown-stream of Paris the river sediments retained (145,000 t y− 1) are much less contaminated than those retained downstream (55,000 t y− 1) therefore the respective quantities of retained metals are of the same order of magnitude. This total retention sums particulate metal from natural origins (Mrnat; 200,000 t y− 1with natural background contents [C]nat) and from anthropogenic origins (Mrpol= Mrtot−Mrnat) (Table 8). Dredging is significant in terms of sediment annual mass and appears to be the first component of particulate metal retention.
9. Discussion of general budget
Metal budgets, which have been presented here at various scales, from agricultural plots to the whole basin area, are derived from very heterogeneous data from multiple sources. The following discussion is an attempt to compare these data according to our conceptual model (Fig. 2).
9.1. Accounting for dissolved metal fluxes
Dissolved metals are very difficult to monitor in water quality surveys due to their sensitivity to ambient contamination from sampling to laboratory (Horowitz,
1995). Within the PIREN-Seine programme Wang and
Mouchel (inThévenot et al., 1998) have conducted two surveys in December 1993 and May 1994 of dissolved metals with ultra clean techniques (Zhang et al., 1992): the average percentage of dissolved metals vs. total metals was relatively low at Poses (n = 2): 5–20, 11–34, 15–28, 9–14, 47–77 and 0.1–0.7% for Cd, Cu, Zn, Pb, Ni and Fe respectively. The budget of total metals exported to the estuary should therefore be incremented with the dissolved fluxes. This factor depends both on the metal and on the TSS level, resulting from seasonal conditions (Table 9C). A more comprehensive survey (n≥40) had been previously conducted by IFREMER at the same station, in 1990 and 1991 (Cossa et al., 1994). The dissolved vs. total metal percentage reached 19.2, 23.4, 9.1, 9.5 and 29.2% for Cd, Cu, Hg, Pb and Zn respectively. Recent surveys were conducted both on Seine and Marne Rivers near Paris from February 2003 till December 2004 (Elbaz-Poulichet et al., 2006). From this study, it is possible to assess a two-year mean annual load (n = 19) at Andrésy, downstream the confluence with the Oise River (Fig. 1), and to compare it to the total particulate metal loads (Table 9C). The corresponding dissolved vs. total metal percentage are 55, 16, 23, 4.7 and 34% for Cd, Cr, Cu, Pb and Zn respectively and if two samples, which are ca. 100 times more concentrated in dissolved Cd, are discarded, it drops from 55 to 15% for Cd. Taking into account these three studies, the budget of total metals exported to the estuary has been accordingly increased by a factor of 1.25, 1.19, 1.30, 1.1, 1.1 and 1.4 for Cd, Cr, Cu, Hg, Pb and Zn respectively (Tables 8, 9C and 10).
Dissolved and particulate metals were also surveyed in raw and treated waste water at the SA-WWTP in March and April 2004 (Tusseau-Vuillemin et al., 2007-this volume; Buzier et al., 2006). In the raw waste water collected at SA-WWTP inlet, Cr, Cu, Fe and Pb were mainly found as particulate metals (median percentage higher than 73%), whereas Cd and Ni were mostly dissolved (median percentage 86 and 78% respectively). Large variations of WWTP treatment efficiencies were observed for dissolved metals, with median efficiency values found to be very low for Ni (6%), whereas Cd, Cr, Cu and Pb efficiencies were in the 30–56% range. When the SA-WWTP results are confirmed over a longer period, the general sewer inputs to the Seine River basin should be revised accordingly.
9.2. General metal budget within the River Seine basin Table 9A presents annual metal inputs (A.1) to Seine basin soils (atmospheric fallout, agricultural fertilisers
and WWTP sludge reuse) and the storage and/or disposal (A.2) of urban wastes not released into the river (sand extracted from sewers, remaining WWTP sludge and domestic solid waste). Solid domestic waste
Table 9
General budget of trace metals over the Seine River basin: (A) inputs to the whole Seine River basin area, (B) to river and (C) outputs at river mouth (t y− 1) (1994–2003)
As Cd Cr Cu Hg Ni Pb Zn A. Environmental inputs to the whole basin area
A.1 Input to soils
Atmospheric fallout (S10 + S11 + S12)(1) 3.17 9.93 316 0.75 45.6 205 1109
Agricultural fertilisers (E2)(2) 5.76 28.8 7.2 7.2 1.4 29
Agricultural WWTP sludge reuse (C13)(3) 0.35 5.1 31 2.0 15.0 83
Soil input sub-total n.a. 9.27 43.8 355 n.a 54.7 221 1221 A.2 Storage and disposal of urban waste
Dredged material (C25)(4) 0.17 4.7 3.1 0.04 4.3 14
Sand extraction from sewer network (C22i)(5) 0.70 0.19 4.0 26.3 0.44 2.58 62.4 163 WWTP sludge deposit(5)(6) n.a. 0.77 n.a. 69 n.a. n.a. 33.0 183 Domestic solid waste disposal(7) 7.6 6.07 278 1589 72.8 1206 1517 Storage and disposal sub-total 8.3 7.2 286.23 1688 5.03 75.38 1305 1876 Input to basin sub total (A.1 + A.2) n.a. 16.5 336 2045 n.a n.a. 1529 3100 B. Inputs to river
B.1 General inputs
Erosion of natural soils (C15)(8) n.a. 0.15 10.0 10.5 0.02 18.9 14 42
B.2 Anthroposphere leaks from rural area
(C16) n.a. 0.12 n.a. 3.4 0.019 n.a. 2.1 4.9 B.3 Anthroposphere leaks from urban area
Treated urban waste water (S22f)(5) 3.05⁎ 39 38 134 Combined sewer overflows (C22d)(5) 0.075 10 10 77 Direct industrial waste water input to river (E22g)(9) 0.19 0.02 5.6 4 0.016 3.22 1.13 34 Leaks sub total (B.2 + B.3) n.a. 3.3⁎ n.a. 56 n.a. n.a. 51 250 Erosion + leaks sub-total (B.1 + B.2 + B.3) n.a. 3.4 n.a. 66 n.a. n.a. 65 292 C. Outputs from Seine River network
C.1 River corridor particulates retention
C23 + C24 + C25 n.a. 0.21 10.2 5.9 0.057 n.a. 6.2 17 C.2 Output at Seine River mouth
Particulate metal(10) 1.75 87 84 1.25 88 315
Dissolved metal(11) 0.44 17 25 0.12 9 135 River output (S21) n.a. 2.19 104 109 1.37 n.a. 96 450 River retention + output (C.1 + C.2) n.a. 2.4 114 115 1.43 n.a. 102 467 D. General budget
Output + river retention/input to river(12) n.a. 0.70 n.a. 1.73 n.a. n.a. 1.58 1.60
Output + river retention/environmental input to basin and river(13) n.a. 0.12 n.a. 0.055 n.a. n.a. 0.064 0.14
SeeFigs. 2 and 6for metal flux coding.
(1)
Excess metal fallout, after correction from aeolian soil deposits (Table 2);(2)inputs from P-containing fertilisers (Table 4);(3)inputs from urban WWTP sludge reuse (Table 4);(4)dredged material from rivers (Table 8);(5)data extrapolated from Paris megacity (Table 5B) to whole basin, prorated to population (from 9.47 to 14 million inhabitants);(6)total WWTP sludge production corrected from their partial agricultural reuse (Table 4);(7)part of urban solid waste production not having been incinerated (ADEME/ITOM, 2002; ADEME/INSAVALOR POLDEN, 1998);(8)background metal loads at Seine River mouth (Table 10);(9)from
AESN (2006)(Table 7);(10)total particulate loads;(11)see text ( Section 9.1);(12)(C.1 + C.2)/ (B.1+ B.2 + B.3);(13)(C.1 + C.2) / (A.1 + A.2 + B.1 + B.2 + B.3); (⁎) probably overestimated for Cd; (+) probably underestimated for Cd; (n.a.) non available data.

![Fig. 3. Metal atmospheric fallout assessment on the Seine River basin: (A) Spatial distribution of Pb level (mg kg − 1 ) in terrestrial mosses [(o) moss sampling stations within Seine River basin] (Gombert et al., 2004) and (B) multi metal (As, Cr, Cu, Cd,](https://thumb-eu.123doks.com/thumbv2/123doknet/13093036.385484/7.816.56.756.779.989/atmospheric-assessment-spatial-distribution-terrestrial-sampling-stations-gombert.webp)