HAL Id: hal-03084464
https://hal.archives-ouvertes.fr/hal-03084464v2
Submitted on 10 Feb 2021HAL is a multi-disciplinary open access archive for the deposit and dissemination of sci-entific research documents, whether they are pub-lished or not. The documents may come from teaching and research institutions in France or abroad, or from public or private research centers.
L’archive ouverte pluridisciplinaire HAL, est destinée au dépôt et à la diffusion de documents scientifiques de niveau recherche, publiés ou non, émanant des établissements d’enseignement et de recherche français ou étrangers, des laboratoires publics ou privés.
Dynamics of Water Confined in Mesopores with
Variable Surface Interaction
Aicha Jani, Mark Busch, J Benedikt Mietner, Jacques Ollivier, Markus Appel,
Bernhard Frick, Jean-Marc Zanotti, Aziz Ghoufi, Patrick Huber, Michael
Fröba, et al.
To cite this version:
Aicha Jani, Mark Busch, J Benedikt Mietner, Jacques Ollivier, Markus Appel, et al.. Dynamics of Water Confined in Mesopores with Variable Surface Interaction. Journal of Chemical Physics, American Institute of Physics, 2021, 154 (9), pp.094505. �10.1063/5.0040705�. �hal-03084464v2�
1
Dynamics of Water Confined in Mesopores with
Variable Surface Interaction
Aîcha Jania, Mark Buschb, J. Benedikt Mietnerc, Jacques Ollivierd, Markus Appeld, Bernhard Frickd, Jean-Marc Zanottie, Aziz Ghoufia, Patrick Huberb,f,g*, Michael Fröbac*, and Denis Morineaua*
aInstitute of Physics of Rennes, CNRS-University of Rennes 1, UMR 6251, F-35042 Rennes,
France
bHamburg University of Technology, Center for Integrated Multiscale Materials Systems
CIMMS, 21073 Hamburg, Germany
cInstitute of Inorganic and Applied Chemistry, University of Hamburg, 20146 Hamburg,
Germany
dInstitut Laue-Langevin, 71 avenue des Martyrs, F-38000 Grenoble, France
eLaboratoire Léon Brillouin, CEA, CNRS, Université Paris-Saclay, F-91191 Gif-sur-Yvette,
France
fDeutsches Elektronen-Synchrotron DESY, Centre for X-Ray and Nano Science CXNS, 22603
Hamburg, Germany
gHamburg University, Centre for Hybrid Nanostructures CHyN, 22607 Hamburg, Germany
2
ABSTRACT
We have investigated the dynamics of liquid water confined in mesostructured porous silica (MCM-41) and periodic mesoporous organosilicas (PMOs) by incoherent quasielastic neutron scattering experiments. The effect of tuning the water/surface interaction from hydrophilic to more hydrophobic on the water mobility, while keeping the pore size in the range 3.5-4.1 nm, was assessed from the comparative study of three PMOs comprising different organic bridging units and the purely siliceous MCM-41 case. An extended dynamical range was achieved by combining time-of-flight (IN5B) and backscattering (IN16B) quasielastic neutron spectrometers providing complementary energy resolutions. Liquid water was studied at regularly spaced temperatures ranging from 300 K to 243 K. In all systems, the molecular dynamics could be described consistently by the combination of two independent motions resulting from fast local motion around the average molecule position and the confined translational jump diffusion of its center of mass. All the molecules performed local relaxations, whereas the translational motion of a fraction of molecules was frozen on the experimental timescale. This study provides a comprehensive microscopic view on the dynamics of liquid water confined in mesopores, with distinct surface chemistries, in terms of non-mobile/mobile fraction, self-diffusion coefficient, residence time, confining radius, local relaxation time, and their temperature dependence. Importantly, it demonstrates that the strength of the water/surface interaction determines the long-time tail of the dynamics, which we attributed to the translational diffusion of interfacial molecules, while the water dynamics in the pore center is barely affected by the interface hydrophilicity.3
INTRODUCTION
Liquid water is ubiquitous in nature and plays a central role in many applications related to energy and environment. It is noteworthy that in many situations, water is not present as a bulk liquid phase, but rather as a thin interfacial film or as a fluid embedded in a micro-/mesoporous medium. Interestingly, the specific properties of this nanoconfined situation determine the role played by water in many different fields, encompassing the biological activity of proteins,1, 2 transport through membranes (including biological cells or membranes for proton exchange fuel cells or nanofluidics, nanofiltration/desalinization technology)3-6 and environments of geological relevance.7-9
Mesoporous silica has been extensively used as a model system to study the dynamics of liquid water in spatially confined geometry.10 Along with other methods such as nuclear magnetic resonance (NMR),11-13 dielectric spectroscopy,12, 14 or molecular simulation,15-17 quasielastic neutron scattering (QENS) has been widely used because it provides a unique viewpoint on the molecular dynamics at the exact space and time scales, which are relevant to nanoconfined liquids (i.e. a few 0.1-1 nm, 0.1-10 ns).18-26 In general, these studies have revealed a reduction of the water diffusivity compared to the bulk counterpart, which becomes more prominent the smaller the pore size is.
The pioneering studies performed in the mid-90’s used Vycor glass.18 Although the distinction between the surface dynamics and that of the in-pore liquid has been addressed by tuning the filling fraction, additional difficulty stemmed from the interconnected character of the Vycor porosity. The advent of mesostructured porous silica phases, such as MCM-41 and SBA-15, has allowed studying liquid water in well-defined geometry in terms of straight and parallel nanochannels with
4
tunable diameter.20, 21 These studies made a distinction between two populations of molecules: the water molecules located in the vicinity of the pore walls are immobile or much slower than those located in the inner part of the pores. In addition to this bimodal description, the possible existence of non-exponential relaxations was also discussed and modelled by stretched exponential functions. This approach was intended either to reflect the intrinsic distribution of relaxation times in the liquid dynamics or to reveal the spatially heterogeneous nature of confined fluids.19, 21, 22
While MCM-41 and SBA-15 provided adjustable pore size,20, 26 the evaluation of the effect of surface interaction on the water dynamics was limited due to the unchanged chemical composition of hydrophilic silicas. This issue was addressed by studies, which aimed at disentangling the respective roles of surface interaction and purely geometric effects. Hydrophobic nanopores formed by carbon pores,27, 28 hydrophobically modified MCM-41,23 and organosilica phases25 were used to weaken the surface/water interaction. The other limiting case of ultra-strong interaction was illustrated by the ability of Zr−OH and Al−OH terminated MCM-41 surfaces to immobilize
water molecules.24 A recent study focused on the surface dynamics of water measured at very low coverage fraction of SBA-15 revealed that the non-diffusing fraction of water molecules was involved in slow jump processes between sites that are spatially separated by up to 0.4 nm.29
From the above literature, it seems that the chemical nature of the surface of nanoporous materials can be envisioned as a parameter affecting the water dynamics. However, clear-cut conclusions from a comparison of the existing studies are limited by the diversity of instrumental conditions and fitted models. To better address this issue, the present study considers the interfacial mobility of nanoconfined water in the presence of a spatial modulation of the surface/water interaction. This confining condition is realized by using a series of periodic mesoporous silicas (MCM-41)30, 31 and organosilicas (PMOs).32-34 These ideal host matrices are formed by a regular
5
triangular lattice of parallel and cylindrical channels, conforming a honeycomb structure. The pore walls of MCM-41 are uniformly formed by silica units with surface H-bond forming silanol groups, serving as a reference hydrophilic matrix. PMOs consist of hydrophobic and (weakly or highly) hydrophilic units, which are alternating along the main pore axis. This is achieved by the introduction of bridging organic units within the silica framework. The molecular-scale periodicity of the arrangement of organic/silica units along the pore axis is demonstrated by (00l) Bragg reflections. Together with the hydrophilic reference pure silica MCM-41, three PMOs comprising different organic bridging units were studied, as illustrated in Table 1 and in Fig. S1. They contain biphenyl (BP-PMO), divinyl-benzene (DVB-PMO), and divinyl-aniline (DVA-PMO) organic bridges, respectively. The four different matrices present comparable mean pore diameters with values between 3.5 and 4.1 nm as detailed in the materials and methods part (Table 1). However, one expects variations in their surface polarity and tendency to form H-bonds, as indicated by water physisorption35 and multidimensional solid-state NMR spectroscopy studies.33 Two properties that control the surface hydrophilicity of PMOs have been identified in previous studies. First is the length of the organic bridges that act as spacers between H-bonding silica units. For two PMOs formed by hydrophobic bridging units of different lengths (i.e. benzene and divinylbenzene), it was shown that the surface of the former porous material (B-PMO) was more hydrophilic than the later (DVB-PMO).35 This was inferred by the lower amount of adsorbed water below capillary condensation and the shift of water pore condensation to higher relative pressure for DVB-PMO. These two phenomena were then used by Mietner et al. as parameters to sort the surface hydrophilicity of series of PMOs matrices, carefully selected based on the similarity of their N2 isotherms so that the differences in water adsorption isotherms could be related to surface interaction and not influenced by differences in the size of their pores.36 A second property that controls the hydrophilicity of PMOs is the capability of the bridging unit to form H-bonds. This
6
phenomenon was observed for DVA-PMO, which presents larger hydrophilicity than BP-PMO due to the tendency of its amino group to form H-bonds with water.33 2D 1H-29Si and 1H-13C HETCOR NMR experiments showed strong interaction between the adsorbed water and the silicate part of the pore surface for both PMOs.33 Moreover, additional NMR cross peaks revealed that water also closely interacts with the organic unit for DVA-PMO, which is in contrast to BP-PMO that cannot form H-bonds. Therefore, these systems are well-suited to study the effect of tuning the water/surface interaction from hydrophilic to more hydrophobic by comparing results obtained for DVA-PMO and MCM-41 with respect to DVB-PMO and BP-PMO.
It was recently demonstrated in a pulsed field gradient (PFG) NMR study that the water transport in PMOs actually depends on their chemistry.34 This method probes the molecule displacements in
the m-range. As a result, the diffusivities were found to be primarily determined by the macroscopic textural properties of the mesoporous particles. Although significant for technological applications, the determination of long-distance transport leaves unanswered questions about the dynamics of water within the pores.
Quasielastic neutron scattering (QENS) is a unique method to resolve the spatio-temporal correlations of water molecule on a timescale ranging from a few picoseconds to a few nanoseconds, and at the nanometer length scale; that is to say a few times smaller than the characteristic distances defined by the pore diameter (in the range 3.5 to 4.1 nm) and by the period of modulation of the surface interaction (about 1.2 nm). We performed incoherent QENS experiments combining two spectrometers: the high flux time-of-flight spectrometer IN5B (ILL, Grenoble) and the high-resolution backscattering spectrometer IN16B (ILL, Grenoble), with
respective energy resolution (FWHM) 22 eV and 0.75 eV, thus providing complementary
7
study demonstrates that the dynamics of confined liquid water can be interpreted by the coexistence of two populations, comprising frozen and mobile molecules on the instrument timescale. We modelled the dynamics of the mobile fraction with two independent relaxations, corresponding to local fast motions and translational jump diffusion. As such, this model conforms to the latest description adopted for bulk water,37 that was yet to be applied for confined systems. Thanks to the fine control of the surface chemistry of the MCM-41 silica and the three different PMOs, the present work provides a rigorous assessment of the relative role of spatial confinement and surface interaction on the dynamics of confined water. On the one hand, the translational diffusion of interfacial molecules, which is detected in the QENS intensity in the region of small energy transfer, demonstrates a dependence on the surface hydrophilicity. On the other hand, despite clear evidence of confinement effects, this study also concludes on the limited impact of surface chemistry on the dynamics of water molecules located in the center of pores with sizes of 3.5 nm and larger. This conclusion can be reached after a fine and systematic comparison of the dynamic parameters of comparable systems studied under the same conditions.
8
METHODS
Samples
PMO powders were prepared according to the following procedure. NaOH and the alkyltrimethylammonium bromide surfactant were dissolved in deionized water. The bis-silylated precursors of the form (EtO)3Si− R−Si(OEt)3 (R = organic bridging unit) were added at room temperature and the mixtures were stirred for 20 hours. The mixtures were transferred into a Teflon-lined steel autoclave and statically heated to 95 °C or 100 °C for 24 h. The resultant precipitate was collected by filtration and washed with 200 mL deionized water. After drying at 60 °C, the powder was extracted with a mixture of ethanol and hydrochloric acid (EtOH:HCl (37 %), 97:3, v/v) using a Soxhlet extractor. The porosity and the pore structure of the dried materials were characterized by powder X-ray diffraction (PXRD) and nitrogen physisorption.34 In this work, we used three different PMO materials with different bridging groups: biphenyl BP-PMO, divinylbenzene DVB-PMO and divinylaniline DVA-PMO. The three bridging units have comparable sizes, which implies that the repetition distances of silica/organic units along the pore axis, as measured by PXRD, are all identical and equal to 1.2 nm, within 1% (cf. Table 1).
The mesoporous materials MCM-41 silicates were prepared in our laboratory according to a procedure similar to that described elsewhere31 and already used in previous works.38-42 Hexadecyl ammonium bromide was used as template to get a mesostructured triangular array of aligned channels with mean pore diameter D = 3.65 nm, as confirmed by nitrogen physisorption, transmission electron microscopy (TEM) and neutron diffraction.
The structural parameters of all the matrices are summarized in Table 1. They are comparable, although not exactly the same as those of samples used in previous studies.33, 34
9
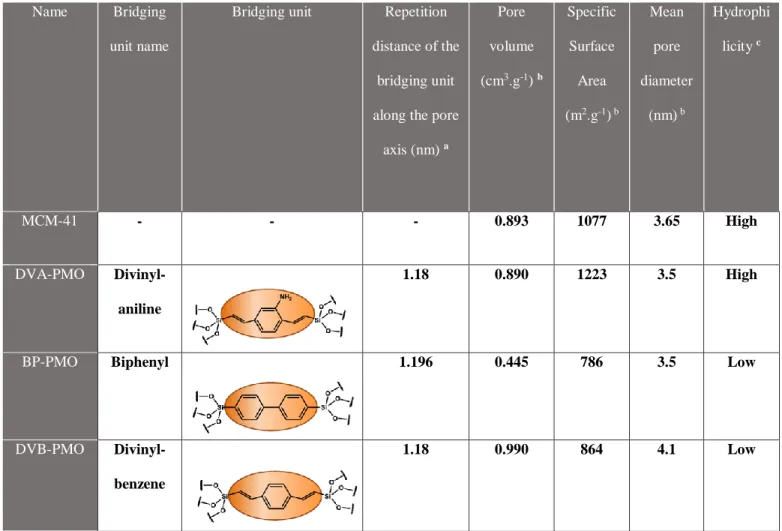
Table 1. Structural parameters of the mesoporous matrices. They are sorted from top to bottom in the order of decreasing surface hydrophilicity, according to the water sorption analysis by Mietner, performed for a series of matrices with the same surface chemistry but a unique mean pore diameter 3.2 nm.36
Name Bridging unit name
Bridging unit Repetition distance of the
bridging unit along the pore
axis (nm) a Pore volume (cm3.g-1) b Specific Surface Area (m2.g-1) b Mean pore diameter (nm) b Hydrophi licity c MCM-41 - - - 0.893 1077 3.65 High DVA-PMO Divinyl-aniline 1.18 0.890 1223 3.5 High
BP-PMO Biphenyl 1.196 0.445 786 3.5 Low
DVB-PMO Divinyl-benzene
1.18 0.990 864 4.1 Low
a: evaluated from the (00l) Bragg reflections. b: evaluated from the nitrogen physisorption
isotherms. c: according to the water sorption analysis by Mietner et al., performed for a series of similar matrices with the same surface chemistry but a unique mean pore diameter 3.2 nm.36
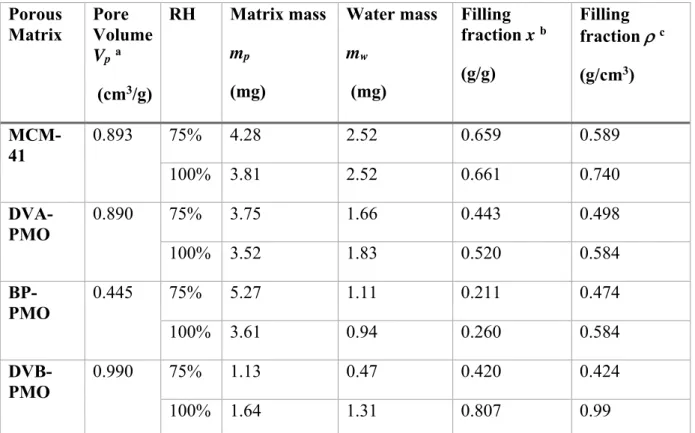
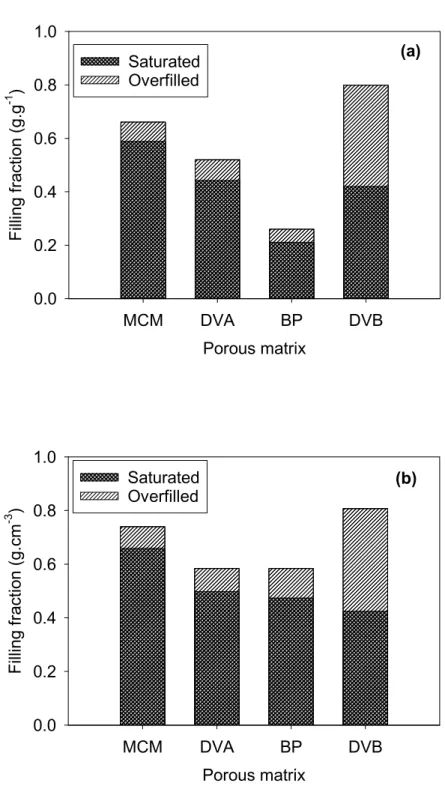
All matrices were dried at 120 °C under a primary vacuum. To prepare hydrated matrices, a constant amount of mesoporous materials was charged in a flat alumina rectangular cell (1 mm of thickness) and placed in a desiccator in the presence of a beaker containing a saturated aqueous
10
solution of NaCl. The resulting relative humidity (RH) of 75% at 25 °C was above the partial pressure of the capillary condensation33 and allowed the complete filling of the pore system. The sample was kept in the atmosphere of constant humidity for 24 h to ensure that an equilibrium condition is reached. The cells were sealed with an indium wire to avoid water loss and ensure a constant hydration level during neutron scattering experiments. We also conducted differential scanning calorimetry (DSC) experiments on capillary filled samples that were saturated with water at the same RH, as detailed in the Supporting Information. These measurements have confirmed that this filling procedure led to the capillary filling of the pores with no detectable bulk excess water outside the porous matrix. They provided a more accurate determination of the resulting water mass fraction. A second set of samples filled at a RH of 100% was used to determine an upper limit of the water mass fraction at which overfilling occurs. Finally, we could also conclude on the absence of crystallization in the temperature range used for QENS experiments.
QENS experiments
Quasielastic neutron scattering experiments were carried out using two spectrometers with different energy resolutions at the Institut Laue Langevin (ILL, Grenoble, France).43, 44 The disc chopper time-of-flight spectrometer IN5B was used with an incident wavelength of 8 Å. In this
configuration, the resulting energy resolution E around the elastic peak is about 22 µeV (FWHM),
corresponding to a timescale (t=E/ħ) of about 30 ps. The quasielastic signal retained for the data evaluation covered an energy range (E=ħ) between -5.0 and 0.7 meV and a Q range between 0.2 and 1.3 Å−1. The high-resolution IN16B spectrometer was chosen with unpolished Si (111) monochromator and analyzers in backscattering geometry, which corresponds to an incident wavelength of 6.271 Å and results in an energy resolution of 0.75 µeV and a corresponding
11
timescale of about 1 ns. The energy range was ±30 µeV with a Q range between 0.19 and 1.83 Å−1. The background chopper of the instrument was run in its high signal-to-noise mode.45 A cryofurnace and an ILL orange cryostat, were used on IN16B and IN5B spectrometers in order to regulate the sample temperature. The measurements were performed after thermal equilibration at regularly spaced temperatures, which were reached sequentially on cooling (300, 278, 258 and 243 K on IN5B, and 278, 258 and 243 K on IN16B) with dried and water filled samples. The four different matrices were studied on IN5B, and three of them on IN16B (MCM-41, DVB-PMO, and DVA-PMO).
Standard data corrections were applied using the packages MANTID46 and LAMP47 provided at the ILL. The experimental intensity was corrected for detector efficiency, for the background contribution arising from the empty cell and spectrometer, and transformed into the Q and energy dependent scattering function S(Q,ω). The fitting of scattering functions S(Q,ω) in the frequency domain was carried out using the QENSH program provided by the Laboratoire Léon Brillouin (LLB, Saclay, France).
RESULTS and DISCUSSSION
Data modelling
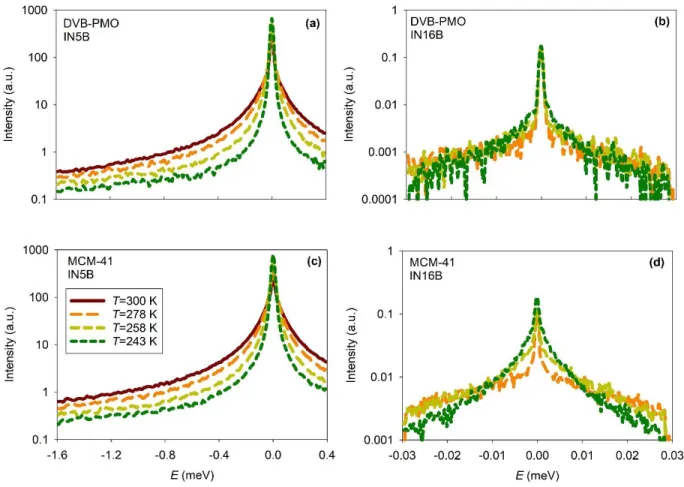
The QENS spectra of water filled DVB-PMO and MCM-41 are shown in Fig. 1 and Fig. 2. Qualitatively similar results were obtained for water confined in the other matrices (Fig. S4 and Fig. S5). The temperature dependence of the scattering intensity is illustrated in Fig. 1 for the selected value of the transfer of momentum Q = 0.8-0.85 Å-1. We observed a quasielastic
broadening that covered a typical energy range from about 0.1 to 1 meV on IN5B and 30 eV on
12
atoms, this quasielastic signal is attributed to the self-part of the dynamic structure factor S(Q,). Thus, it provides information on the single particle dynamics of water molecules. A continuous sharpening of the quasielastic peak was observed on decreasing the temperature from 300 K to 243 K. On a qualitative level, the width of the quasielastic scattering is inversely proportional to the typical timescale of motion of particles. Therefore, this sharpening indicates that the water dynamics slows down gradually on cooling. The absence of a sharp increase of the elastic signal confirms that water remained liquid on the entire studied temperature range. It allows excluding the hypothetical presence of water outside the pores and the crystallization of in-pore water, which is in agreement with the DSC results. The Q-dependence of the scattering intensity is illustrated in Fig. 2 for IN5B at the temperature T = 278 K. On increasing Q, we observed a significant reduction of the intensity contained in the elastic resolution (about a factor of ten) combined with a broadening of the quasielastic line. This Q-dependence probably arises from the combination of different effects, which are classically observed in QENS studies of liquids. It includes the effect of dispersive modes (e.g. translational diffusion) and the modulation of the elastic intensity due to vibrations (Debye Waller factor) or local quasielastic relaxations (e.g. rotation, libration), which comprise an elastic incoherent structure factor (EISF).
13
FIG. 1. Temperature dependence of the scattering intensity of water filled DVB-PMO (upper panels a, b) and water filled MCM-41 (lower panels c, d). QENS spectra measured on IN5B at Q = 0.8 Å-1 (left panels a, c) and on IN16B at Q = 0.85 Å-1 (right panels b, d).
14
FIG. 2. Q-dependence of the scattering intensity measured on IN5B at the temperature T = 278 K of water filled DVB-PMO (left panel a) and water filled MCM-41 (right panel b).
All spectra were fitted individually at each Q with a model comprising one elastic component, i.e. a Dirac function 𝛿(𝜔), and a quasielastic contribution, which was approximated by one (IN16B) or a sum of two (IN5B) Lorentzian functions, as described in SI. The essentially elastic contribution arising from the pore wall atoms was accounted for by adding the scattered experimental intensity of the empty matrices to the theoretical functions, which were fitted to the experimental spectra of the water filled matrices. This means that the fitted Dirac function can be actually ascribed to an elastic contribution of water molecules. Following the assignment made in recent studies of bulk water, we related the broad and sharp quasielastic components to two distinct dynamics: local motion (L) and translational diffusion (T), respectively.37, 48 It is likely that only the slowest one, attributed to translation, was actually detected on IN16B. In fact, the broad quasielastic contribution arising from local dynamics likely appeared as a vanishing flat background, due to the reduced energy range covered by the high-resolution instrument. Therefore, the incoherent dynamic structure factor of water writes as:
𝑆(𝑄, 𝜔) = 𝐾 [𝐴𝑇(𝑄)𝛿(𝜔) + (1 − 𝐴𝑇(𝑄))𝐿𝑇(𝑄, 𝜔, Γ𝑇)]⨂[𝐴𝐿(𝑄)𝛿(𝜔) + (1 − 𝐴𝐿(𝑄)) 𝐿𝐿(𝑄, 𝜔, Γ𝐿)] (3)
where K is a scaling factor comprising the attenuation of the scattering intensity due to inelastic vibrational modes (Debye-Waller factor). The functions 𝐴𝑇(𝑄) and 𝐴𝐿(𝑄) are the elastic incoherent structure factors (EISFs) of the translational and local motions.49 Their respective linewidth Γ𝑇 and Γ𝐿 were effectively separable since they differ by a factor of 7-10. These quantities
15
were evaluated from the fitted parameters introduced in Eqs. (1) and (2) after straightforward calculations, and considering that Γ𝑇 ≪ Γ𝐿.
Local water dynamics
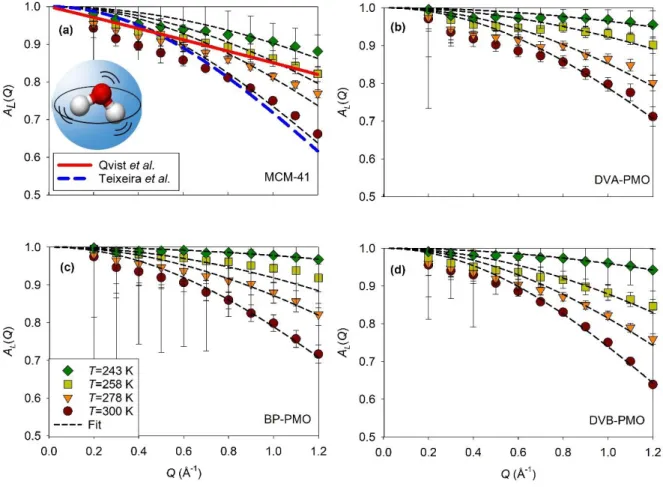
The experimental EISFs 𝐴𝐿(𝑄) obtained from the fitting of Eq. (3) are illustrated in Fig. 3. They
present an important elastic contribution, which is above 60% at 300 K and 95% at 243 K on the studied Q-range. It demonstrates the non-diffusive (i.e. localized) character of this motion. In the classical approach of Teixeira et al.50 this dynamics was described as an isotropic rotation of
hydrogens around the oxygen atom. The corresponding EISF writes as 𝐴𝑅(𝑄) = [𝑗0(𝑄𝑅𝑅)]2, where j0 is the zeroth-order spherical Bessel function and 𝑅𝑅 = 0.98 Å for the O-H bong length.49 A comparison of the prediction from the classical approach with the EISFs 𝐴𝐿(𝑄) determined experimentally for water in MCM-41 is illustrated Fig. 3(a). Only at 300 K, the standard model agreed well with the experiments. However, this model was unable to describe the increase of intensity observed at lower temperature. Satisfactory fits could still be obtained with the same functional form 𝐴𝑅(𝑄), provided that RR was allowed to vary with the temperature. When
considered as a free fit parameter, the value of RR decreased with decreasing temperature. It reached
values as small as 0.5 Å, which cannot be related to the O-H bond length anymore. In that sense, the model lost its physical meaning. Another approach that maintains the classical interpretation of 𝐴𝐿(𝑄) consists in adding a supplement Q-independent elastic term to the isotropic rotation function 𝐴𝑅(𝑄) (i.e. 𝐴𝐿(𝑄) = 𝑝𝛿(𝜔) + (1 − 𝑝)𝐴𝑅(𝑄)). From this viewpoint, it would imply that a fraction
p of the water molecules does not perform rotation on the instrumental timescale due to
confinement and interfacial restrictions. At 300 K, such an additional elastic peak was not required to best fit the data, meaning that all the molecules were dynamically active. However, this alternative model led to a large elastic component at sub-ambient temperature, reaching up to 80%
16
at the lowest temperature. It is unlikely that the rotational diffusion would be frozen for such a large fraction of molecules, while it would be active and very fast (i.e. about 1-3 ps) for the unfrozen ones. It is also inconsistent with the analysis of the translational diffusion detailed in the next section, where much smaller fractions of dynamically frozen molecules were obtained. Our results rather suggest that this broad quasielastic line does not strictly correspond to isotropic rotational diffusion. This conclusion appears in line with an alternative view proposed by Qvist et al. for bulk water.37 This motion was attributed to a local dynamical “intra-basin” relaxation, also observed in
the water molecules trajectories of Molecular Dynamics (MD) simulations. A comparison is made in Fig. 3(a) with the polynomial fit of the bulk water data.37 It is similar to the EISFs that we measured at 258 K. A univocal determination of the geometry of this local relaxation is elusive, as also discussed for bulk water by Arbe et al.48 However, based on a Debye-Waller factor type of analysis, we can conclude on the gradual shrinkage of the mean-squared-amplitude of the local motion on decreasing the temperature for confined water.
17
FIG. 3. Elastic incoherent structure factor of the local quasielastic relaxation (symbols) deduced from IN5B measurements at four different temperatures of water confined in different matrices (a) MCM-41, (b) DVA-PMO, (c) BP-PMO, and (d) DVB-PMO. Two different approaches describing the broadest quasielastic relaxation of bulk water are presented for comparison in the panel (a): (solid line) model-free EISF of the local relaxation averaged over 6 temperatures in the range 253-293 K, after Qvist et al.37 and (long dashed line) the EISF of the continuous molecule rotation supposed independent on the temperature for the same temperature range after Teixeira et al.50 Inset of panel (a): sketch of the local motion of water.
18
On the entire temperature range studied, the relaxation time L attributed to the local motion of water varied from 1 to 3 ps. These values are within the range of relaxation times reported for bulk water (1 to 3.5 ps) on a slightly reduced temperature range.37 The effect of the matrix can be estimated from a comparison of the EISFs measured for water confined in MCM-41 (cf. Fig. 3(a)) and the three PMOs (cf. Figs. 3(b-d)). If present, the difference between the EISFs is very small and hardly resolved within experimental uncertainties. The temperature dependence of the relaxation time of water confined in the four different matrices was also very similar, with an averaged value of the activation energy of 10 ± 4 kJ·mol-1. The previous QENS studies of confined water were often limited to translational diffusion and results about the fast local dynamics are scarcer in the literature. To the best of our knowledge, there exists only one available QENS measurement of water confined in a benzene-bridged PMO by Aso et al.25 In this study, the authors concluded on a significant slowdown (by a factor of three) of the local dynamics of water confined in MCM-41, with respect to those of water confined in the PMO and bulk water. We note that the comparison with this PMO’s result was based on an older QENS measurement of water confined
in MCM-41,20 which was moreover performed at two different temperatures. On the contrary, our conclusions are based on a single study, with measurements performed systematically under the same experimental conditions. Under these conditions, our results rather point towards a comparable fast local dynamics of water when confined in PMOs or in MCM-41. It is also worth mentioning that this conclusion is in line with the pioneering study of water in Vycor, which concluded that the fast QENS relaxation denoted as ‘hydrogen-bond lifetime’ was very close to the
bulk one, both for fully and partly hydrated systems.18
19
Translational water dynamics – neutron time-of-flight study
The sharpest quasielastic component detected on IN5B was attributed to the translational diffusion of the molecules’ center of mass. However, we noticed that this intensity also contained
a purely elastic component, as illustrated in Fig. 4. The existence of an EISF associated to this component, of which the intensity was dependent on both the temperature and the momentum transfer Q, is inconsistent with long range translation diffusion. The EISFs were fitted with a model that incorporate a fraction p of non-mobile molecules (i.e. dynamically frozen on the timescale of the instrument) and a fraction (1-p) of molecules performing restricted translational diffusion in a sphere.49, 51
20
FIG. 4. Elastic incoherent structure factor of the first quasielastic relaxation (symbols) deduced from IN5B measurements at four different temperatures of water confined in different matrices (a) MCM-41, (b) DVA-PMO, (c) BP-PMO, and (d) DVB-PMO. Fits with a model of translation diffusion confined in a sphere (lines). Inset of panel (a): sketch of the confined jump diffusion motion of water.
The corresponding expression of 𝐴𝑇(𝑄) is
𝐴𝑇(𝑄) = 𝑝𝛿(𝜔) + (1 − 𝑝) [3𝑗1(𝑄𝑅𝑇)
𝑄𝑅𝑇 ] 2
(4)
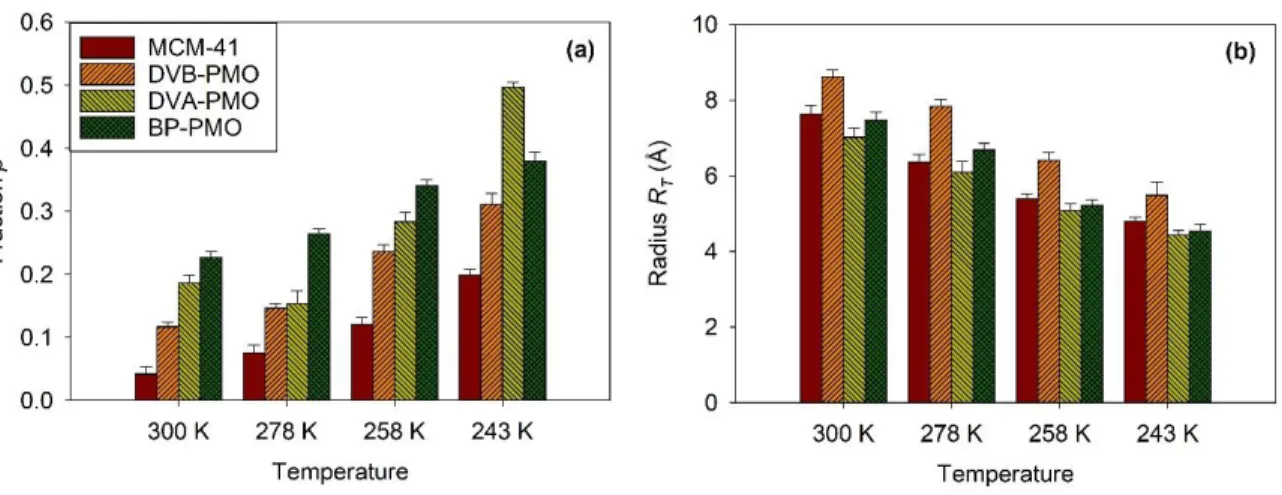
where RT is the radius of the confining sphere, p the fraction of non-mobile molecules, and j1 is the first-order spherical Bessel function. This model could reproduce the experimental EISFs quantitatively, as illustrated by dashed lines in Fig. 4. However, the parameters obtained at the lowest temperatures (T = 243 K) presented large uncertainties, which was due to difficulties in separating the sharpest quasielastic component from a pure elastic one within the energy resolution of IN5B. The two fitted parameters p and RT showed a systematic temperature dependence as can
be inferred from Fig. 5. A systematic increase of p with decreasing temperature reflects the larger number of dynamically frozen molecules on cooling. It is about 10-20% at 300 K, and reaches values as large as 40-50% at 243 K. We also noticed a dependence of p on the confining matrix (cf. Fig. 5(a)). The smallest value of p was obtained for the purely siliceous matrix MCM-41. It corresponds to half the value obtained for BP-PMO that comprises hydrophobic bridging. At first sight, this feature appears counterintuitive. Indeed, MCM-41 has a larger surface density of silanol groups that may act as adsorbing sites, thus reducing the translational motion of water. On the other hand, the barrier of activation related to the molecule jump from one surface site to an adjacent site can be reduced when the surface presents a homogeneous distribution of equivalent silica units
21
such as for MCM-41. For PMOs instead, the alternation of hydrophobic and hydrophilic sites might interrupt the surface diffusion of water. This reasoning should be moderated for hydrophilic DVA-PMO, considering that the amino groups also act as H-bonding sites, as shown by NMR.33 The distance between NH2 and silanols that is estimated to be a bit less than half of the repetition distance (i.e. 5 Å) is still too large to allow a direct interaction of a water molecule with both sites. We believe that this issue needs additional support from other methods, such as molecular simulation.
FIG. 5. Variation with the temperature and the confining matrix of the parameters obtained from the fit of the EISF of the translational diffusion (from IN5B measurements). (a) Fraction p of dynamically frozen water molecules. (b) Radius RT of the sphere confining the translational
diffusion.
The radius RT of the sphere confining the translational diffusion of the fraction (1-p) of mobile
molecules decreases from 9 to 5 Å, during cooling from 300 to 243 K (cf. Fig. 5(b)). The spatial restriction of the translational displacements on cooling is similar to the observation made for the local dynamics in the previous part in that it is decreasing. The values of RT spanned from one
22
the pore itself. However, a correlation between RT and Rpore is suggested by the systematically
larger values of RT for DVB-PMO, which pore size is 15% larger than for the three other matrices
(cf. Table 1). This indicates a possible link between RT and geometrical aspects of confinement.
Moreover, the role of surface effects can be invoked. Indeed, the fraction p of non-mobile molecules could be also taken into account as a secondary source of confinement. For simplicity, it can be assumed that these molecules are forming a homogeneous layer located at the interface with the pore wall. In this case, the radius 𝑅𝑐𝑜𝑟𝑒 of the core region of the pore, where the mobile
water molecules are located, is 𝑅𝑐𝑜𝑟𝑒 = 𝑅𝑝𝑜𝑟𝑒√(1 − 𝑝). Using the experimental values of p and 𝑅𝑝𝑜𝑟𝑒 from Table 1, we obtained that 𝑅𝑐𝑜𝑟𝑒 varies from 19 to 12.5 Å as a function of the matrix
and the temperature, which is about twice the value of RT. Interestingly, the thickness of the
non-mobile layer (i.e. 𝑒𝑛𝑜𝑛−𝑚𝑜𝑏 = 𝑅𝑝𝑜𝑟𝑒− 𝑅𝑐𝑜𝑟𝑒) is in the range 1-5 Å, and is maximum at the lowest
studied temperature 243 K, before crystallization occurs. It compares reasonably with the thickness of the non-crystalizing layer (t = 6 Å) evaluated by cryoporometry for water confined in MCM-41 and SBA-15 porous silicates, 52, 53 as well as with the thickness of the immobile, sticky layer inferred from capillary rise experiments for water in hydrophilic silica pores (Vycor).54
23
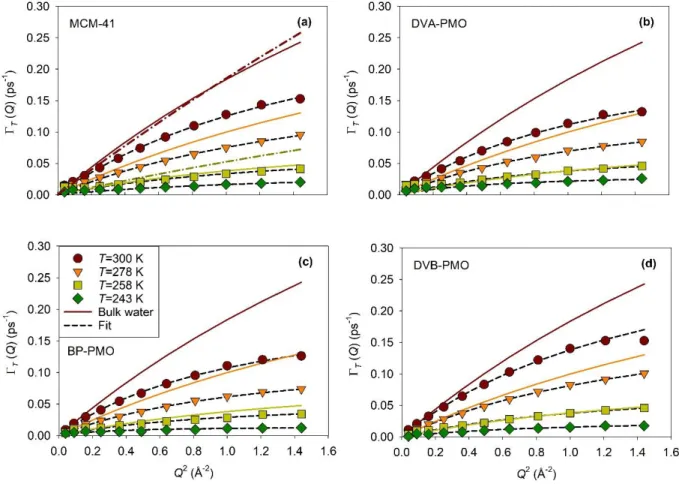
FIG. 6. Evolutions of the half width at half-maximumT of the sharp Lorentzian as a function
of Q2 obtained from the fitting of QENS spectra measured on IN5B for water confined in the four matrices (a) MCM-41, (b) DVA-PMO, (c) BP-PMO, and (d) DVB-PMO at four temperatures (filled symbols). Fit using the jump diffusion model (thin dashed lines). Bulk water experimental results at three temperatures, from top to bottom 300 K, 278 K, and 258 K (solid lines) from Teixeira et al. 50 In panel (a), bulk water experimental results at 293.4 K, and 257.8 K (dashed dotted line) from Qvist et al.37
After the discussion of the EISFs, we address now the corresponding quasielastic part, which contains dynamical information about the fraction (1-p) of mobile molecules. The linewidth of the
24
squared momentum transfer. The different panels correspond to the four different matrices, and the different curves illustrate different temperatures. The experimental results for bulk water are also illustrated for comparison. Only two curves from Qvist et al.37 are presented in Fig. 6a, because, unlike for the study by Teixeira et al. 50, the selection of temperatures was different from the one
used the present work. At intermediate Qs, T increases linearly with Q2, which conforms the
normal Fick’s law of translational diffusion. However, deviations occur both at small and large Qs.
When Q tends to zero, T does not really vanish but rather saturates towards a finite value, as
illustrated in Fig. S7 for MCM-41. This feature can be explained as resulting from the confined character of the translational diffusion, which was demonstrated above from the analysis of the EISFs. In the frame of the model of confined diffusion in a sphere, it was predicted by Volino et
al.51 that
T should deviate from the Fick law at 𝑄 ≈ 3.3
𝑅𝑇 towards a plateau value 𝑇 =
4.33 𝐷𝑇 𝑅𝑇2 . The
measured linewidths are in fair agreement with this prediction, as illustrated in Fig. S7 by the shaded areas. At large Qs, T bends and tends asymptotically towards a constant value denoted1/0
(Fig. 6). In fact, the Fickian diffusion model assumes a continuous motion process. Deviation from this assumption is observed when considering small displacements (i.e. for Q larger than the inverse particle distance), where a discontinuous mechanism is related to the finite molecular size and the local order in the liquid. The linewidth was modelled by the well-known jump-diffusion model, which assumes that the translation motion proceeds by successive elementary jumps (thin dashed lines in Fig. 6).49, 55 Between two jumps, the particle remains localized for a typical residence time 0 on a molecular site, with a spatial extension limited to the amplitude of vibrational modes.
Applying the usual assumptions that the jump can be regarded as instantaneous with respect to the residence time 0 spent by the particle on a site, and that the jump length l is much larger than the
25 𝑇(𝑄) = 𝐷𝑇𝑄2
1+𝜏0𝐷𝑇𝑄2 (5)
where DT is the diffusion coefficient and 0 the mean residence time.
These two parameters obtained for the four different matrices are illustrated in Fig. 7 as a function of the temperature in Arrhenius coordinates. The bulk values of DT and 0 determined from QENS
measurements,18, 50 and the diffusion coefficient measured by NMR56 are also added for comparison. The values of the diffusion coefficient for the four confined materials are, within about 10%, in good accordance with those of the bulk water. Deviations observed at high and low temperature could indicate that the activation energy is reduced in confinement, although the
difference remained in the limit of the data accuracy, especially at 243 K as T approaches the
instrumental resolution limit of IN5B. Significant differences between the confined and bulk water were obtained for the residence time 0. It is systematically larger in confinement than in the bulk
as illustrated in Fig. 7(b). At 300 K, the residence time is three to four times longer in the porous matrices. Moreover, the activation energy is smaller in confinement, so that the residence times of the different systems apparently approach the bulk system at lower temperature (243 K). It is worth
noting that both DT and 0 exhibit a curvature, which indicates a super-Arrhenius character as
usually observed in supercooled glass-forming liquids.57, 58 This is illustrated in Fig. 7(b) by the fit of the residence time with a Vogel-Fulcher-Tammann equation (dashed line). A mean jump length
l could be estimated by combining the diffusion coefficient and the residence time noting that 𝐷𝑇 = 〈𝑙2〉
6𝜏0. The obtained values of l were in the typical range from 0.65 to 1.2 Å for all the matrices with
26
FIG. 7. (a) Translational diffusion coefficient DT and (b) residence time 0 of water evaluated from
the fit of IN5B spectra with a jump-diffusion model for water confined in MCM-41 and three PMOs as a function of the inverse temperature. In panel a, the QENS data of bulk water are from Teixeira
et al.50 (stars) and the NMR diffusion coefficient from Price et al.56 (solid line). VTF fits of the residence time (dashed line in panel b).
A comparison with other QENS data obtained from the literature is given in Table 2. These experiments have been analyzed differently, and often the EISFs related to the fast local dynamics, the confined translation diffusion and the fraction of non-mobile molecules were not available simultaneously. Also, the temperature range was sometimes limited, which prevented a thorough comparison with our results. Bearing in mind these possible limitations, it is, however, possible to
compare the values of DT and 0 that were obtained from the quasielastic linewidth. Similar
conclusions can be made from these previous evaluations of DT, which values remain similar or
marginally smaller than that of the bulk water whenever the pore diameter is larger or equal to 3 nm. An enhanced slowdown of the translational dynamics is observed for a pore size smaller than 3 nm (Table 2).
27
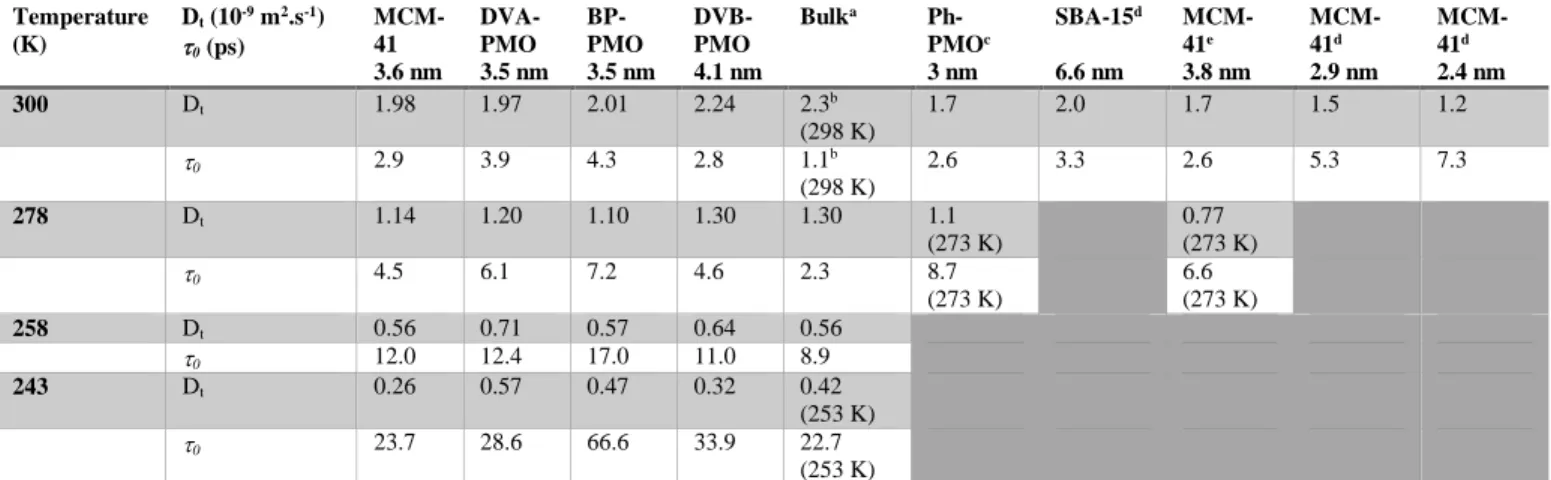
Table 2. Translation diffusion coefficientDT and the residence time 0 of the mobile fraction of
water molecules derived from the jump diffusion model. The results from the present study are compared with those from the literature.
Temperature (K) Dt (10-9 m2.s-1) 0 (ps) MCM-41 3.6 nm DVA-PMO 3.5 nm BP-PMO 3.5 nm DVB-PMO 4.1 nm Bulka Ph-PMOc 3 nm SBA-15d 6.6 nm MCM-41e 3.8 nm MCM-41d 2.9 nm MCM-41d 2.4 nm 300 Dt 1.98 1.97 2.01 2.24 2.3b (298 K) 1.7 2.0 1.7 1.5 1.2 0 2.9 3.9 4.3 2.8 1.1b (298 K) 2.6 3.3 2.6 5.3 7.3 278 Dt 1.14 1.20 1.10 1.30 1.30 1.1 (273 K) 0.77 (273 K) 0 4.5 6.1 7.2 4.6 2.3 8.7 (273 K) 6.6 (273 K) 258 Dt 0.56 0.71 0.57 0.64 0.56 0 12.0 12.4 17.0 11.0 8.9 243 Dt 0.26 0.57 0.47 0.32 0.42 (253 K) 0 23.7 28.6 66.6 33.9 22.7 (253 K)
a: data from Teixeira et al.50, b: data from Bellissent-Funel et al.18, c: data from Aso et al.25, d: data from Baum et
28
Interfacial translational water dynamics - high resolution neutron backscattering study
In the previous section, the translational dynamics of confined water has been discussed in terms of two populations: an interfacial layer of thickness 𝑒𝑛𝑜𝑛−𝑚𝑜𝑏 in the range 1-5 Å, with a highly reduced dynamics due to the interaction with the pore surface, and a liquid region at the pore center with a ‘bulk-like’ dynamics with moderate slowdown and marginal effect of the pore chemistry. It
is noteworthy that the interfacial dynamics is likely not frozen on a longer time scale. The fraction of molecules named ‘non-mobile’ rather corresponds to the long-time tail of the broad distribution
of dynamics.58 This simplified bimodal description is widely used to account for the dynamics that is slower than the cut-off introduced by the energy resolution of the instrument. To get a better insight on the dynamics of the interfacial molecules, which are expected to be more influenced by the nature of the water/surface interaction, we have used the higher resolution of the neutron backscattering spectrometer IN16B, i.e. 0.75 µeV compared to 22 µeV on IN5B. The resulting observable timescale is thus extended from about 30 ps to 1 ns. In the meantime, the dynamical range covered on IN16B is much reduced, which means that the broad quasielastic intensity shown for IN5B is mostly hidden in the background on IN16B (i.e. the local motion and possibly the fastest part of the translation).
29
FIG. 8. Evolutions of the half width at half-maximumT of the Lorentzian as a function of Q2
obtained from the fitting of QENS spectra measured on IN16B for confined water in the 3 matrices (a) MCM-41, (b) DVA-PMO, and (c) DVB-PMO at three temperatures 278 K, 258 K, and 243 K (filled symbols). Fits using the jump diffusion model (dashed lines).
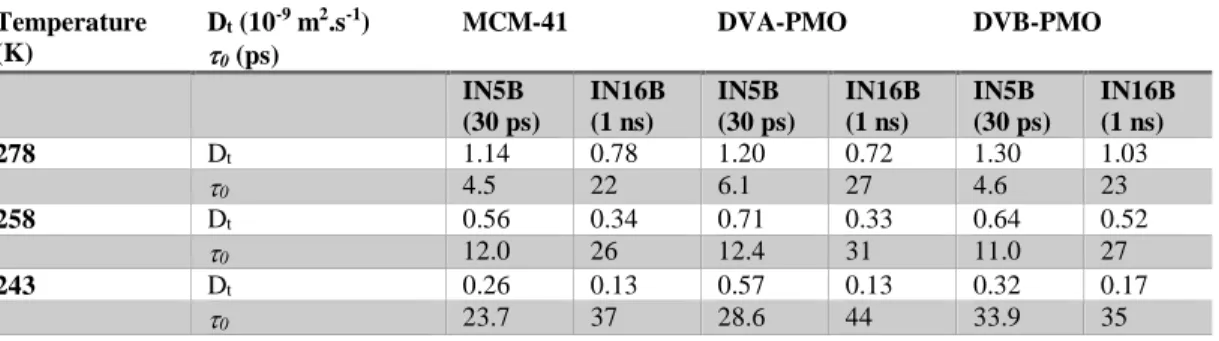
Table 3. Comparison of the translation diffusion coefficientDT and the residence time 0 of
water molecules derived from the jump diffusion model for two different experimental resolutions.
Temperature (K) Dt (10-9 m2.s-1) 0 (ps) MCM-41 DVA-PMO DVB-PMO IN5B (30 ps) IN16B (1 ns) IN5B (30 ps) IN16B (1 ns) IN5B (30 ps) IN16B (1 ns) 278 Dt 1.14 0.78 1.20 0.72 1.30 1.03 0 4.5 22 6.1 27 4.6 23 258 Dt 0.56 0.34 0.71 0.33 0.64 0.52 0 12.0 26 12.4 31 11.0 27 243 Dt 0.26 0.13 0.57 0.13 0.32 0.17 0 23.7 37 28.6 44 33.9 35
The linewidth of the quasielastic intensity measured on IN16B is illustrated in Fig. 8. It is proportional to the squared momentum transfer in the zero-Q limit, and gradually deviates from the Fickian diffusion regime at larger Q, as also seen on IN5B. In some cases, more markedly for water filled DVB-PMO at 278 K, one observed variations of the measured linewidth with respect to a smooth monotonous increase. They are attributed to statistical fluctuations, which are more visible at the highest temperature when the quasielastic broadening approaches the maximum
energy transfer on IN16B (30 eV corresponding to 0.045 ps-1), while the quasielastic intensity
increases and the statistical fluctuations vanish as the line sharpens at lower temperature. As for IN5B, the linewidth was fitted with a jump-diffusion model. The diffusion coefficients and residences times derived from these fits are illustrated in Fig. 9, and also given in Table 3. The
30
diffusion coefficient and the residence time of bulk water are added in Fig. 9, which recalls the presentation made in Fig. 7 for IN5B results. The diffusion coefficients measured on IN16B are systematically smaller (by a factor of 1.2 to 2) than those measured on IN5B for the same water filled matrices. Also, the residence times are longer. This confirms that the fraction of the water molecules, which was denoted as non-mobile on IN5B, comprises particles that actually diffuse but much more slowly. We inferred from IN5B results that the molecules performing ‘bulk-like’ spatially restricted motions, were located in the center of the pore. Accordingly, we relate the sharpest quasielastic contribution observed on IN16B to a slower diffusion process, which corresponds to molecules interacting with the interface of water filled matrices. Importantly, the diffusivity of these interfacial water molecules depends on the matrix chemistry. The largest reduction of translational mobility is obtained for the two hydrophilic matrices (MCM-41 and DVA-PMO). For purely siliceous MCM-41, this slowdown of the diffusion of interfacial water molecules is classically attributed to the formation of H-bonds between water and silanols. For DVA-PMO, silanol adsorption sites are dispersed on the pore surface due to the bridging organic units that impose a separation distance of 1.2 nm between silica units in the direction parallel to the pore axis. However, this effect is balanced by the presence of amino groups between silica units, which act as secondary H-bonding sites for interfacial water molecules. This is supported by the observation by NMR of strong interfacial correlations between water, and both silica and organic units.33
For water filled DVB-PMO, intermediate values of the diffusivity that stand between the bulk and the hydrophilic confinement situation are observed. Again, this points to an effect of the dilution of silica units, which are regularly spaced every 1.2 nm along the pore channel axis. Unlike DVA-PMO, this reduction of the number of H-bonding silanol groups is not counterbalanced by
31
the DVB organic spacers that have no polar groups and cannot act as secondary adsorbing sites. This interpretation is in line with the observation of depleted regions in the vicinity of the aprotic organic bridging units.33
As a whole, the relation between surface chemistry and interfacial layer mobility, although studied for a limited number of materials, agrees with the evaluation of the relative surface hydrophilicity made for series of PMOs and quantified in terms water capillary pressure and surface water coverage prior to capillary condensation.36
FIG. 9. (a) Translational diffusion coefficient DT and (b) residence time 0 of water evaluated from
the fit of IN16B spectra with a jump-diffusion model for water confined in MCM-41 and two PMOs as a function of the inverse temperature (symbols). In panel a, the NMR diffusion coefficient of bulk water from Price et al.56 (solid line). In panel b, the residence time of water confined in the same matrices fitted from IN5B spectra (dashed line) and the residence time of bulk water from Teixeira et al.50 (solid line)
32
Some important differences can be underlined from the comparison of the diffusivities obtained in the present QENS study and those derived from PFG NMR on similar samples.34 A greater reduction of the diffusivity with respect to bulk water was obtained in the latter case, as well as a larger dependence on the nature of the porous sample (by up to two orders of magnitude). The apparent disagreement between the diffusivities measured by the two methods is intriguing. As mentioned in the introduction part, the diffusivities measured by both methods are averaged on
very different molecular displacements (i.e. ~ 1 Å for QENS and ~ 1 m for PFG NMR). The latter
displacement exceeds notably the size of each individual porous grain. As thoroughly explained in this PFG NMR study, the obtained long-range diffusivities result from the migration of water molecules in the pores, but also on the outer surface of the porous grains and in the interparticle space. The transport behavior depends on the rate exchange between these different phases and their physical states (liquid or gaseous). Under the same filling conditions as those used in the QENS study (i.e. absence of liquid excess) and for loosely agglomerated particles (such as MCM-41), it was concluded that the average diffusivity Dav was barely related to the liquid phase Dl but
dominated by properties of the vapor phase with Dav=pvDv, where pv<<1 and Dv>>Dl are the
relative fraction and the diffusivity of water in the vapor phase. On the contrary, for agglomerated particles (such as DVA-PMO), or when an excess of bulk water has crystallized in the interparticle space, it was concluded that the long range transport of water molecules was occurring in a liquid thin film covering the external surface on the grains. In this case, the measured slow diffusive component was shown to be an effective value that depends on the macroscopic rather than nanoporous structure of the sample in terms of particle morphology and their agglomeration. On the contrary, the short-range diffusivities measured by QENS probe the transport of water molecules inside a single pore. As such, they are intrinsic properties of the confined liquid phase,
33
which were shown to be affected by the pore size, and the surface interaction. However, they bring no information on the macroscopic transport mechanisms of water across the porous materials, which is important in many natural processes and for technological applications where fluid flow and imbibition occur. In this sense, we emphasize that the combination of PFG NMR and QENS methods to study the dynamics of confined water in PMOs provides crucial information on the two sides of the same coin.
CONCLUSION
We performed a systematic QENS study of the dynamics of liquid water confined in mesoporous silica (MCM-41) and organosilicas (PMOs) with different surface chemistries in a temperature range spanning from 243 to 300 K. Two high-flux spectrometers with complementary energy resolution were combined so as to cover an extended dynamical range. Following recent recommendations made for bulk water, a model free analysis of the incoherent dynamic structure factor was applied for the first time to confined water. The analysis of IN5B results points towards the existence of two distinct dynamics: a fast local motion (typical time varying from 1 to 3 ps), which implies all the water molecules and translational diffusion dynamics attributable only to a fraction of molecules. The EISF of the former component is consistent with the isotropic rotational diffusion of the water molecule at 300 K. However, this interpretation is questioned at lower temperature. Based on the concept of intra-basin local relaxation introduced for bulk water, our result suggests a reduction of the spatial amplitude of this local motion on cooling. The second quasielastic relaxation is attributed to translational diffusion. It concerns only a fraction of mobile molecules, which are most probably located at the pore center. Deviations from the Fick’s law at large Qs were accounted by the jump-diffusion model and at low Qs by transient spatial restriction
34
‘bulk-like’ behavior. The slowing down of translational diffusion due to confinement is moderate.
It is within 10% for DT but it is more marked for 0 that is up to four times longer than for bulk water. The EISFs demonstrate that the translational diffusion is spatially restricted on the instrumental timescale, which differs from bulk water. The radius RT of the sphere confining the
translational diffusion of the mobile molecules decreases from 9 to 5 Å, during cooling from 300 to 243 K. It is not strictly related to the pore size itself. We consider that it rather emerges from the hindrance due to the surrounding molecules that are influenced by the pore interface. This is supported by the increase on cooling of the fraction p of molecules that are dynamically frozen (i.e. not diffusing on the timescale of IN5B), and that are most likely located at the interface. It is about 10-20% at 300 K, and reaches values as large as 40-50% at 243 K, which corresponds to a thickness of the ‘non-mobile’ layer in the range of 1-5 Å. This fraction also varies as a function of the nature
of the matrix, illustrating the effect of the surface interaction on the dynamics of the interfacial layer. Finally, our study using the high-resolution spectrometer (IN16B) demonstrates that interfacial molecules are dynamically active on a longer timescale (about 1 ns). Their motion could be described by a jump-diffusion model as well. However, the corresponding characteristic parameters DT and 0 demonstrate a significantly slower process than that of the liquid located in the pore center. Moreover, the diffusivity of interfacial water molecules shows dependence on the nature of the confining matrix. The largest slowdown is obtained for hydrophilic matrices (MCM-41 and DVA-PMO) with respect to the more hydrophobic one (DVB-PMO). As a whole, this study indicates that, on the ps-to-ns timescale and for a pore size of about 3.5 nm, the details of the water/surface interaction (i.e. matrix hydrophilicity, and presence of silanol or amino H-bonding sites) hardly affect the generic confinement effects that involve the water molecules located in the
35
core of the pore but they are important in determining the translational motion of the water molecules located at the interface.
ACKNOWLEDGEMENTS
This work was conducted in the frame of the DFG-ANR collaborative project (Project NanoLiquids N° ANR-18-CE92-0011-01, DFG: FR 1372/25-1 - Projektnummer 407319385, and DFG Hu850/11-1 - Projektnummer 407319385), which is expressly acknowledged. It is a pleasure to acknowledge the Institut Laue-Langevin for the allocation of neutron beam time.43, 44 This work is part of the Ph.D. thesis of A.J. who benefits from a grant from the French Ministry of Higher Education, Research, and Innovation.
DATA AVAILABILITY
Raw data were generated at the Institut Laue-Langevin (ILL) large scale facility. They will be available in the ILL Data Portal at DATA.6-07-34 and doi:10.5291/ILL-DATA.6-07-45 following an embargo period.43, 44 Derived data supporting the findings of this study are available from the corresponding author upon reasonable request.
SUPPLEMENTARY MATERIAL
Sample Filling: relation between RH and the water mass fraction
36
Temperature dependence of the QENS spectra measured on IN5B at Q = 0.8 Å-1 and on IN16B at Q = 0.85 Å-1 for water filled DVA-PMO and in BP-PMO.
Q-dependence of the QENS spectra measured on IN5B at the temperature T = 278 K for water
filled DVA-PMO and BP-PMO.
Fitting procedure of QENS spectra
Related references
REFERENCES
1. J. M. Zanotti, G. Gibrat and M. C. Bellissent-Funel, Physical Chemistry Chemical Physics 10 (32), 4865-4870 (2008).
2. B. Bagchi, Chemical Reviews 105 (9), 3197-3219 (2005).
3. L. Garnier, A. Szymczyk, P. Malfreyt and A. Ghoufi, Journal of Physical Chemistry Letters 7 (17), 3371-3376 (2016).
4. Q. Berrod, S. Lyonnard, A. Guillermo, J. Ollivier, B. Frick, A. Manseri, B. Ameduri and G. Gebel, Macromolecules 48 (17), 6166-6176 (2015).
5. N. Martinez, A. Morin, Q. Berrod, B. Frick, J. Ivier, L. Porcar, G. Gebel and S. Lyonnard, Journal of Physical Chemistry C 122 (2), 1103-1108 (2018).
6. L. Bocquet, Nature Materials 19 (3), 254-256 (2020).
7. J. Swenson, R. Bergman and W. S. Howells, Journal of Chemical Physics 113 (7), 2873-2879 (2000).
37
8. N. Malikova, S. Longeville, J. M. Zanotti, E. Dubois, V. Marry, P. Turq and J. Ollivier, Physical Review Letters 101 (26), 265901 (2008).
9. V. Marry, E. Dubois, N. Malikova, J. Breu and W. Haussler, Journal of Physical Chemistry C 117 (29), 15106-15115 (2013).
10. S. Cerveny, F. Mallamace, J. Swenson, M. Vogel and L. M. Xu, Chemical Reviews 116 (13), 7608-7625 (2016).
11. D. Demuth, M. Sattig, E. Steinrucken, M. Weigler and M. Vogel, Zeitschrift Fur Physikalische Chemie-International Journal of Research in Physical Chemistry & Chemical Physics 232 (7-8), 1059-1087 (2018).
12. C. Lederle, M. Sattig and M. Vogel, Journal of Physical Chemistry C 122 (27), 15427-15434 (2018).
13. M. Weigler, M. Brodrecht, G. Buntkowsky and M. Vogel, Journal of Physical Chemistry B 123 (9), 2123-2134 (2019).
14. J. Swenson and S. Cerveny, Journal of Physics-Condensed Matter 27 (3) (2015). 15. A. A. Milischuk and B. M. Ladanyi, Journal of Chemical Physics 135 (17) (2011). 16. P. Gallo, M. Rovere and S. H. Chen, Journal of Physics-Condensed Matter 24 (6) (2012). 17. N. Kuon, A. A. Milischuk, B. M. Ladanyi and E. Flenner, Journal of Chemical Physics 146 (21) (2017).
18. M. C. Bellissent-Funel, S. H. Chen and J. M. Zanotti, Physical Review E 51 (5), 4558-4569 (1995).
19. J. M. Zanotti, M. C. Bellissent-Funel and S. H. Chen, Physical Review E 59 (3), 3084-3093 (1999).
20. S. Takahara, M. Nakano, S. Kittaka, Y. Kuroda, T. Mori, H. Hamano and T. Yamaguchi, Journal of Physical Chemistry B 103 (28), 5814-5819 (1999).
38
21. A. Faraone, L. Liu, C. Y. Mou, P. C. Shih, J. R. D. Copley and S. H. Chen, Journal of Chemical Physics 119 (7), 3963-3971 (2003).
22. S. Takahara, N. Sumiyama, S. Kittaka, T. Yamaguchi and M. C. Bellissent-Funel, Journal of Physical Chemistry B 109 (22), 11231-11239 (2005).
23. A. Faraone, K. H. Liu, C. Y. Mou, Y. Zhang and S. H. Chen, Journal of Chemical Physics 130 (13) (2009).
24. I. M. Briman, D. Rebiscoul, O. Diat, J. M. Zanotti, P. Jollivet, P. Barboux and S. Gin, Journal of Physical Chemistry C 116 (12), 7021-7028 (2012).
25. M. Aso, K. Ito, H. Sugino, K. Yoshida, T. Yamada, O. Yamamuro, S. Inagaki and T. Yamaguchi, Pure and Applied Chemistry 85 (1), 289-305 (2013).
26. M. Baum, F. Rieutord, F. Jurany, C. Rey and D. Rebiscoul, Langmuir 35 (33), 10780-10794 (2019).
27. S. O. Diallo, L. Vlcek, E. Mamontov, J. K. Keum, J. H. Chen, J. S. Hayes and A. A. Chialvo, Physical Review E 91 (2) (2015).
28. M. C. Bellissent-Funel, K. Kaneko, T. Ohba, M. S. Appavou, A. J. Soininen and J. Wuttke, Physical Review E 93 (2) (2016).
29. A. Kiwilsza, A. Pajzderska, M. A. Gonzalez, J. Mielcarek and J. Wasicki, Journal of Physical Chemistry C 119 (29), 16578-16586 (2015).
30. J. Beck, J. Vartuli, W. Roth, M. Leonowicz, C. Kresge, K. Schmitt, C. Chu, D. Olson, E. Sheppard, S. Mccullen, J. Higgins and J. Schlenker, Journal of the American Chemical Society 114 (27), 10834-10843 (1992).
31. M. Grun, I. Lauer and K. K. Unger, Advanced Materials 9 (3), 254-& (1997).
32. F. Hoffmann, M. Cornelius, J. Morell and M. Fröba, Angewandte Chemie-International Edition 45 (20), 3216-3251 (2006).
39
33. J. B. Mietner, F. J. Brieler, Y. J. Lee and M. Fröba, Angewandte Chemie-International Edition 56 (40), 12348-12351 (2017).
34. J. B. Mietner, M. Fröba and R. Valiullin, Journal of Physical Chemistry C 122 (24), 12673-12680 (2018).
35. M. Thommes, J. Morell, K. A. Cychosz and M. Fröba, Langmuir 29 (48), 14893-14902 (2013).
36. J. B. Mietner, Visiting Nanopores : the great potential of PMOs for studying the properties of water in nanopores of different polarity, Doctoral dissertation, Universität Hamburg, 2018. 37. J. Qvist, H. Schober and B. Halle, Journal of Chemical Physics 134 (14) (2011).
38. D. Morineau, Y. D. Xia and C. Alba-Simionesco, Journal of Chemical Physics 117 (19), 8966-8972 (2002).
39. D. Morineau and C. Alba-Simionesco, Journal of Chemical Physics 118 (20), 9389-9400 (2003).
40. D. Morineau and C. Alba-Simionesco, Journal of Physical Chemistry Letters 1 (7), 1155-1159 (2010).
41. A. R. A. Hamid, R. Mhanna, P. Catrou, Y. Bulteau, R. Lefort and D. Morineau, Journal of Physical Chemistry C 120 (20), 11049-11053 (2016).
42. A. Hamid, R. Mhanna, R. Lefort, A. Ghoufi, C. Alba-Simionesco, B. Frick and D. Morineau, Journal of Physical Chemistry C 120 (17), 9245-9252 (2016).
43. D. Morineau, M. Busch, M. Fröba, P. Huber and J. Ollivier, in Water dynamics in
mesoporous with periodically alternating surface interaction. Institut Laue-Langevin (ILL) ; (doi:
40
44. D. Morineau, M. Appel, M. Busch, B. Frick, M. Fröba, P. Huber, A. Jani and J. Ollivier, in
Water dynamics in mesoporous with periodically alternating surface interaction. Institut
Laue-Langevin (ILL) ; (doi:10.5291/ILL-DATA.6-07-45 (2019)).
45. M. Appel and B. Frick, Review of Scientific Instruments 88 (3) (2017).
46. O. Arnold, J. C. Bilheux, J. M. Borreguero, A. Buts, S. I. Campbell, L. Chapon, M. Doucet, N. Draper, R. F. Leal, M. A. Gigg, V. E. Lynch, A. Markvardsen, D. J. Mikkelson, R. L. Mikkelson, R. Miller, K. Palmen, P. Parker, G. Passos, T. G. Perring, P. F. Peterson, S. Ren, M. A. Reuter, A. T. Savici, J. W. Taylor, R. J. Taylor, R. Tolchenoy, W. Zhou and J. Zikoysky, Nuclear Instruments & Methods in Physics Research Section a-Accelerators Spectrometers Detectors and Associated Equipment 764, 156-166 (2014).
47. D. Richard, M. Ferrand and G. J. Kearley, Journal of Neutron Research 4, 33-39 (1996). 48. A. Arbe, P. M. de Molina, F. Alvarez, B. Frick and J. Colmenero, Physical Review Letters 117 (18) (2016).
49. M. Bée, Quasi-elastic Neutron Scattering Principles and Application in Solid State
Chemistry, Biology and Materials Science., Adam Hilger, Bristol ed. (1998).
50. J. Teixeira, M. C. Bellissentfunel, S. H. Chen and A. J. Dianoux, Physical Review A 31 (3), 1913-1917 (1985).
51. F. Volino and A. J. Dianoux, Molecular Physics 41 (2), 271-279 (1980).
52. G. H. Findenegg, S. Jahnert, D. Akcakayiran and A. Schreiber, ChemPhysChem 9 (18), 2651-2659 (2008).
53. S. Jahnert, F. V. Chavez, G. E. Schaumann, A. Schreiber, M. Schonhoff and G. H. Findenegg, Physical Chemistry Chemical Physics 10 (39), 6039-6051 (2008).
54. S. Gruener, T. Hofmann, D. Wallacher, A. V. Kityk and P. Huber, Physical Review E 79 (6) (2009).
41
55. P. L. Hall and D. K. Ross, Molecular Physics 42 (3), 673-682 (1981).
56. W. S. Price, H. Ide and Y. Arata, Journal of Physical Chemistry A 103 (4), 448-450 (1999). 57. M. D. Ediger and P. Harrowell, Journal of Chemical Physics 137 (8) (2012).
1
Dynamics of Water Confined in Mesopores with
Variable Surface Interaction
Aîcha Jania, Mark Buschb, J. Benedikt Mietnerc, Jacques Ollivierd, Markus Appeld, Bernhard
Frickd, Jean-Marc Zanottie, Aziz Ghoufia, Patrick Huberb,f,g*, Michael Fröbac*, and Denis
Morineaua*
aInstitute of Physics of Rennes, CNRS-University of Rennes 1, UMR 6251, F-35042 Rennes,
France
bHamburg University of Technology, Center for Integrated Multiscale Materials Systems
CIMMS, 21073 Hamburg, Germany
cInstitute of Inorganic and Applied Chemistry, University of Hamburg, 20146 Hamburg,
Germany
dInstitut Laue-Langevin, 71 avenue des Martyrs, F-38000 Grenoble, France
eLaboratoire Léon Brillouin, CEA, CNRS, Université Paris-Saclay, F-91191 Gif-sur-Yvette,
France
fDeutsches Elektronen-Synchrotron DESY, Centre for X-Ray and Nano Science CXNS, 22603
Hamburg, Germany
gHamburg University, Centre for Hybrid Nanostructures CHyN, 22607 Hamburg, Germany
2
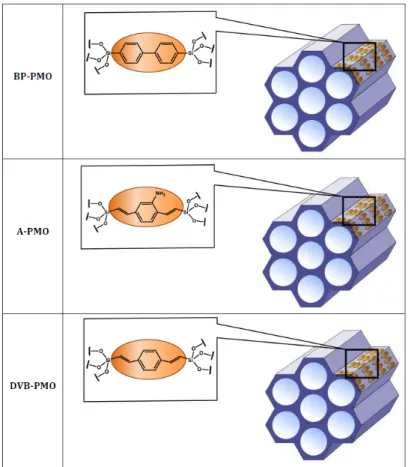
Supporting Information
Fig. S1: Schematics of the three PMOs studied. From top to bottom: biphenyl-bridged PMO, divinyl-aniline-bridged PMO, and divinyl-benzene-bridged PMO.