HAL Id: hal-01035453
https://hal.archives-ouvertes.fr/hal-01035453
Submitted on 22 Jul 2014
HAL is a multi-disciplinary open access
archive for the deposit and dissemination of
sci-entific research documents, whether they are
pub-lished or not. The documents may come from
teaching and research institutions in France or
abroad, or from public or private research centers.
L’archive ouverte pluridisciplinaire HAL, est
destinée au dépôt et à la diffusion de documents
scientifiques de niveau recherche, publiés ou non,
émanant des établissements d’enseignement et de
recherche français ou étrangers, des laboratoires
publics ou privés.
V838 Monocerotis: the central star and its environment
a decade after outburst
Olivier Chesneau, Florentin Millour, Orsola de Marco, S.N. Bright, Alain
Spang, D. P. K. Banerjee, N. M. Ashok, T. Kaminski, John P. Wisniewski,
Anthony Meilland, et al.
To cite this version:
Olivier Chesneau, Florentin Millour, Orsola de Marco, S.N. Bright, Alain Spang, et al.. V838
Monocerotis: the central star and its environment a decade after outburst. Astronomy and Astrophysics
-A&A, EDP Sciences, 2014, Will be set by the publisher. �hal-01035453�
July 22, 2014
Letter to the Editor
V838 Monocerotis: the central star and its environment a decade
after outburst
O. Chesneau
1,, F. Millour
1, O. De Marco
2, S. N. Bright
1,2, A. Spang
1, D. P. K. Banerjee
3, N. M. Ashok
3,
T. Kami´nski
4, J P. Wisniewski,
5, A. Meilland
1, and E. Lagadec
1 ⋆1 Laboratoire Lagrange, UMR7293, Univ. Nice Sophia-Antipolis, CNRS, Observatoire de la Cˆote d’Azur, 06300 Nice, France 2 Department of Physics & Astronomy, Macquarie University, Sydney, NSW 2109, Australia
3 Physical Research Laboratory, Navrangpura, Ahmedabad, Gujarat, India
4 Max-Planck Institut f¨ur Radioastronomie, Auf dem H¨ugel 69, D-53121 Bonn, Germany
5 HL Dodge Department of Physics & Astronomy, University of Oklahoma, 440 W Brooks Street, Norman, OK 73019, USA
Received, accepted.
ABSTRACT
Aims.V838 Monocerotis erupted in 2002, brightened in a series of outbursts, and eventually developed a spectacular light echo. A
very red star emerged a few months after the outburst. The whole event has been interpreted as the result of a merger.
Methods. We obtained near-IR and mid-IR interferometric observations of V838 Mon with the AMBER and MIDI recombiners
located at the Very Large Telescope Interferometer (VLTI) array. The MIDI two-beam observations were obtained with the 8m Unit Telescopes between October 2011 and February 2012. The AMBER three-beam observations were obtained with the compact array (B≤35m) in April 2013 and the long array (B≤140m) in May 2014, using the 1.8m Auxiliary Telescopes.
Results.A significant new result is the detection of a compact structure around V838 Mon, as seen from MIDI data. The extension of
the structure increases from a FWHM of 25 mas at 8 µm to 70 mas at 13 µm. At the adopted distance of D = 6.1 ± 0.6 kpc, the dust is distributed from about 150 to 400 AU around V838 Mon. The MIDI visibilities reveal a flattened structure whose aspect ratio increases with wavelength. The major axis is roughly oriented around a position angle of −10◦, which aligns with previous polarimetric studies
reported in the literature. This flattening can be interpreted as a relic of the 2002 eruption or by the influence of the currently embedded B3V companion. The AMBER data provide a new diameter for the pseudo-photosphere, which shows that its diameter has decreased by about 40% in 10yrs, reaching a radius R∗=750 ± 200 R⊙ (3.5 ± 1.0 AU).
Conclusions.After the 2002 eruption, interpreted as the merging of two stars, it seems that the resulting source is relaxing to a normal
state. The nearby environment exhibits an equatorial over-density of dust up to several hundreds of AU.
Key words.Techniques: high angular resolution; individual: V838 Mon; Stars: circumstellar matter; Stars: mass-loss
1. Introduction
V838 Mon is a nova-like object, which erupted in 2002 in a se-ries of outbursts (reaching V∼6.8). It subsequently developed a light echo which was extensively studied by Bond et al. (2003); Banerjee et al. (2006); Tylenda & Kami´nski (2012). The erup-tion was unlike classical novae as the effective temperature of the object dropped and the spectral type evolved into a very late L-type supergiant (Evans et al. 2003; Loebman et al. in press). The event has been interpreted as the merger of a ∼8 M⊙star with a
sub-solar mass star (Soker & Tylenda 2003; Tylenda et al. 2005; Tylenda & Soker 2006). The mid infrared flux of V838 Mon in-creased by a factor of two between 2004 and 2007, suggesting that new dust was forming in the expanding ejecta of the out-bursts (Wisniewski et al. 2003a; Tylenda 2005; Wisniewski et al. 2008). The expanding ejecta engulfed a companion close to the central source (Bond 2006; Munari et al. 2007; Kolka et al. 2009).
Send offprint requests to: [email protected]
⋆ Based on observations at Paranal Observatory under programs
088.D-0005, 090.D-0011, 091.D-0030 and 093.D-0056.
O. Chesneau passed away shortly before submitting this letter. We express our profound sadness on this untimely demise and convey our deepest condolences to his family.
The progenitor of V838 Mon was found in a variety of sur-veys, including 2MASS, and appears consistent with a some-what reddened early main sequence star. Post-outburst observa-tions have found a faint, blue component in the spectrum and Tylenda et al. (2005) argued that the pre-outburst spectral en-ergy distribution (SED) is well-matched by a pair of early main sequence stars (B3V + B1.5V or B4V + A0.5V), making V838 Mon a triple system de facto (main star + sub-solar merging star +B3V companion). Lynch et al. (2004) obtained numerous IR spectra of V838 Mon during and after the eruption (2002-2003). They fit their data to a model consisting of a cool (Teff=2100K,
R∗ = 8.8 AU) stellar photosphere surrounded by a large,
ab-sorbing molecular cloud. A more recent work (Loebman et al. in press) provides precise estimates of the stellar and enshroud-ing cloud parameters, with an effective temperature of the star of 2000–2200 K, and a radius of the shell of R = 263 ± 10 AU.
Lane et al. (2005) first used long-baseline near-IR (2.2 µm baselines smaller than 85 m) interferometry in November-December 2004 to provide the first direct measurement of the angular size of V838 Mon using the two-telescope recombiner Palomar Testbed Instrument (PTI). At this epoch, they mea-sured an angular diameter for the central source of Θ = 1.83 ± 0.06 mas. Reasonably accurate distances were determined from the light echo and using other methods (Munari et al. 2005;
Chesneau et al.: V838 Mon 10 years after outburst
Sparks et al. 2008; Kami´nski et al. 2011). We adopt the distance D =6.1 ± 0.6 kpc from Sparks et al. (2008). Using this distance, the interferometric diameter translates to a linear radius for the supergiant of 1200 ± 150 R⊙ (5.6 ± 0.7 AU). Lane et al. (2005)
could also fit the data assuming an elliptical structure with a ma-jor axis oriented at P.A. 15◦whose extensions are 3.57×0.07 mas
(i.e. the minor axis is unresolved).
V838 Mon is embedded in a dense, large scale environment (Tylenda & Kami´nski 2012; Kami´nski et al. 2011; Exter et al. 2014), potentially contaminating observations of the central star. High angular resolution studies with a field-of-view (FOV) of a few arcsec are an asset in that domain to isolate the central regions from the extended dusty cloud. A great advantage of op-tical interferometry studies is to fully isolate the measurements from the extended environment.
This letter presents optical interferometry measurements ob-tained with the Very Large Telescope Interferometer (VLTI). The observations are presented in Sect. 2. In Sect. 3 we ana-lyze the MIDI mid-IR measurements followed by the AMBER Kband measurements by means of simple geometrical models. The results are then discussed in Sect. 4.
2. Observations
Mid-IR interferometric data were obtained with the two-telescope recombiner MIDI (Leinert et al. 2004) between October 2011 and February 2012 using the 8m Unit Telescopes (UTs) of the Very Large Telescope. These observations provided dispersed fringe visibilities between 8 and 13 µm in addition to classical spectrophotometric capabilities.
Near-infrared observations were obtained with AMBER (a three-telescopes combiner located at the VLTI: Petrov et al. 2007) in November 2012 and February 2013, using the low spec-tral resolution mode (R=35) with the UTs. Unfortunately, these data are unusable due to a bad calibrator (see details in appendix A) and therefore not presented here. In April 2013, observa-tions were repeated with the 1.8m Auxiliary Telescopes (ATs) under photometric conditions, using the compact configuration (B ≤ 35m) and more suitable calibrators. The extended con-figuration (B ≤ 140m) was subsequently used in May 2014 to observe V838 Mon. N E −100 0 100 −100 0 100 U (m) V (m) N E −100 0 100 −100 0 100 U (m) V (m)
Fig. 1. Left: (u, v) coverage of the AMBER observations. Small dots are observations with ATs and larger circles with UTs. Right: (u, v) coverage of the MIDI observations.
The great advantage of both instruments is that the FOV of the interferometric measurements are within the point spread function of a single telescope, i.e. the same value of ∼0.3” at 2.2 µm for the 1.8m ATs with AMBER, and at 10 µm for the 8m
UTs with MIDI. This isolates the central source from the ex-tended emission of the cloud in which V838 Mon is embedded. The observation log is presented in Table 1 and the (u, v) plane coverage is plotted in Fig.1.
We reduced the AMBER data using the standard data reduc-tion software amdlib v3.0.8 (Tatulli et al. 2007; Chelli et al. 2009). Near-infrared JHK photometry was obtained on a regu-lar basis from the 1.2m telescope at the Mt. Abu Observatory, India (Banerjee & Ashok 2012). These measurements helped to prepare the interferometric observations. On March 1, 2013, the J, H, K band magnitudes were 7.12, 5.91, 5.43, respectively, al-most unchanged since November 2011.
Table 1. Log of AMBER and MIDI observations of V838 Mon.
Date Stations Calibrators Wavelength Nb. obs. MIDI 10/10/2011 U3-U4 1◦ 8–13 µm 2 13/12/2011 U2-U3 1◦ 8–13 µm 1 14/12/2011 U2-U3 1◦ 8–13 µm 1 11/02/2012 U3-U4 1◦ 8–13 µm 1 AMBER 14/04/2013 A1-B2-D0 6⊳, 7⊲ 1.54–2.50 µm 3 15/04/2013 A1-C1-D0 6⊳, 8△ 1.56–2.50 µm 2 06/05/2014 A1-G1-J3 9▽ 1.53–2.46 µm 1 Notes. Calibrator angular diameters from SearchCal/JMMC (Bonneau et al.
2006) and getCal/NExScI.◦: HD 52666 2.53 ± 0.21 mas,⊳: HD 52265 0.44 ±
0.03 mas, ⊲: HD 64616 0.51 ± 0.04 mas, △: HD 63660 0.96 ± 0.07 mas, ▽:
HD 54990 0.57 ± 0.59 mas.
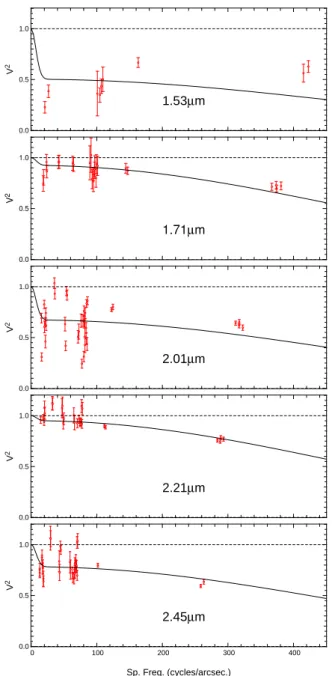
Visibilities are a proxy to the object’s size and shape. The AMBER visibilities are presented in Fig. 2 at selected wave-lengths for all baselines, and for the longest baseline in Fig. 3 together with the JHK Mt. Abu spectrum. Strong variations as a function of wavelength are seen, especially at the edge of the Hand K bands where they decrease relative to the bands cen-ters (1.7 µm and 2.2 µm). All baseline lengths show this curved shape. We are confident this is not a flux bias or instrumental effect, but comes from the source itself.
Closure phases can be qualitatively interpreted as a proxy to asymmetries: a non-zero (modulo π) closure phase is a sign of asymmetries in the object’s shape. The 2014 closure phases are of good quality and compatible with zero with a mean value of −1.◦04 ± 1.◦12. The object is therefore likely centro-symmetric
as seen by AMBER. The spectral-range of the AMBER data is 1.5–2.5 µm.
The MIDI data were processed using the MIA+EWS software1
(Chesneau 2007). The data were secured in High Sens mode im-plying that the photometry is obtained subsequently to fringes. The quality of the data ranges from high quality (error level ∼10%) to poor quality for some baselines (error level reach-ing ∼25%). The spectrophotometric calibration of the mid-IR flux was performed with the calibrator HD 52666 (M2III, IRAS F12=18.3 Jy with a 5% error). The ten MIDI spectra from two telescopes were merged leading to a spectrophotometry with an 8% error level, representing the mid-IR flux of the source between October and February 2011. The spectrum was com-pared with measurements at the same epoch from the WISE2
and AKARI3satellites obtained with much larger apertures. The
1 http://home.strw.leidenuniv.nl/∼nevec/MIDI/ 2 taken in April 2 and October 10, 2010 3 obtained between May 2006 and August 2007
1.53µm 0.0 0.5 1.0 V 2 1.71µm 0.0 0.5 1.0 V 2 2.01µm 0.0 0.5 1.0 V 2 2.21µm 0.0 0.5 1.0 V 2 2.45µm 0 100 200 300 400 0.0 0.5 1.0 V 2 Sp. Freq. (cycles/arcsec.)
Fig. 2. AMBER data shown as a function of spatial frequen-cies for selected wavelengths. The black line shows our best-fit model of a uniform disk plus an extended component (50 mas FWHM here).
flux in the WISE filter (λ = 11.56 µm , ∆λ = 5.51 µm) is 31.56±0.06 Jy and in the AKARI filter (λ = 8.22 µm , ∆λ = 4.10 µm) the flux is 20.11±0.39 Jy. The spectrophotometry and the corresponding Gaussian estimates from the MIDI are shown in Fig.4.
3. Analysis
The MIDI dispersed visibilities were translated to the simplest possible geometrical ad-hoc model – a Gaussian brightness dis-tribution, as described in Leinert et al. (2004). The resulting fits shown in Fig. 4 depict the general appearance of the mid-infrared structure. The semi-major and semi-minor axes of the drawn el-lipses represent the half-width at half maximum (HWHM) of the Gaussian. The extent of that structure increases from a FWHM of 25 mas at 8 µm to 70 mas at 13 µm, with a high flattening ratio. Despite the heterogeneity of the quality of the MIDI visibilities,
J H K 0. 2. 4. 6. 8. 10−16 1.0 1.5 2.0 2.5 0. 2. 4. 6. 8. 10−16 2. 1.5 1. 0.5 0.
Squared Visibility (no unit)
Wavelength (µm) Flux (W/cm 2/µ m) Flux (W/cm 2/µ m)
Fig. 3. Top: The 0.85–2.5 micron spectrum of V838 Mon on 11 December 2013 corrected for extinction using E(B-V) = 0.5. For comparison, we show the AMBER longest baseline visibility (thick black lines, right axis), and indicate with arrows the wave-lengths of Fig. 2. Bottom: Spectra extracted from the AMBER data according to a downgraded resolution version of the above spectrum (black line). Red dashed line: the star spectrum. Blue dotted line: extended emission spectrum.
the flattening of that structure is certain, but we can only pro-vide a loose range for flattening ratio values between 1.1 and 2.5 near 9 µm, and between 1.3 and 60 near 12 µm. The major axis is oriented at a P.A. close to −10◦ with an uncertainty of more than ±30◦. The flattening increases with the wavelength,
from a roughly round structure at 8 µm to a very flattened struc-ture at 13 µm. This may come from the contribution of the star, stronger at 8 µm. The flux from WISE agrees fairly well with the MIDI flux. AKARI data is offset in time from the MIDI data by 5 to 6 years. Given that the source’s SED has been evolving in the IR (Wisniewski et al. 2008) it is not unexpected or surpris-ing that there is some difference in the value of the 9 micron flux measured by AKARI and MIDI. This implies that most of the mid-IR flux in 2011 originates from the vicinity of the central star (≤ 0.4”).
The 2013 short-baseline AMBER visibilities are all very close to unity in the band centers at 1.7 µm and 2.2 µm and are consistent with a completely unresolved object. The long-baseline, 2014 visibilities are close to V2 = 0.8 at the same
wavelengths.
The visibilities as a function of wavelength of the H and K bands decrease relative to the bands centers (1.7 µm and 2.2 µm), as shown in Fig. 3. This is indicative of an object whose shape changes as a function of wavelength. At the same time, the vis-ibilities at the edge of the bands (1.5 µm, 2.0 µm and 2.4 µm) show a “plateau-like” shape as a function of spatial frequen-cies (see Fig. 2), indicative of an additional resolved component. We therefore analysed first the K band center using a
single-Chesneau et al.: V838 Mon 10 years after outburst
component model, and then added an additional component to analyze the full AMBER dataset.
N E −40 −20 0 20 40 −40 −20 0 20 40 α (mas) δ (mas) 8.05µm 9.04µm 10µm 11µm 12µm 13µm
Fig. 4. Top: MIDI spectrum obtained in 2011. We added for comparison AKARI (triangle) and WISE (square) fluxes. Bottom: 2D Gaussian fit to the whole MIDI dataset. The dashed lines represent the direction of the observation baselines.
We used the fitOmatic software (Millour et al. 2009) to derive an angular diameter assuming a uniform disk model around 2.2µm. If we include all the 2013 (short baselines) and 2014 (long baselines) observations, we find a diameter of 1.17 ± 0.37 mas. If we keep only the 2014 data, we obtain a diameter of 1.15 ± 0.20 mas. We adopt the latter diameter of 1.15 ± 0.20 mas as the 2013 data (short baselines) do not resolve the central star. This measured diameter is significantly smaller than the one published by Lane et al. (2005).
The AMBER closure phases are all equal to zero within the error bars. We can therefore constrain the flux of an hypothetical companion star in addition to the central merger. To achieve that, we added a point-source to our model and used a simulated an-nealing algorithm to constrain its parameters using the observed visibilities and closure phases and starting with random initial parameters. Our conclusion is that its flux was always smaller than 3% of the total flux, i.e. there would be at minimum 4 mag-nitudes difference between primary and secondary companion. The AMBER observations do not exclude the presence of the companion, but put important constraints on its NIR contribu-tion to the SED.
The decreasing visibilities at the edges of the H and K bands indicate the presence of extended emission with a varying spec-trum (as shown in lower panel in Fig. 3, blue dotted line). We cannot constrain the exact size of this contribution due to the plateau-like shape of visibilities as a function of spatial
frequen-cies, but we can provide a lower limit of its size of θ ≥ 20 mas. We tentatively associate this emission to the MIDI elongated dusty structure. The extended component would correspond to the H and K bands contribution of the MIDI elongated structure. It is noteworthy that adding this additional source of emission does not significantly change the estimated diameter for the cen-tral star.
To complement these measurements, we used a JHK spec-trum of the star from Mt Abu (India), obtained on 11 December 2013, to derive a low-resolution spectrum of the central star and the extended emission (Fig. 3, lower panel). The stellar spectrum is typical of a cool luminous star (see Lanc¸on & Wood 2000; Banerjee & Ashok 2002, for a comparison) with prominent first overtone CO bands at 2.29 µm and beyond. Similar, albeit weak, CO second overtone features are also seen in the H band. The deep down-turns at the band edges are due to the presence of water in its atmosphere (Banerjee et al. 2005). Other molecular features of VO and TiO are also seen, including some rather un-common bands of AlO. The spectrum of the extended structure shows emission bands at the H and K band edges, where the water absorption occurs in the total spectrum.
4. Discussion
The P.A. of the major axis, as inferred from the dusty flat-tened structure discovered by MIDI is ≈ −10◦. The MIDI size
increase is expected for a non-truncated dusty disk. At the adopted distance, the dust is distributed between 150 and 400 AU from V838 Mon. Such findings are also in agreement with the earliest accurate spectropolarimetric measurements reported by Wisniewski et al. (2003a,b). They reported an intrinsic polarisa-tion with a P.A. of 127.◦0 ± 0.◦5 interpreted as scattering by a disk
with a major axis at a P.A. of 37◦.
The 2004 PTI interferometric data had been interpreted as either a uniform disk or an elliptical model, both consistently ex-plaining the data well. We note that the P.A.=15+3−27◦derived from
PTI is roughly aligned with our longest AMBER baselines, i.e. we would be sensitive to the major axis size in case the correct Lane et al. (2005) model had been that of an elongated structure. Our AMBER data suggest a different picture. The supergiant has decreased in angular size by ≈ 40% in ≈ 10 years since the mea-surements of Lane et al. (2005). The linear radius is now esti-mated to 750 ± 200 R⊙ (3.5 ± 1.0 AU). Such a radius is
compara-ble to the famous M2 Iab supergiant Betelgeuse (Haubois et al. 2009, 885 ± 90 R⊙). Such an evolution has already been
sug-gested by (Geballe et al. 2007). This diameter decrease means the star’s photosphere has shrinked during the intervening pe-riod at an approximate rate of 1km s−1.
The good quality of the closure phases provides crucial con-straints and excludes any secondary star brighter than a few per-cent of the total flux in the 6–600 AU separation range. Yet, we caution that a B3V star whose K band magnitude is fainter than 15 would be totally undetectable by the interferometer.
The AMBER interferometric observations obtained 10 yr af-ter PTI suggest a contraction of the central star by about 40%, which is in line with the spectral change of V838 Mon toward a ’normal’ M-type supergiant. No clear sign of deformation of the photosphere is detected.
The extended emission found in the AMBER data is en-hanced relative to the central star around the CO overtone ab-sorption features and the H2O absorption at the band edges. This
means there is water emission around the star at an angular scale larger than 20 mas, and smaller than 250 mas (field of view of
one telescope at 2.2 µm). We tentatively associate this emission to the MIDI elongated dusty structure.
Several hypotheses could be proposed to explain the detec-tion of the flattened structure at large distance, as observed by MIDI and supported by AMBER.
The most likely hypothesis is that the flattened structure is simply the relic of the large dust formation event as a conse-quence of the merging of the two stars (Wisniewski et al. 2008, 2003a; Nicholls et al. 2013). The ejecta velocity was low at out-burst time – less than 200km s−1as derived from P-Cygni
pro-files by Lynch et al. (2004) from several lines. In the 10 years since outburst, ejected material would not have travelled beyond 400 AU. This scenario is compatible with our finding.
The interferometric observations may also be discussed in the context of the B3V companion discovered around V838 Mon (Desidera & Munari 2002; Wagner & Starrfield 2002; Munari et al. 2002, 2005) and observed in the post-outburst spectra. The presence of the companion would explain the X-ray activity discovered in the vicinity of V838 Mon (Antonini et al. 2010). It is important to note that the distance of this companion from the central star was investigated by Munari et al. (2007), and they estimated the minimum separa-tion to about 28 AU. On the other hand, Tylenda et al. (2009) derived a separation of ≈ 250 AU. This is well within the separation range detectable by AMBER. The MIDI measure-ments suggest a large separation of about 100 AU. In 2009, the B3V hot signature was no longer observed (Kolka et al. 2009). We would propose then that the companion is building a circumbinary disk via the Lagrangian point L2, as proposed in some observational and theoretical studies on other sources (Plets et al. 1995; Meilland et al. 2010; Millour et al. 2011).
To conclude, we find a flattened dusty structure around V838 Mon. We also find that the central star decreased its diameter by nearly 40% in 10 years.
The interferometric picture of V838 Mon as of today is the following: it is now slowly becoming an anonymous red super-giant, surrounded by a flattened, probably transitory, dusty envi-ronment extending up to several hundreds of AU.
Acknowledgements. O. Chesneau had wished to express his deepest gratitude to
the hospital staff for their professionalism and devotion during the writing of this letter. This letter makes use of the CDS, the JMMC and NExScI services.
References
Antonini, F., Montez, Jr., R., Kastner, J. H., et al. 2010, ApJ, 717, 795 Banerjee, D. P. K. & Ashok, N. M. 2002, A&A, 395, 161
Banerjee, D. P. K. & Ashok, N. M. 2012, Bulletin of the Astronomical Society of India, 40, 243
Banerjee, D. P. K., Barber, R. J., Ashok, N. M., & Tennyson, J. 2005, ApJL, 627, L141
Banerjee, D. P. K., Su, K. Y. L., Misselt, K. A., & Ashok, N. M. 2006, ApJL, 644, L57
Bond, H. E. 2006, The Astronomer’s Telegram, 966, 1
Bond, H. E., Henden, A., Levay, Z. G., et al. 2003, Nature, 422, 405 Bonneau, D., Clausse, J.-M., Delfosse, X., et al. 2006, A&A, 456, 789 Chelli, A., Utrera, O. H., & Duvert, G. 2009, A&A, 502, 705 Chesneau, O. 2007, New A Rev., 51, 666
Desidera, S. & Munari, U. 2002, IAU Circ., 7982, 1
Evans, A., Geballe, T. R., Rushton, M. T., et al. 2003, MNRAS, 343, 1054 Exter, K., Cox, N. L. J., Decin, L., & De Beck, E. 2014, in Asymmetrical
Planetary Nebulae VI conference, Proceedings of the conference held 4-8 November, 2013. Edited by C. Morisset, G. Delgado-Inglada and S. Torres-Peimbert.
Geballe, T. R., Rushton, M. T., Eyres, S. P. S., et al. 2007, A&A, 467, 269 Haubois, X., Perrin, G., Lacour, S., et al. 2009, A&A, 508, 923
Kami´nski, T., Tylenda, R., & Deguchi, S. 2011, A&A, 529, A48
Kolka, I., Liimets, T., Kankare, E., Pursimo, T., & Datson, J. 2009, The Astronomer’s Telegram, 2211, 1
Lanc¸on, A. & Wood, P. R. 2000, VizieR Online Data Catalog, 414, 60217 Lane, B. F., Retter, A., Thompson, R. R., & Eisner, J. A. 2005, ApJL, 622, L137 Leinert, C., van Boekel, R., Waters, L. B. F. M., et al. 2004, A&A, 423, 537 Loebman, S. R., Wisniewski, S. J., Schmidt, A. F., et al. in press, ApJ Lynch, D. K., Rudy, R. J., Russell, R. W., et al. 2004, ApJ, 607, 460 Meilland, A., Kanaan, S., Borges Fernandes, M., et al. 2010, A&A, 512, A73 Millour, F., Chesneau, O., Borges Fernandes, M., et al. 2009, A&A, 507, 317 Millour, F., Meilland, A., Chesneau, O., et al. 2011, A&A, 526, A107 Munari, U., Corradi, R. L. M., Henden, A., et al. 2007, A&A, 474, 585 Munari, U., Desidera, S., & Henden, A. 2002, IAU Circ., 8005, 2 Munari, U., Henden, A., Vallenari, A., et al. 2005, A&A, 434, 1107 Nicholls, C. P., Melis, C., Soszy´nski, I., et al. 2013, MNRAS, 431, L33 Petrov, R. G., Malbet, F., Weigelt, G., et al. 2007, A&A, 464, 1 Plets, H., Waelkens, C., & Trams, N. R. 1995, A&A, 293, 363 Soker, N. & Tylenda, R. 2003, ApJL, 582, L105
Sparks, W. B., Bond, H. E., Cracraft, M., et al. 2008, AJ, 135, 605 Tatulli, E., Millour, F., Chelli, A., et al. 2007, A&A, 464, 29 Tylenda, R. 2005, A&A, 436, 1009
Tylenda, R. & Kami´nski, T. 2012, A&A, 548, A23
Tylenda, R., Kami´nski, T., & Schmidt, M. 2009, A&A, 503, 899 Tylenda, R. & Soker, N. 2006, A&A, 451, 223
Tylenda, R., Soker, N., & Szczerba, R. 2005, A&A, 441, 1099 Wagner, R. M. & Starrfield, S. G. 2002, IAU Circ., 7992, 2
Wisniewski, J. P., Bjorkman, K. S., & Magalh˜aes, A. M. 2003a, ApJL, 598, L43 Wisniewski, J. P., Clampin, M., Bjorkman, K. S., & Barry, R. K. 2008, ApJL,
683, L171
Wisniewski, J. P., Morrison, N. D., Bjorkman, K. S., et al. 2003b, ApJ, 588, 486
Appendix A: Bad 2012 calibrator: a newly discovered binary star
The selected calibrator for the 2012 observations, HD 45299, is a previously-unseen visual binary star (see Fig. A.1) that we de-tect at 16.0 mas separation, position angle (P.A.) −67◦and 0.6/0.4
relative fluxes. −2 0 2 −10 0 10 1.24626 2.59304 1.24626 2.59304 1.24626 2.59304 1.24626 2.59304 1.24626 2.59304 1.24626 2.59304 1.24626 2.59304 1.24626 2.59304 1.24626 2.59304 1.24626 2.59304 1.24626 2.59304 1.24626 2.59304 1.24626 2.59304 1.24626 2.59304 1.24626 2.59304 1.24626 2.59304 1.24626 2.59304 1.24626 2.59304 1.24626 2.59304 1.24626 2.59304 1.24626 2.59304 1.24626 2.59304 1.24626 2.59304 1.24626 2.59304 1.24626 2.59304 1.24626 2.59304 1.24626 2.59304 1.24626 2.59304 1.24626 2.59304 1.24626 2.59304 1.24626 2.59304 1.24626 2.59304 1.24626 2.59304 1.24626 2.59304 1.24626 2.59304 1.24626 2.59304 1.24626 2.59304 1.24626 2.59304 0.5 1.0 1.5 2.0 0 100 200 300 −20 −10 0 10 20 Clos. φ (rad) Diff. Vis. Sp. Freq. (cycles/arcsec.) Clos. φ (rad) Diff. Vis. Sp. Freq. (cycles/arcsec.) Clos. φ (rad) Diff. Vis. Sp. Freq. (cycles/arcsec.) Res. ( σ ) Res. ( σ ) Sp. Freq. (cycles/arcsec.)
Fig. A.1. AMBER closure phases and differential visibilities (no calibrated V2 available) for HD45299 (color points with error
bars) together with a best-fit model of a binary star (black lines). The spatial frequencies are projected along the binary direction (−67◦) to show the binary modulation.