HAL Id: hal-00318116
https://hal.archives-ouvertes.fr/hal-00318116
Submitted on 9 Aug 2006
HAL is a multi-disciplinary open access
archive for the deposit and dissemination of
sci-entific research documents, whether they are
pub-lished or not. The documents may come from
teaching and research institutions in France or
abroad, or from public or private research centers.
L’archive ouverte pluridisciplinaire HAL, est
destinée au dépôt et à la diffusion de documents
scientifiques de niveau recherche, publiés ou non,
émanant des établissements d’enseignement et de
recherche français ou étrangers, des laboratoires
publics ou privés.
Directional features of the downshifted peak observed in
HF-induced stimulated electromagnetic emission spectra
obtained using an interferometer
E. D. Tereshchenko, R. Yu. Yurik, B. Z. Khudukon, M. T. Rietveld, B. Isham,
V. Belyey, A. Brekke, T. Hagfors, M. Grill
To cite this version:
E. D. Tereshchenko, R. Yu. Yurik, B. Z. Khudukon, M. T. Rietveld, B. Isham, et al.. Directional
features of the downshifted peak observed in HF-induced stimulated electromagnetic emission spectra
obtained using an interferometer. Annales Geophysicae, European Geosciences Union, 2006, 24 (7),
pp.1819-1827. �hal-00318116�
www.ann-geophys.net/24/1819/2006/ © European Geosciences Union 2006
Annales
Geophysicae
Directional features of the downshifted peak observed in
HF-induced stimulated electromagnetic emission spectra obtained
using an interferometer
E. D. Tereshchenko1, R. Yu. Yurik1, B. Z. Khudukon1, M. T. Rietveld2, B. Isham3, V. Belyey4, A. Brekke4, T. Hagfors5, and M. Grill6
1Polar Geophysical Institute, Murmansk, Russia 2EISCAT Scientific Association, Ramfjordbotn, Norway 3Interamerican University, Bayam´on, Puerto Rico, USA 4University of Tromsø, Tromsø, Norway
5Max Planck Institute for Solar System Research, Katlenburg-Lindau, Germany 6Lancaster University, Lancaster, UK
Received: 17 July 2005 – Revised: 10 April 2006 – Accepted: 6 June 2006 – Published: 9 August 2006
Abstract. A high frequency (HF) ionospheric modification
experiment was carried out between 25 September and 8 Oc-tober 2004, using the EISCAT HF transmitter located near Tromsø, Norway. During this experiment the spectra of the stimulated HF sideband waves (stimulated electromagnetic emission or SEE) induced by the HF pump were observed using an interferometer consisting of three spaced receiving antennas with baselines both along and perpendicular to the meridian, and a multi-channel coherent receiver, installed in the vicinity of the HF facility. The transmitter operated at 4040 kHz and its antenna beam was scanned to angles of 0◦, 7◦, 14◦, and 21◦south from vertical, pausing 4 min at each
position. This paper focuses on features of the downshifted peak (DP) emission, which has not been as thoroughly stud-ied as many of the other SEE spectral features observable within the EISCAT pump frequency range. It was found that the signal-weighted direction of the DP source region remained within 5◦of magnetic zenith as the HF beam was tilted between 0 and 21◦south of vertical.
Keywords. Ionosphere (Active experiments; Plasma waves
and instabilities) – Space plasma physics (Nonlinear phe-nomena)
Correspondence to: M. T. Rietveld
mike.rietveld@eiscat.uit.no
1 Introduction
1.1 Stimulated electromagnetic emission
A rich plasma response to electromagnetic pumping can be seen by simply monitoring on the ground the weak non-thermal electromagnetic radiation stimulated by a pump wave in the interaction region at a few hundred kilometers altitude and which has escaped from the ionospheric plasma. This pump-induced radiation has been termed stimulated electromagnetic emission (SEE). Commonly used terms in the Russian literature are artificial ionospheric radiation or radio emission.
Discovered at Tromsø in 1981 (Thid´e et al., 1982), SEE is a complex phenomenon that has close connections to stri-ations and turbulent processes in the ionosphere (Leyser, 2001). SEE may be a consequence of excited Langmuir waves that convert to HF electromagnetic waves by scat-tering off low or zero frequency electrostatic waves. These electromagnetic waves may then propagate out of the modi-fied ionosphere and be observed on the ground. They appear as sidebands of the ionospherically-reflected pump wave, reaching an intensity of 50 to 75 dB below the magnitude of the reflected pump and several tens of dB above the back-ground noise level. The pump frequency f0 is in the HF
band, i.e. typically a few MHz and near the electron plasma frequency fp in the pump-plasma interaction region. SEE
commonly covers a spectral width of the order of 100 kHz, or 1f/f0≈0.02, around the ionospherically-reflected pump
1820 E. D. Tereshchenko: Directional features of the downshifted peak wave, but it is also observed at harmonics and sub-harmonics
of f0 (Derblom et al., 1989). SEE has been detected for
f0 ranging at least from 2.8 to 9.4 MHz (Leyser, 2001),
therefore occurring at much higher frequencies than the HF pump-excited secondary electromagnetic radiation found in the VLF, ELF, and ULF bands (Barr, 1998). On the other hand, SEE occurs at much lower frequencies than the elec-tromagnetic emissions at optical frequencies that are studied in experiments of HF pump-enhanced airglow (Bernhardt et al., 1989). Some SEE features have been linked to paramet-ric interactions involving electromagnetic waves, Langmuir waves, and ion-acoustic waves (Stubbe et al., 1984).
The geomagnetic field plays a dominant role in SEE, as evidenced by the morphology of the SEE spectrum, which depends dramatically on the proximity of the HF pump fre-quency to a harmonic of the local electron gyrofrefre-quency (Honary et al., 1999; Frolov et al., 2001). These proper-ties suggest that features in the SEE spectrum should also depend on geomagnetic aspect angle (Isham et al., 2005), a topic that is investigated in this report. SEE is also known to be sensitive to pump duty cycle, power, and to pumping by additional waves (Leyser, 2001). It develops on a wide range of time scales, from under a millisecond to tens of sec-onds for a given pump power, encompassing over four or-ders of magnitude in time (Thid´e et al., 1983). Physically, this range spans ponderomotive to thermal/collisional time scales, with the thermal processes creating long-time struc-turing of the magnetized plasma in which the ponderomotive processes continue to operate. These features make SEE an important tool for the study of HF radiowave pump-induced processes in the ionosphere. Knowledge gained in the study of artificially stimulated radio emissions may also be of inter-est for comparison with observations of radio emissions from naturally-driven plasma turbulence processes known to occur in planetary atmospheres, in the solar corona, and which in all likelihood occur throughout the plasma universe. 1.2 Downshifted peak
A distinctive feature of the steady-state SEE spectrum is the downshifted peak (DP), a narrow and normally strong emis-sion located at 1f = 1fDP= –(f –f0)≈1 to 3 kHz below the
pump frequency f0 and several kHz above the
commonly-observed downshifted maximum (DM) feature. The DP may be found superimposed on the slow narrow continuum (SNC), which typically extends 5 to 20 kHz below and often some kilohertz above f0 (Stubbe et al., 1984, 1994; Stubbe
and Kopka, 1990).
The DP is very sensitive to small changes in f0 and has
been observed only for f0near nfce, where fce is the
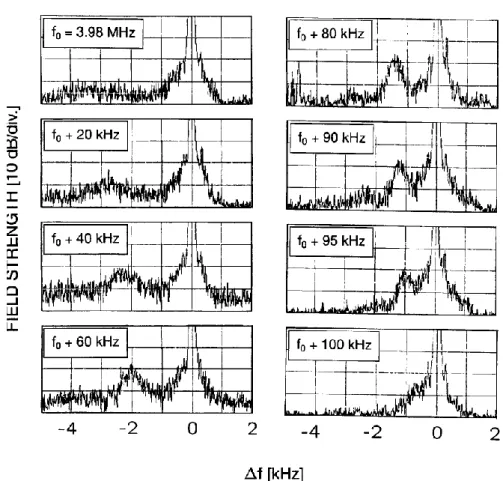
elec-tron gyrofrequency and n=3, 4, or 5 (Stubbe and Kopka, 1990; Stubbe et al., 1994). The strongest DP emissions have been observed in experiments at Tromsø for f0=4.04 MHz,
which is near 3fce (see Fig. 1), but the DP has also been
seen at n=4 and 5 (Stubbe and Kopka, 1990). Emissions
resembling the DP have been recorded in experiments at Arecibo for f0=5.10 MHz (Thid´e et al., 1989) and at HIPAS
for f0=3.349 MHz (Armstrong et al., 1990). The DP has
sometimes been seen along with one or two cascade lines at frequency offsets downshifted from the pump at multiples of the DP offset frequency (Leyser et al., 1990). In addition, a weak upshifted peak (UP), with absolute frequency offset close to that of the DP, has been observed near 3fce(Stubbe
et al., 1984; Leyser, 2001). The DP has not been as thor-oughly studied as many of the other SEE spectral features (Leyser et al., 2001).
2 Technique and experiment description
This ionospheric modification experiment discussed here was carried out using the powerful HF transmitter at Ram-fjordmoen near Tromsø, Norway (69.6◦N, 19.2◦E, L=6.2, magnetic dip angle 78◦) and a multi-channel digital
receiv-ing system designed for high-resolution interferometric mea-surements of radio signals (Isham et al., 2005). A technical description of the HF transmitter facility and its parameters can be found in Rietveld et al. (1993). In brief, the facility is capable of transmitting at frequencies between 3.85 and 8 MHz with a maximum effective radiated power (ERP) of up to either 300 MW or 1.2 MW (peak and CW), depending on the antenna array employed. Linearly or circularly polar-ized waves in either ordinary or extraordinary mode can be transmitted.
SEE was discovered and has most often been measured using a spectrum analyzer connected to an HF receiving an-tenna (Thid´e et al., 1982). Although spectrum analyzers provide only moderate (several-second) time resolution, they have a large 120-dB or greater dynamic range, which is use-ful for detecting weak SEE signals lying near the ionospher-ically reflected (and possibly ground-path-propagated) pump wave, which may have 100 dB greater power than the SEE sidebands. For greater time resolution, digital systems may be used, and, for interferometry, digital recording of the raw data is a great advantage. Although they provide the best pos-sible time resolution, the dynamic range of digital systems is limited by the number of bits available in their analog-to-digital converters (ADCs). Current analog-to-digital systems typically use 14-bit ADCs, which provide 78 dB of dynamic range. An additional 20 or more dB can be obtained through the use of a filter to notch out the pump frequency.
For the interferometric SEE observations described here, a coherent four-channel 14-bit digital receiver was con-structed by the Polar Geophysical Institute in Murmansk, Russia. The receive frequency is tunable between 1.5 and 32 MHz, and notch filters at 4040.0, 4544.0, 4912.8, 5423.0, and 5752.0 kHz are available for use with the corresponding pump frequencies. The attenuation of the notch filters at their center frequencies is not less than 55 dB.
Fig. 1. The behaviour of the downshifted peak (DP) near the third gyroharmonic. Note that the frequency scale of the plots is limited to just
to a few kHz in width. The plot was made using data obtained by the Tromsø HF facility in November 1989. Reproduced from Stubbe and Hagfors (1997).
The intermediate frequency (IF) output of each channel is centered at 2450 kHz and is about 300 kHz in bandwidth. Switching the IF band center into a given pump position is achieved by the internal frequency synthesizer controlled by a computer. The four separate coherent channels can be fed either by a stable local or external oscillator. After the IF stage the signals enter the 14-bit ADC and the digital down converter (DDC) modules. Each of the modules has two co-herent channels. The data acquisition is performed at the sampling rate of 60 million real samples per second per chan-nel. After a 32-times decimation in the DDC modules the re-sulting sampling frequency is 1.875 MHz. During a 4-s data recording cycle the I and Q components from each channel are collected into memory at a rate of 30 MB/s, then during about 2.5 additional seconds the data are stored to a computer hard disk.
For the simplest interferometric observations, two of the channels can be connected to two simple HF dipoles. If two crossed dipoles are available, the four individual elements can be connected to the four receiver channels.
Alterna-tively, more complicated antenna geometries could make use of four spaced linear dipoles connected to the four channels. Although the receiving system currently has four coherent channels, it may be expanded to up to eight channels, and in that case four crossed dipoles or eight simple dipoles could be used.
Since raw voltage samples are recorded, the phase angle between the channels may be varied to any desired value, thus allowing the interference pattern of the antennas to be scanned, for example, between vertical and field aligned, as-suming appropriate placement of the SEE receiving anten-nas. If in doing so the relative or absolute strengths of the SEE features are seen to vary with angle, the results may be compared to radar, optical, and other measurements, and to theoretical and modeling results, with the goal of determing the relative importance and functions of the various in-teraction processes in producing HF pump-induced phenom-ena. Alternatively, the cross phase angle between channel pairs may be computed and converted to a direction of ar-rival, which is the method used for the results presented here.
1822 E. D. Tereshchenko: Directional features of the downshifted peak
Fig. 2. Antenna layout in the SEE experiment.
The interferometer antenna layout is shown in Fig. 2. The geographical coordinates of the antenna field are 69.63◦N and 19.52◦E, located 12.8 km east northeast of the HF trans-mitter. The antennas are linearly-polarized 27.43-m-long folded dipoles, tuned to 54.86-m wavelength or 5.468-MHz center frequency. The dipoles were mounted horizontally approximately 4.5 m above the ground with the axes in the east-west direction; the dipole pattern thus had –3-dB points at zenith angles of about ±30◦in the east-west direction and
±45◦north-south. These figures determine the field-of-view of the instrument. Within the band of available HF pump fre-quencies (about 4 to 8 MHz, corresponding to wavelengths of 75 to 37.5 m), the dipole pattern changes very little; in ad-dition, these figures are not sensitive to the exact mounting height above the ground.
As shown in Fig. 2, the antenna baselines were arranged in the north-south direction with 55.6-m spacing and in the east-west direction with 50.2-m spacing. The spacing of about 50 m between antenna pairs means that a desired 1◦precision
in direction of arrival requires the error in phase difference between antennas to be less than 4.2◦for 4 MHz (the lowest
pump frequency) and less than 8.4◦for 8 MHz (the highest pump frequency). As can be seen in the phase data shown in Fig. 7 below, these error levels, and thus the goal of 1◦ precision, are relatively easily achieved. The antenna spacing also means that direction of arrival cannot alias (i.e. phase difference >360◦) at 4 MHz. Aliasing can occur at 48.6◦ from zenith at 8 MHz, but this is well beyond what we expect to see based on the beamwidth and pointing angles of the HF pump beam. The cable lengths from the antennas to the receiver are equal.
Here we present some results from SEE measurements performed on 6 October 2004 between 15:30 and 15:46 UT. The beam of the HF facility was scanned in 7◦ steps be-tween the vertical position and 21◦south. The transmitter was operated at 4040 kHz using 12 transmitters on array 2
Fig. 3. The absolute angle between the direction of the center of
the HF antenna beam and the geomagnetic field for beam directions 0◦, 7◦, 14◦, and 21◦south at an altitude of 250 km. The center of the beam, which is 13.6◦wide at half power, does not quite reach field-aligned because of the orientation of the HF antenna along geographic north.
resulting in about 164 MW ERP with 14◦ 3-dB full beam width, and with a scanning cycle of 4 min on each posi-tion: 0◦ pointing at 15:30 UT, 7◦ south at 15:34 UT, 14◦ south at 15:38 UT, and 21◦ south at 15:42 UT. The trans-mitter modulation was 1536 ms on every 4 s, continuously repeated. Just before, from 15:26 to 15:30 UT, the HF pump had been turned off, and prior to that it had been transmitting for 384 ms every 4 s. Figure 3 shows the angle between the direction of the HF antenna beam and the geomagnetic field for the above-mentioned beam positions at the ionospheric altitude of 250 km, which corresponds to the height of the pump interaction region as determined from ionosonde data. The procedure used to study the DP using the raw data is as follows. Raw data (4-s SEE voltage sample) records were first divided into 0.28-s non-overlapping intervals. Intervals lying completely within a 1.536-s pump-on pulse were then used to calculate the coherence matrix. Each selected interval was divided into 16 17.5-ms non-overlapping segments and the power spectra, coherence (normalized cross spectra) and (cross-phase) spectra were calculated and then averaged for 0.28-s in order to decrease the incoherent noise level. All ele-ments of the coherence matrix were then calculated (Marple, 1987). The frequency resolution of the measured spectra is thus (17.5 ms)−1or ∼57 Hz. In order to confidently deter-mine the source locations of the DP component, we then se-lected only measurements having high coherence (near to 1) at the frequency of the DP maximum level (4038.2 kHz).
The top panels of Fig. 4 show the unnormalized coherence curves computed using data from receiver channels 1 and 2 (top left panel) and 2 and 3 (top right panel) with notch fil-ters at 4040 kHz and a signal provided by a wide-band noise
Fig. 4. These plots show cross power (unnormalized coherence) curves calculated from raw voltage samples from the north–south (left
panels) and west–east (right panels) receiver pairs. The top row of spectra were made using a noise generator with the 4040-kHz notch filters connected to each receiver. The bottom panels show the corresponding experimental SEE cross power spectra, measured 6.5 min after the pump on time at 15:30 UT on 6 October 2004, using the 4040-kHz notch filters with the pump transmitting at 4040 kHz. The vertical line is plotted at 4038.8 kHz, slightly below the filter cutoff frequency.
generator. The bottom panels of Fig. 4 show correspond-ing stimulated emission spectra measured 6.5 min after the pump on time at 15:30 UT on 6 October 2004. The pump frequency peak is strongly attenuated by the notch filters but is still visible as a spike in the central spectral gap which has a width corresponding to the narrow bandwidth of the notch filter. The DP component is clearly observed in the spectra at 4038.2 kHz, to the left of the 4040.0-kHz pump. Taking into account the frequency response of the notch filters (top panels), it can be seen that the filters do not affect the DP component because the DP is observed 1.8 kHz below the pump frequency while the lower cut-off of the notch filters is significantly higher in frequency.
3 Results
The results of the data processing described in Sect. 2 are presented below. Figure 5 shows the SEE power spectral densities (PSD, in dB) above the noise level (0 dB) for the three antennas (north, south, and west – see Fig. 3) at pump times (from top to bottom) of 2.5, 6.5, 10.5, and 14.5 min from 15:30 UT and pump antenna beam directions (from top to bottom) of 0◦, 7◦, 14◦, and 21◦ south. The pump
fre-quency was 4040 kHz. As described in the previous section, the pump peak is greatly attenuated by the notch filters. The DP component is clearly observed in the spectra just to the left of the pump. The DM and its harmonic, the 2DM, are the second and third peaks to the left of the pump. An under-lying narrow continuum (NC) can also be seen, occupying the frequencies between 4025 and 4045 kHz (on both sides of the pump). Although in Fig. 5 the DP is seen to be super-imposed on what appears to be a fairly substantial NC, the power density is plotted on a log scale and it can be seen that the DP is responsible for most of the signal measured near the peak of the DP enhancement.
Figure 6 shows the time variation of the power spectral density of the SEE DP component for the three antennas. The DP is located at 4038.2 kHz (1.8 kHz below the pump frequency). It can be seen that at 15:30 UT (at 0 min), and at each on time thereafter, the DP component typically grows for 1 to 2 min, then its strength becomes stable for each an-tenna position. However, the level of the DP strength varies for different pump beam angles. The maximum level of the DP was observed for 7◦ south. A significant part of de-crease in amplitude at the 21◦pump angle is likely due to the downward reflection of main part of the pump beam before
1824 E. D. Tereshchenko: Directional features of the downshifted peak
Fig. 5. SEE power spectral densities for the north (left column), south (central column), and west (right column) antennas at four different
times and pump antenna beam directions. Both the DP component and the narrow continuum (NC) are clearly seen in the SEE spectra. The time at the left of each plot refers to minutes after 15:30 UT on 6 October 2004. The beam direction is degrees south of vertical.
reaching the upper-hybrid level, where SEE is thought to be generated, thus reducing the possibility for SEE excitation. The noise values in the gaps between the 1.536-s pump-on periods are not shown in the figure.
Figure 7 shows the time variations of the phase difference angles of the SEE DP component for the north-south (left plot) and east-west (right plot) antenna pairs, while Fig. 8 il-lustrates the source locations of the DP component estimated from the phase difference angles (dots) along with contours of the angle between the beam direction and the geomag-netic field at 250 km (solid lines). Squares show the mean positions of the DP for each of the HF beam directions. Data for the final 3 min of each 4-min beam position dwell period is shown in the figure. It is interesting that the source region for pump pointing near magnetic field-aligned (14◦ south) appears to be offset towards the east by approximately 1.5◦ relative to the other positions. This could point to an interest-ing feature of the DP spatial emission pattern that depends on the maximum pump power density being near field-aligned. However, thus far this is the only data showing either the presence or absence of this effect.
SEE measurements at 4.04 MHz were performed for a to-tal of 4.5 h spanning 6 days in different modes of the HF pump. The 6 October was a good day on which 16 scans using 4 different heater pulse durations over an interval of nearly 2 h were performed. Although in the paper we present only the longest pump pulse duration variant, the DP was also seen in 12 other scans using shorter pulse durations.
In order to interpret the source directions properly, we should consider how the pump beam changes with pointing angle. In Table 1 are presented the calculated antenna gains in the main beam directions and the gains in the direction that the DP was found to be strongest for each of the pump scan directions. The results suggest that the “degradation” of the pump beam as it was tilted south is not significant. The figures seem to support the idea that the movement of the DP position was due to the weighting by the pump power pat-tern, i.e. a convolution of where the DP “wants” to be and the pump power pattern.
Fig. 6. Time variations of the power spectral density (PSD) of the SEE DP component for the three antennas, with zero dB corresponding
to the noise level. Vertical lines show the times of the HF beam position changes while the text indicates the angle of the HF beam position. The time scale is in minutes from the initiation of pump modulation 1536-ms-on every 4 s at 15:30 UT.
Fig. 7. Time variations of the phase difference (cross phase) of the SEE DP component for the two orthogonal antenna pairs. Vertical lines
show the times of the HF beam position changes while the text indicates the angle of the HF beam. The time scale is in minutes from the initiation of pump modulation 1536-ms-on every 4 s at 15:30 UT.
4 Conclusions
This paper reports on some results of an HF ionospheric modification experiment carried out between 25 September and 8 October of 2004 using the EISCAT HF transmitter. The relative and absolute strengths of stimulated electromagnetic emission features induced by a powerful HF pump wave were recorded in the vicinity of the HF transmitter by com-bining three receiving antennas as two interferometer pairs, in the meridional and latitudinal directions, using a multi-channel coherent raw data digital receiver. The HF transmit-ter operated at 4040 kHz in a repeating pattransmit-tern of 1536-ms-on every 4 s, and its antenna beam was scanned at 0◦, 7◦, 14◦, and 21◦south from vertical, beginning a new position every 4 min. In order to increase the dynamic range of the
receiv-ing system the pump frequency was attenuated through the use of a notch filter. Due to its narrow frequency bandwidth, the filter did not obscure the downshifted peak (DP) compo-nent, and the dependence of the location of the DP emission region on the aspect angle of the HF pump wave has been presented.
While the position of the DP component of the SEE spec-trum did shift somewhat in response to the changing angle of the HF pump beam, its position remained between 2.5◦north and 5◦south of the magnetic zenith for the entire 21◦range of beam positions, with the peak intensity occurring between 1◦ and 2◦south, corresponding to 7◦south pump beam pointing. This suggests that the DP may have a “preferred” position, perhaps just south of field-aligned, which shifts in response
1826 E. D. Tereshchenko: Directional features of the downshifted peak
Table 1. Calculated antenna gains compared to an isotropic radiator (in dBi) for the main beam direction and the mean direction where the
DP was found.
Pump pointing Pump gain mean DP direction pump gain in DP direction 0◦S 22.78 dBi 11.5◦S 12.6 dBi
7◦S 22.74 dBi 15.5◦S 18.2 dBi 14◦S 22.60 dBi 17.0◦S 21.8 dBi 21◦S 22.18 dBi 19.0◦S 22.0 dBi
Fig. 8. Intensity-weighted average locations of the downshifted peak (DP) source region estimated from the phase difference angles (dots)
are shown along with contours of the angle between the pump beam direction and the geomagnetic field at 250 km (solid lines). The squares show the mean positions of the DP for each of the HF beam directions while the labels indicate the corresponding pump beam pointing. 0◦south (i.e. vertical) pump beam pointing began at 15:30 UT, 7◦south at 15:34 UT, 14◦south at 15:38 UT, and 21◦south at 15:42 UT. The average location varied from about 2.5◦north to 5◦south of magnetic zenith (located at the center of the contour circles), with the three positions closest to field-aligned having the strongest signal intensities (see Fig. 6). Note also the approximately 1.5◦eastward offset of the weighted DP source region position for pump pointing near magnetic field-aligned (14◦south) as compared to the other beam positions.
to the power distribution in the pump beam pattern. The mea-sured angles, however, are intensity-weighted averages over the total DP emission region, so the DP source region may in fact be significantly extended in solid angle. In addition, there is a 1.5◦eastward offset of the weighted DP source re-gion position for pump pointing near magnetic field-aligned (14◦south) as compared to the other pump beam positions.
This could point to an interesting feature of the DP spatial emission pattern that depends on the maximum pump power density being near field-aligned. However, thus far this is
the only data showing either the presence or absence of this effect. At each beam position the DP component signal in-tensity typically increased to stable values during the first 1 to 2 min after the first pump-on in that position; here “on” in-dicates that the pump modulation was 1536-ms-on repeated every 4 s.
These data suggest that observations of the spatial varia-tion in SEE emissions can provide new informavaria-tion on the wave interaction and turbulent processes occurring in the pump-plasma interaction region. This information would
certainly be important in helping to identify SEE excitation mechanisms and their relation to the observational and theo-retical properties of Langmuir and upper-hybrid turbulence.
Acknowledgements. The support of the EISCAT Scientific
Associ-ation, which made it possible to perform the experiment, is grate-fully acknowledged. The EISCAT Scientific Association is sup-ported by the Suomen Akatemia of Finland, the Centre National de la Recherche Scientifique of France, the Max-Planck Gesellschaft of Germany, the National Institute of Polar Research of Japan, the Forskningsr˚ad of Norway, the Naturvetenskapliga Forskningsr˚ad of Sweden, and the Particle Physics and Astronomy Research Council of the United Kingdom. The present work was financially supported by the University of Tromsø under the Agreement of the Scientific and Technical Cooperation between the Polar Geophysical Institute of the Russian Academy of Sciences and the University of Tromsø, signed on 24 October 2002. The work was also supported by IN-TAS grant 03-51-5583, by Russian Foundation for Basic Research grants 03-05-64937, 05-05-79063 and by Interamerican University of Puerto Rico. The authors are grateful to A. Galakhov for help in carrying out the experiment and A. V. Arkhipov and S. E. Shleev for their valuable comments and for help in adapting the ADC/DDC cards for the interferometer measurement.
Topical Editor M. Pinnock thanks E. Mjølhus and another ref-eree for their help in evaluating this paper.
References
Armstrong, W. T., Massey, R., Argo, P., Carlos, R., Riggin, D., Che-ung, P.-Y., McCarrick, M., Stanley, J., and Wong, A. Y.: Continu-ous measurement of stimulated electromagnetic emission spectra from HF excited ionospheric turbulence, Radio Sci., 25, 1283– 1289, 1990.
Barr, R.: The generation of ELF and VLF radio waves in the iono-sphere using powerful HF transmitters, Adv. Space Res., 21, 677–687, 1998.
Bernhardt, P. A., Tepley, C. A., and Duncan, L. M.: Airglow en-hancements associated with plasma cavities formed during iono-spheric heating experiments, J. Geophys. Res., 94, 9071–9092, 1989.
Derblom, H., Thid´e, B., Leyser, T. B., Nordling, J. A.,. Hedberg, ˚A., Stubbe, P., Kopka, H., and Rietveld, M.: Tromsø heating exper-iments: stimulated emission at HF pump harmonic and subhar-monic frequencies, J. Geophys. Res., 94, 10 111–10 120, 1989.
Frolov, V. L., Sergeev, E. N., Ermakova, E. N., Komrakov, G. P., and Stubbe, P.: Spectral features of stimulated electromagnetic emis-sion measured in the 4.3–9.5 MHz pump wave frequency range, Geophys. Res. Lett., 28, 3103–3106, 2001.
Honary, F., Robinson, T. R., Wright, D. M., Stocker, A. J., Rietveld, M. T., and McCrea, I.: First direct observations of the reduced striations at pump frequencies close to the electron gyroharmon-ics, Ann. Geophys., 17, 1235–1238, 1999.
Isham, B., Hagfors, T., Khudukon, B. Z., Yurik, R. Y., Tereshchenko, E. D., Rietveld, M. T., Belyey, V., Grill, M., La Hoz, C., and Heinselman, C.: An interferometer experiment to explore the aspect angle dependence of stimulated electromag-netic emission spectra, Ann. Geophys., 23, 55–74, 2005. Leyser, T. B., Thid´e, B., Derblom, H., Hedberg, ˚A., Lundborg, M.,
Stubbe, P., and Kopka, H.: Dependence of stimulated electro-magnetic emission on the ionosphere and pump wave, J. Geo-phys. Res., 95, 17 233–17 244, 1990.
Leyser, T. B.: Stimulated electromagnetic emissions by high-frequency electromagnetic pumping of the ionospheric plasma, Space Sci. Rev., 98, 223–328, 2001.
Marple Jr., S. L.: Digital spectral analysis with applications, Prentice-Hall, 172–284, 1987.
Rietveld, M. T., Kohl, H., Kopka, H., and Stubbe, P.: Introduction to ionospheric heating at Tromsø – I. Experimental overview, J. Atmos. Terr. Phys., 55, 577–599, 1993.
Stubbe, P., Kopka, H., Thid´e, B., and Derblom, H.: Stimulated elec-tromagnetic emission: a new technique to study the parametric decay instability in the ionosphere, J. Geophys. Res., 89, 7523– 7536, 1984.
Stubbe, P. and Kopka, H.: Stimulated electromagnetic emission in a magnetized plasma: A new symmetric spectral feature, Phys. Rev. Lett., 65, 183–186, 1990.
Stubbe, P., Stocker, A. J., Honary, F., Robinson, T. R., and Jones, T. B.: Stimulated electromagnetic emission and anomalous HF wave absorption near electron gyroharmonics, J. Geophys. Res., 99, 6233–6246, 1994.
Stubbe, P. and Hagfors, T.: The earth’s ionosphere: a wall-less plasma laboratory, Surv. Geophys., 18 (1), 57–127, 1997. Thid´e, B., Kopka, H., and Stubbe, P.: Observations of stimulated
scattering of a strong high-frequency radio wave in the iono-sphere, Phys. Rev. Lett., 49, 1561–1564, 1982.
Thid`e, B., Derblom, H., Hedberg, ˚A., Kopka, H., and Stubbe, P.: Observations of stimulated electromagnetic emissions in iono-spheric heating experiments, Radio Sci., 18, 851–859, 1983. Thid´e, B., Hedberg, ˚A., Fejer, J. A., and Sulzer, M. P.: First
obser-vations of stimulated electromagnetic emission at Arecibo, Geo-phys. Res. Lett., 16, 369–372, 1989.