HAL Id: cea-02978503
https://hal-cea.archives-ouvertes.fr/cea-02978503
Submitted on 26 Oct 2020HAL is a multi-disciplinary open access archive for the deposit and dissemination of sci-entific research documents, whether they are pub-lished or not. The documents may come from teaching and research institutions in France or abroad, or from public or private research centers.
L’archive ouverte pluridisciplinaire HAL, est destinée au dépôt et à la diffusion de documents scientifiques de niveau recherche, publiés ou non, émanant des établissements d’enseignement et de recherche français ou étrangers, des laboratoires publics ou privés.
Corrosion behaviour of Mg alloys cladding from nuclear
reactors fuel in alkaline solutions
J. Agullo, B. Muzeau, Christian Bataillon, V. l’Hostis
To cite this version:
J. Agullo, B. Muzeau, Christian Bataillon, V. l’Hostis. Corrosion behaviour of Mg alloys cladding from nuclear reactors fuel in alkaline solutions. EUROCORR 2014 - European Corrosion Congress, Sep 2014, Pise, Italy. �cea-02978503�
Corrosion behaviour of Mg alloys cladding from nuclear reactors
fuel in alkaline solutions
J. Agullo, B. Muzeau, C. Bataillon, V. L’Hostis, CEA Saclay, Gif-sur-Yvette/France
Summary
The reprocessing of spent fuel from the French UNGG (Graphite Gas Natural Urani-um) nuclear power plants generates cladding wastes such are Mg-Mn alloys. A stor-age strategy is to encapsulate these wastes into cement matrix. The main issue is hydrogen evolution as the main consequence of the corrosion of Mg alloys, regard-less of concrete radiolysis. In fact Mg acts as an anode in most of galvanic corrosion systems and the hydrogen can be produced either by water reduction or by Anodic Hydrogen Evolution (AHE). In the last case, an increase in the rate of hydrogen pro-duction with increasing applied potential is observed. This phenomenon called “Neg-ative Different Effect” (NDE) is in contradiction with the conventional Tafel equation. The corrosion of magnesium may produce Mg+ cations which react quickly with water to produce hydrogen and stable Mg2+ cations.
The interstitial solution in concrete pores is characterized by a very high pH. To re-produce the pH solution around 13, 0.1M NaOH solutions were prepared and used as electrolytes from electrochemical experiments. Stainless steel, platinum and graphite were used as cathode to investigate basic galvanic coupling as it can be encountered in the real wastes.
The purpose of this work was to investigate the galvanic corrosion of Mg alloys in the high pH solutions. The study of Mg corrosion behaviour was carried out using elec-trochemical measurement: ZRA mode. The analysis of the surface and the corrosion products were performed by Raman spectroscopy. The first results showed a galvan-ic corrosion rate more important with stainless steel rather than with graphite.
1
Introduction
The reprocessing of spent fuel from the French UNGG (Graphite Gas Natural Urani-um) nuclear power plants generates decanning wastes. Cladding wastes are made of metal uranium rod sheathed with magnesium alloys. Two types can be distinguished: the body cladding of the assembly with Mg-0.8wt.%Zr and the two exhaust caps with Mg-wt.1.2%Mn. The packaging of these wastes considered so far is based on their immobilization in an hydraulic binder. Several have been tested (RHEOMAC, white OPC, white OPC with blast furnace slag, fly ash cement, C3S, Geopolymer, etc.., in
paste or mortar) [1-5]. In all cases, they imply that the wastes are exposed to a highly alkaline environment (pH> 12) and subjected to heat of hydration. Some Mg alloy decanning wastes could be into direct contact with graphite from the fuel assemblies or steel from the container leading to an electrical coupling. The presence of an elec-trolyte, like the interstitial solution of the cement matrix, allows the realization of an electrical circuit involving galvanic corrosion phenomena [5]. Since Mg acts as an anode in most of galvanic corrosion systems its corrosion rate will be accelerated. In
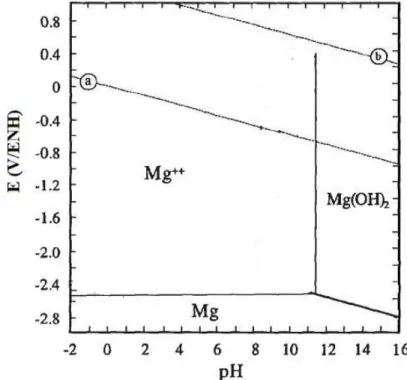
fact thermodynamically Mg is very reactive with a normal potential of -2.36 V/NHE (Normal Hydrogen Electrode) [6]. An E-pH diagram can predicted the thermodynamic stability or tendency for corrosion of Mg in water.
Figure 1: E-pH diagram of Mg in aqueous solution at 25 °C.
The lines a and b identify the reaction of hydrogen and oxygen evolution, respectively [7].
In alkaline media the different reaction at the equilibrium potential are the following: Anodic reaction: Mg → Mg2+ + 2e- (eq. 1)
Chemical reaction: Mg2+ + 2HO- → Mg(OH)2 (eq. 2)
Cathodic reaction: 2H2O + 2e-→ H2 + 2HO- (eq. 3)
Overall reaction: Mg + 2H2O → Mg(OH)2 + H2 (eq. 4)
Unfortunately in the Mg case thermodynamic data cannot effectively predict phe-nomena that come into play during its corrosion. It must take into account all the ki-netic aspects which are determinant in Mg corrosion behaviour [8].
The anodic process of Mg is still in discussion because it exhibits behaviour in con-tradiction with the conventional Tafel equation. In fact, an increase in the rate of hy-drogen production with increasing applied potential is observed. This phenomenon is called “Negative Different Effect” (NDE) [9]. A hypothesis proposes that the corrosion of magnesium may produce Mg+ cations (eq. 5) which react quickly with water to produce hydrogen and stable Mg2+ cations (eq. 6).
Anodic reaction: Mg → Mg+ + e- (eq. 5)
Concerning the cathodic process, oxygen reduction and hydrogen evolution should be considered in basic media. However in the case of Mg dissolved oxygen does not play an important role and hydrogen evolution is the main cathodic process (eq. 3). It appears that hydrogen evolution can be produced either by water reduction (eq.3) or by Anodic Hydrogen Evolution (AHE, eq. 6). Galvanic coupling of Mg acting as an anode could involve a rapid evolution of hydrogen and corrosion of Mg. The main issue is hydrogen evolution as the main consequence of the corrosion of Mg alloys, regardless of concrete radiolysis. Uncontrolled hydrogen production could have dele-terious consequences for the package, such as cracking of the embedding matrix and increase the risk of fire in the storage area. The other issue is the accumulation of solid corrosion products which could cause the development of sufficient expan-sive force to deform the waste containers [5]. According to the E-pH diagram in alka-line media and due to dissolution of Mg and hydrogen evolution, the Mg surface be-comes more alkaline than the bulk solution involving a deposit of Mg(OH)2 on the
surface.
The purpose of this work was to investigate the galvanic corrosion of Mg alloys in the high pH solutions with platinum, graphite and stainless steel 304L. Platinum was chosen as noble metal, graphite is present in the wastes and stainless steel 304L may also be found in the wastes. The study of Mg corrosion behaviour was carried out using electrochemical measurement: ZRA measurement. The analysis of the sur-face and the corrosion products were performed by Raman spectroscopy.
2
Materials and experimental
Galvanic corrosion was achieved by coupling the pairs of metals together via a Zero Resistance Ammeter (ZRA). The galvanic current of the coupled metal was meas-ured over time. Electrochemical measurements were carried out at room temperature in a flat cell provided by Gamry Instruments in a three-electrode configuration with a Gamry PCI4/300 potentiostat. An Hg/HgO (0.1M NaOH) reference electrode (E° = 0.165 V/NHE) was used for all experiments in 0.1M NaOH for electrolyte. A nominal area of 2.6 cm2 defined by the Gamry Flatcell setup were exposed to the solution. The anode electrode consisted of Mg-Mn alloy (Mg 99.2wt.% and Mn 0.8wt.%). The cathode was constituted of a platinum gauze (>99.99%, Alfa Aesar), graphite from the G2 reactor (French UNGG reactor) or stainless steel 304L. The Mg-Mn surface was cleaned by polishing with ethanol on SiC Grinding paper in different roughness between 180 to 800 grit (Struers). Then, the electrode was rinsed with ethanol and dried with KIMTECH brand wipers and stored in desiccator in the presence of silica gel. All solutions were prepared using Mili-Q deionized water (ρ > 18.2 MΩ.cm-1) and all the experiments were carried out at a room temperature.
Raman spectra were recorded with an X’plora Raman spectrometer (Horiba-Jobin Yvon) using a laser at λ = 532 nm and a 600 lines/mm grating.
2
Results and discussion
1 Influence of the stabilization of the electrochemical system with galvanic
coupling
The first system investigated is composed of an Mg alloy anode and a platinum cath-ode electrcath-ode with an Hg/HgO (NaOH 0,1M) reference electrcath-ode. Platinum was cho-sen initially for guidance because it is a noble metal that has a well-documented be-haviour. The goal of this section is to estimate the influence of the stabilization sys-tem on its final state. Several sequences were performed by varying the time of stabi-lization of the electrochemical cell before performing a galvanic coupling. The corro-sion potential noted Ecorr was recorded for 0, 1 or 18h before switching to ZRA mode.
- Sequence 1: corrosion potential of 18h followed by a ZRA mode - Sequence 2: corrosion potential 1h followed by a ZRA mode - Sequence 3: direct ZRA mode
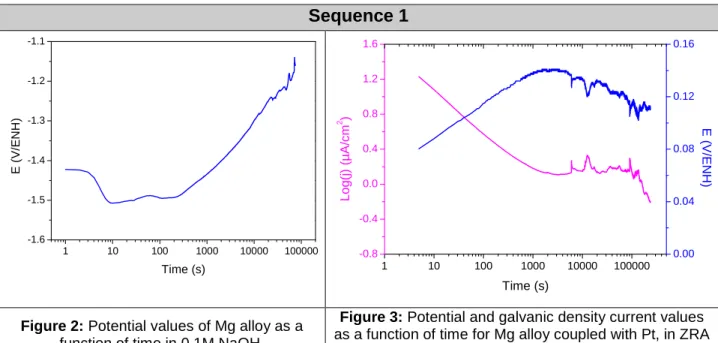
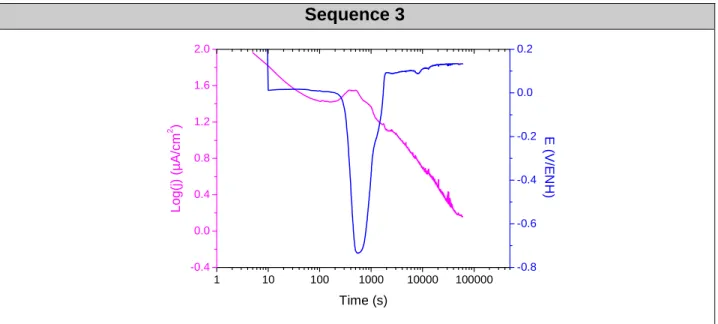
In the first two phases, the corrosion potential increases after 5 min of balance (see Figures 2 and 4). When galvanic coupling occurs, regardless of the stabilization time, a transient from 2 to 3000 seconds is observed (see Figures 3, 5 and 6). This regime reflects the start-up of the system. Generally during the experiment, when the current values decrease, potential values increase. This indicates a cathodic Butler-Volmer relationship, suggesting a cathodic control. The values of current density and poten-tial after the arbitrary value of 60 000 s (16h40) in ZRA mode are very close, about 0.134 V/NHE and 1.16 µA.cm-2. The system tends to the same final state. The same observations were made for Mg alloy systems coupled with graphite or 304L. The curves obtained have shown good reproducibility for the different sequences and dif-ferent couplings.
Subsequently, it was decided to impose a galvanic coupling system without stabiliza-tion. This cannot change the state of the electrode surface before the galvanic cou-pling and it is more representative of reality as contacts exist in the waste packages.
Sequence 1 1 10 100 1000 10000 100000 -1.6 -1.5 -1.4 -1.3 -1.2 -1.1 E ( V /E N H ) Time (s) 1 10 100 1000 10000 100000 -0.8 -0.4 0.0 0.4 0.8 1.2 1.6 Time (s) L o g (j ) (µ A /c m 2 ) 0.00 0.04 0.08 0.12 0.16 E ( V /E N H )
Figure 2: Potential values of Mg alloy as a
function of time in 0.1M NaOH.
Figure 3: Potential and galvanic density current values
as a function of time for Mg alloy coupled with Pt, in ZRA mode after 18h of stabilization in 0.1M NaOH.
Sequence 2 1 10 100 1000 10000 100000 -1.6 -1.5 -1.4 -1.3 -1.2 -1.1 E ( V /E N H ) Time (s) 1 10 100 1000 10000 100000 -0.8 -0.4 0.0 0.4 0.8 1.2 1.6 Time (s) L o g (j ) (µ A /c m 2 ) 0.00 0.04 0.08 0.12 0.16 E ( V /E N H )
Figure 4: Potential values of Mg alloy as a
function of time in 0.1M NaOH.
Figure 5: Potential and galvanic density current values
as a function of time for Mg alloy coupled with Pt, in ZRA mode after 1h of stabilization in 0.1M NaOH.
Sequence 3 1 10 100 1000 10000 100000 -0.4 0.0 0.4 0.8 1.2 1.6 2.0 Time (s) L o g (j ) (µ A /c m 2 ) -0.8 -0.6 -0.4 -0.2 0.0 0.2 E ( V /E N H )
Figure 6: Potential and galvanic density current values as a function of time for Mg alloy coupled with Pt,
in ZRA mode without stabilization in 0.1M NaOH.
2 Influence of the galvanic coupled material in the corrosion of magnesium
in aqueous media
The Figure 7 represents the galvanic density current values and the potential as a function of time for Mg alloy coupled with Pt, graphite or 304L in ZRA mode after transient regime.
10000 100000 -0.4 0.0 0.4 0.8 1.2 1.6 304L Graphite Pt Time (s) L o g (j ) (µ A /c m 2 ) 2000 Pt Graphite 304L -0.4 -0.3 -0.2 -0.1 0.0 0.1 0.2 E ( V /E N H )
Figure 7: Potential and galvanic density current values as a function of time for Mg alloy coupled with
Pt, graphite or 304L in ZRA mode after transient regime.
In our experimental conditions (anode/cathode area=1), galvanic coupling is under cathodic control. For each couple when current values decrease potential values in-crease. The potential values vary with the cathode, in ascending order for 304L, graphite and platinum. They can be treated as straight as a first approximation. Plati-num and graphite have a slope value very close and less than 304L.
The comparison of the curves obtained for the current density shows that the corro-sion kinetics appears to be close to the three cathodes used.
The current values at 60 ks indicate lower current density for graphite, platinum and 304L, respectively. It was rather expected that the values of current density are high-er for platinum, graphite and then to 304L. This would indicate greathigh-er corrosion ki-netics of these materials in this order.
The following equations allow the calculation of the amount of H2 that would be
re-leased and the corrosion rate in theoretical case.
m
H n V
V
2 = ⋅ (eq. 7)
with VH2 volume of gas formed (L), n number of moles (mol) and Vm molar volume
(22.4 L.mol-1).
Considering that 2 electrons are exchanged in the process of corrosion of magnesi-um, z = 2 and using the value of the molar mass of magnesium (M=24.305 g.mol-1) and its specific mass (ρ=1.74 g.cm-3), the relationship between the corrosion rate and the current density of corrosion is the following [2]:
corr
j
corrF
ρ
z
M
v
⋅
⋅
⋅
=
(eq. 8)with jcorr: current density of corrosion (A.cm-2),
vcorr: corrosion rate (m.y-1).
From the values after 60 ks of galvanic coupling and equations 7 and 9, the corrosion rates and the amount of H2 that would be released over a year can be calculated with
the following assumptions:
- The solution is assumed to be uniform, jcorr can be likened to j0, equilibrium current
density value,
- Two electrons are exchanged in the process of corrosion of magnesium according to equation 1,
- Hydrogen evolution from the cathode reaction of only one mole of Mg and corre-sponds to one mole of H2 (eq. 4)
Corrosion rates are on the order of a few tens of micrometers per year, which corre-sponds to the order of magnitude reported in the literature [5, 10]. However, the ex-trapolated values of the H2 generated volumes are relatively high as shown in the
table 1.
Table 1: Values of the current density and potential and the estimated corrosion rate of Mg alloy in galvanic coupling with platinum, graphite and 304L after 60 ks.
Couple
Values after 60 ks of ZRA Ecorr (V/ENH) jcorr (µA.cm-2) corrosion rate (µm.y-1) H2 gas formed (L.m-2.y-1) Mg alloy/Pt 0.133 1.45 33 53 Mg alloy/Graphite 0.072 0.41 9 15 Mg alloy /304L -0.213 3.16 72 116 3 Surface film
The figure 8 shows two samples of Mg alloy before and after galvanic coupling with graphite during 16h in 0.1M NaOH. The part of the sample in contact with the solu-tion was delimited by O-ring and presents a yellow-brown aspect. The same observa-tion was done for platinum and 304L.
Figure 8: Mg alloy sample before (on the left) and after (on the right) galvanic coupling with graphite
during 16h in 0.1M NaOH.
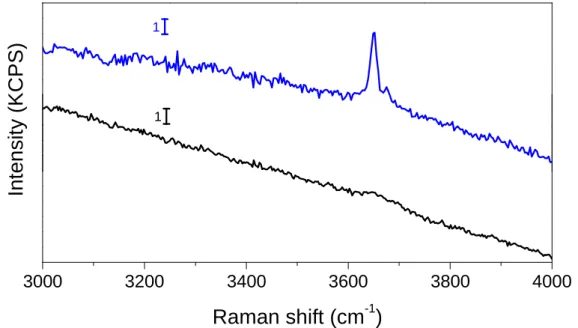
Brucite (Mg(OH)2) is expected to be found after the galvanic corrosion of Mg alloy [8,
11]. Brucite is characterized by Raman active O-H stretching vibration around 3650 cm-1 [12]. Raman spectra of Mg alloys before and after galvanic corrosion with plati-num, graphite and stainless steel were recorded. Similar spectra were obtained for all anodes after galvanic coupling with Mg alloy in alkaline media. Figure 9 presents the case of galvanic coupling with Pt. The presence of brucite is confirmed by the
detec-tion of the stretching vibradetec-tion at 3650 cm-1. No other corrosion products have been identified. 3000 3200 3400 3600 3800 4000
In
te
n
s
it
y
(
K
C
P
S
)
Raman shift (cm
-1)
1 1Figure 9: Raman spectra of Mg alloy before (in black) and after (in blue) galvanic coupling with Pt
during 16h in 0.1M NaOH.
4 Conclusion
In this study, a protocol for sample preparation of Mg alloy and procedure for moni-toring the values of potential and current with various galvanic coupling could be im-plemented. A classic basic solution of NaOH 0.1 M was chosen to perform the elec-trochemical measurements because it is the simplest case to reproduce pH of an interstitial solution of hydraulic binders in the case of encapsulation of Mg alloys. In this work, it was decided to carry out measurements in galvanic coupling with plati-num, graphite and stainless steel 304L without prior stabilization of the Mg alloy in the electrolyte. The values of potential and current obtained indicate Butler-Volmer relationship, suggesting a cathodic control. The potential values of the galvanic cou-pling vary with the cathode, in ascending order for 304L, graphite and platinum. In view of these potential values, it was expected that the galvanic coupling leads to higher corrosion rates for platinum, graphite and 304L, respectively. However, 304L has a very high current density (and thus a higher corrosion) in comparison to that expected. Estimated corrosion rates vary from ten to several tens of micrometers per year.
It is important to remember that in the case of galvanic corrosion, the amount of hy-drogen generated will be greater if the ratio between the cathode and the anode sur-face area is large, if the distance between these areas is small and if the conductivi-ties of the electrolyte and the film surface is large. It was therefore selected for further studies, use of area ratios cathode / anode of about 10 /1 in a cell with a suitable ge-ometry and performs measurements, always without any prior stabilization. This will place anodic control and maximize the corrosion of magnesium alloys. To better un-derstand the phenomena involved, measurements of H2 evolution and
electrochemi-cal impedance spectroscopy are also planned. Raman spectroscopy allows identify-ing brucite (Mg(OH)2) as corrosion product.
5 References
[1] G.A. Fairhall, J.D. Palmer, The encapsulation of Magnox Swarf in cement in the United Kingdom, Cement and Concrete Research, 22 (1992) 293-298.
[2] D. Lambertin, F. Frizon, A. Blachere, F. Bart, Corrosion Behaviour of Mg Alloys in Various Basic Media: Application of Waste Encapsulation of Fuel Decanning from UNGG Nuclear Reactor, in: Magnesium Technology 2011, John Wiley & Sons, Inc., 2011, pp. 435-439.
[3] J. Morris, S. Wickham, P. Richardson, C. Rhodes, M. Newland, Asme,
Contingency options for the drying, conditioning and packaging of Magnox spent fuel in the UK, 2010.
[4] A. Rooses, D. Lambertin, D. Chartier, F. Frizon, Galvanic corrosion of Mg–Zr fuel cladding and steel immobilized in Portland cement and geopolymer at early ages, Journal of Nuclear Materials, 435 (2013) 137-140.
[5] N.R. Smart, D.J. Blackwood, An investigation of the effect of galvanic coupling on the corrosion of container and waste metals in cementitious environments, AEAT-0251, issue C, in, 1998.
[6] G.G. Perrault, The potential-pH diagram of the magnesium-water system, Journal of Electroanalytical Chemistry and Interfacial Electrochemistry, 51 (1974) 107-119. [7] M. Pourbaix, Atlas of Electrochemical Equilibria in Aqueous Solutions, National Association of Corrosion Engineers, 1974.
[8] G.L. Song, Corrosion of Magnesium Alloys, Woodhead Publishing, 2011. [9] A. Atrens, W. Dietzel, The Negative Difference Effect and Unipositive Mg+, Advanced Engineering Materials, 9 (2007) 292-297.
[10] D. Lambertin, F. Frizon, F. Bart, Mg-Zr alloy behavior in basic solutions and immobilization in Portland cement and Na-geopolymer with sodium fluoride inhibitor, Surface & Coatings Technology, 206 (2012) 4567-4573.
[11] P.M. Bradford, B. Case, G. Dearnaley, J.F. Turner, I.S. Woolsey, Ion beam analysis of corrosion films on a high magnesium alloy (Magnox Al 80), Corrosion Science, 16 (1976) 747-766.
[12] B. Weckler, H.D. Lutz, Near-infrared spectra of M(OH)Cl (M = Ca, Cd, Sr),
Zn(OH)F, γ-Cd(OH)2, Sr(OH)2, and brucite-type hydroxides M(OH)2 (M = Mg, Ca, Mn,
Fe, Co, Ni, Cd), Spectrochimica Acta Part A: Molecular and Biomolecular Spectroscopy, 52 (1996) 1507-1513.