Detection Power, Temporal Response, and Spatial
Resolution of IRON fMRI in Awake, Behaving Monkeys at
3
Tesla
by
Francisca Maria Pais Horta Leite
Licenciada in Technological Physics Engineering
Technical University of Lisbon, 1997
Submitted to the Harvard-MIT Division of Health Sciences and Technology
in partial fulfillment of the requirements for the degree of
Doctor of Philosophy
at the MASSACHSTS 1NSTITUTE
OF TECHNOLOGY
MASSACHUSETTS INSTITUTE OF TECHNOLOGY
FEB 2 12007
September 2006
LIBRARIES
© Massachusetts Institute of Technology. All rights reserved.
ARCHIVES
Signature of A uthor...:
... . .. ...Harvard-MIT Division of Health Sciences and Technology
September 2 6th 2006
C ertified by .
...
f...
Joseph B. Mandeville, Ph.D.
Instructor in Radiology at HMS
Assistant in Physics at MGH/Radiology
Thesis supervisor
A ccepted by...
.
..y . .. . ...
\jV
Martha L. Gray, Ph.D.
Edward Hood Taplin Professoi of Medical and Electrical Engineering
Director, Harvard-MIT Divislon of Health Sciences and Technology
Detection Power, Temporal Response, and Spatial
Resolution of IRON fMRI in Awake, Behaving Monkeys at
3 Tesla
by
Francisca Maria Pais Horta Leite
Submitted to the Harvard-MIT Division of Health Sciences and Technology in partial fulfillment of the requirements for the degree of
Doctor of Philosophy in Medical Physics
Abstract
The main goal of this thesis was to systematically characterize the detection sensitivity, temporal response, and spatial resolution of IRON contrast for fMRI within the awake, behaving monkey. Understanding these issues provides insights into the physiology of the functional response to local changes in brain activity, enables researchers to optimize experimental designs, and delineates the advantages and limitations of neuroimaging within this important animal model.
The injection of the iron oxide contrast agent (MION) provided a 9-fold increase in eficiency for block designs relatively to BOLD contrast. Because the hemodynamic response function acts as a low-pass filter on neural activation to attenuate the size of differential responses to alternate stimuli, this factor dropped to approximately 2 for rapidly presented stimuli. Detection efficiency for event-related stimulus designs for BOLD and IRON contrasts could be optimized using random or semi-random distributions for interstimulus intervals. Small increases in predictability could be traded for large gains in efficiency, particularly for the IRON method.
A general linear model was successfully employed to describe IRON and BOLD impulse response functions. Both responses were accurately described by a bimodal exponential model with similar time constants, a fast (4.5 sec) and a slow (13.5 sec). The slow response comprised 80% of IRON signal, and was responsible for the BOLD post-stimulus undershoot. It likely encompasses changes in post-arteriole blood volume.
Optimized IRON activation maps do not show activation in draining veins or draining tissue, in contrast with BOLD contrast. To examine what happens at the level of small vessels and capillaries, we used point-image stimuli to measure IRON and BOLD point spread functions (PSF) in V1. We estimated an IRON PSF no larger than approximately 0.4 mm, and a BOLD PSF with twice the size.
Severe image distortions arising from monkey's body motion outside of the field of view currently limit the achievable spatial resolution. Preliminary data suggests multi-shot EPI with navigators may be useful in improving image stability at higher resolution for IRON fMRI, which can employ short echo times to minimize phase variations, while achieving maximum efficiency by increasing the MION dose.
Thesis Supervisor: Joseph B. Mandeville
Acknowledgments
The time has finally arrived. It is hard to believe that my never ending PhD is actually
coming to an end. It has been quite a journey. A journey whose positive outcome I owe first and
foremost to Joe Mandeville. There are no words to express how grateful I am for his unlimited
support, understanding and enthusiasm. Joe's office door is always open when I need advice, his
codes always changed within a minute's notice to make my life easier. What I have learned from
Joe is beyond imagination. His patience, tolerance and humility have inspired me as a researcher
and as an individual, and I have always been able to count on Joe's thoughtfulness and friendship
in some difficult periods of my life. Some moments are forever engraved in my mind: Joe and I
trying to get Falco's head through the opening of the chair, the most difficult task of my PhD;
watching drops of sweat running down Joe's nose while trying to inject MION in a monkey's
femoral vein (even if I was the one holding the needle); some comparatively relaxed moments at
the scanner, discussing strategies to reduce image distortions; the many talks we had in Joe's
office, which would not only address the most recent modifications to xdisplay, but would range
all the way from noise autocorrelation models, to finding Joe's childhood house in Montana with
Google maps, or giving me suggestions about where to go during my California road trip... For
all this and so much more, thank you Joe. It has been a great pleasure to work under your
supervision. I'll be waiting for your visit to Portugal so I can take you to "slurp sardines" while
drinking a Portuguese beer at some nice restaurant overseeing the beach, across the Atlantic from
the Martinos Center.
If it wasn't for Bruce Rosen, the director of such an impressive center as the Martinos Center,
to take time to read through his email and reply to some 24 year old student from Portugal, asking
if she could come to the center to conduct research towards a PhD degree from Portugal, I would
never have come to Boston in the first place. From that moment on, Bruce's support and
enthusiasm about my work at the center, my application first to MIT and later to HST, has only
increased. Bruce is the most enthusiastic person I know: every time I have the chance to spend
one hour in Bruce's office, my motivation sky rockets. Unfortunately this thesis does not end
with a paper in Science, but still, I hope you find I honored the amazing opportunity you gave me.
I would not have learned half of what I learned about MRI if it wasn't for Professor David
Cory. And more importantly, I think I only really started to appreciate the beauty of MRI after
sitting through 22.56J and preparing for my oral exam, both times under his supervision. It was
David Cory who first suggested that I should read the initial Peter Mansfield's papers introducing
k-space formalism in analogy to x-ray scattering. It was also David Cory who taught me about
product operators, and to make me almost want to switch to spectroscopy so I could apply what I was learning about quantum coherences. I also owe to Professor Cory supporting me through my successful application to HST, and to agree to serve in my thesis committee.
I am truly grateful to all the members of my thesis committee, Joe Mandeville, Bruce Rosen, David Cory, Tomaso Poggio and Roger Tootell, for all the constructive suggestions, valuable insight, and firm support demonstrated throughout the duration of my thesis work. I also acknowledge the financial support from Fundagdo para a Ciencia e Tecnologia (doctoral fellowship PRAXIS XXI BD/13473/97), and Fundagio Calouste Gulbenkian (doctoral fellowhip
no
43057).
Working with monkeys is not an easy task, and it would have been an impossible one without the excellent Monkey Group at the Martinos Center. If Wim Vanduffel hadn't relocated here, I doubt half of this thesis would have happened. My many thanks to Leeland Ekstrom, Tamara Knutsen, Reza Rajimehr, Mark Khachaturian, Hauke Kolster, Helen Deng, Lori Jasinski, John Arsenault, and the person who started it all, Doris Tsao.
Moving from Portugal to the Martinos Center, at the time the NMR Center at MGH, was facilitated because of people like Ken Kwong. Ken in the "glue" of the Martinos Center. Even though Ken has a nice office in the second floor, if you need to see him you can be sure you'll find him talking with the students, because that is where he loves to be. Rick Hoge was also incredibly helpful in my first months at the Center. Nouchine Hadjikhani was not only my first friend at the Martinos Center, but also the first person to make me feel at home in Boston. She introduced me to many people at the Martinos Center who greatly contributed in making my life there a lot easier and happier: Sari Levanen, Mette Wiegel, Dave Tuch, and Christian Haselgrove. There are many people I would, for one reason or another, like to acknowledge at the center: Larry Wald, Bruce Jenkins, Iris Chen, Tim Reese, Yuka Sasaki, Fa-Hsuan Lin, Doug Greve, Scott Packard, Christopher Moore, Randy Gollub, Jorge Jovicich, Paul Raines, Vicka Corey, David Covin, Sam Mehl, Thomas Benner, Christina Triantafyllou, Andreas Potthast, Chris Wiggins, Mary Foley, Jill Clark, Larry White, Simon Sigalovsky, and I am sure many others I am forgetting. I have also appreciated the help of Maria Angela Franceschini, George Themelis and Juliette Seib. Extremely important in the successful completion of this PhD have been Bruce's personal secretaries, especially Carol Barnstead and Linda Butler. Young "Superman" Kim always manages to put a smile on my face. I would also like to thank my fellow graduate students for all the support and help in many different aspects of my work at the center: Dan Wehner, Poe-Joe Chen, Leeland Ekstrom, Mark Khachaturian, Peng Yu, Shuning Huang, and Miriam Makhlouf. This list would not be complete without Leonardo Angelone, Cherif Sahyoun and
Megan Blackwell. You have been much more than colleagues; you are good friends who I know I
can always count on. Megan has been with me since the start, has accompanied me through the
highs and lows at the Martinos Center, at MIT, and in life. You are a special person, who I wish
all the best in your PhD. Oh, and of course, a special thanks to Rob Nabuurs, who convinced me
that everything is possible.
If there is something I am really proud of, it is to be a student at MIT. From the amazing
professors, to the helpful and caring staff, to the inspiring students, everything at MIT has
contributed to make my stay there, in the most amazing university campus I know, an
unforgettable experience. The professors and students at the Nuclear Engineering Department
were my first home at MIT. I would especially like to thank Professor Molvig for his truly
stimulating lectures, Professor Sow-Hsin Chen for a second chance, and Professor Alan Jasanoff
for attending by defense. Many were the students that started with me whom I like to
acknowledge, even though some of them are already applying to faculty positions while I am still
a mere graduate student (the bastards): Antonino Romano, Bilge Yildiz, Jacopo Saccheri,
amongst others. The best food I had for lunch at MIT I owe to Antonio Faraone, who has a
postdoc could take me to Pritchett's. And from the same period I cannot forget Cansu Tunca and
Ali Ergut.
HST is my home away from home. If it wasn't for Professor Roger Mark I would never have
applied to MEMP, one of the best decisions of my life. Cathy Modica, Domingo Altarejo, Ron
Smith, I will never forget you. Taking classes with HST faculty has greatly enriched my life, and
made be seriously consider applying to Medical School. But the most amazing experience was
ICM at Mount Auburn Hospital with Valerie Pronio-Stelluto. Furthermore, I have made many
good friends at HST. First and foremost, Blanca Himes and Jenny Mu, my companions in
Pathology and Anatomy. I truly hope we will always keep in touch. Riccardo Lattanzi and Lisa
Treat, you've made ISMRM even better! Nik Kojic has always succeeded in making me laugh,
even when I only wanted to cry. Caroline Boudoux, you make the best fruit salad. I would also
like to acknowledge Georg Gerber, Mike Hemond, Erika Wagner and Martin Zalesak.
If I had to guess, at the time I finished my degree in Portugal, that I would ever be admitted to
MIT, it would take me a million years. But now, looking back, I see how everything in my life
fell in place to take me where I am. Many people contributed to this endeavor. Professor Eduardo
Ducla-Soares was the first person to shift my attention to the field of Biophysics and Medical
Physics. His enthusiastic lectures have not only aroused my curiosity about functional
neuroimaging (amongst so many other subjects), but have also inspired me to pursue an academic
career. Professor Pedro Miranda was also instrumental in my successful application to MIT, and I
will always remember Professor Dinis Pestana and its amazing Statistics classes in the first year of my doctoral program in Portugal.
Studying at Instituto Superior Tecnico has been another extremely important factor putting me in this road whose end I now see. More than learning about Physics and Math, being a student in the Physics Department taught me how to think. Many were the Professors that inspired me at IST, and some of them I only truly valued when I was already at MIT.
I would also like to acknowledge Professor Gabriel Feio at the Instituto de Fisica Matematica, the first person to teach me about NMR, while supervising my final year project in IST.
This list would not be complete if I didn't mention a great teacher I had in High School: teacher Hernani made me love Physics and Math, and inspired me to always aim higher.
The research world has many problems, but attending conferences in paradisiacal places is the least of them. Every year new and old friends meet at the ISMRM conference. Hanging out with the Portuguese gang is always a pleasure: Ze "The Beatles' Hairdo" Pedro, Rita "Contagious
Laugh" Nunes, and Tiago "Nanni Moretti" Rodrigues, are part of the reason it is hard for me to think about leaving Science. I would also like to acknowledge Patricia Figueiredo and Mario Secca.
My life in the USA has been made a lot easier due to all the friends I have made here. One of the first was Ricardo Schiappa, who not only convinced me to apply to MIT, but also helped me immensely in the first few years.
My roommates throughout these last 7 years, Leonor Sarmento (and Manel!), Valentina Sequi and Birgit Schoeberl were a pleasure to live with, and became good friends. Thanks to Birgit I met amazingly nice people like Brit Assmus, Lilla Zollei, Helene Karcher and David Garcia-Alvarez, among others. With Birgit I started skiing regularly again, went surfing in the freezing New England waves, and organized awesome parties at our place. Wolfgang Bergmeier, Ellen O'Shaughnessy, Florian Altmann, regular attendants of our parties and ski companions, it's been wonderful meeting you. I would also like to acknowledge Juan Pedraza, the best salsa dancer I know, the always creative Yasmine Abbas, and the patient Franco Vairani.
The first Portuguese I met in the States was Luisa Marcelino, thanks to Lena Paveia. Thanks Luisa for all the helpful talks we had throughout the years. The second was Ines Sousa, who not only helped me find a house but also introduced me to PSA, the MIT Portuguese Student Association.
Portuguese in Boston - Cambridge are like grapes, you meet one you meet a whole bunch. And so far, the harvest as been amazing: Citia Fonseca and Beatriz Oliveira quickly became good friends; Nuno, Manela e Francisca, Francisco Veloso, Carla Vale, Cam6es, and many others from
those "ancient" first years; Jogo Rocha, always there; Rodrigo Miragaia, Sara Maia, Xana
Sanfins, Pedro Ferreira in the second round; Xana Frias, Ze "Fofo" Antio, In6s Baptista (Oh
Kiiiika!!), Cristina Nogueira, Pedro Carvalho and Inezinha, Joana Si, Joana Loureiro, Joana
Felgueiras, Andre Valente, are now good friends who I know I can count on, and regular party
companions. Inbal and Rui, you are such a special couple, I am so happy I met you! And the
ultimate dinner organizers: Miguel and his huge glasses of "water" and Rita, who never lets me
say no. Because of them, biking home at 6 am, after eating the most amazing fava beans, and then
"a bucha" around 4 am, has become common. Jumping on the sofa, dancing, and practicing hand
stands against the wall, are also frequent events. As are laughing, sharing and talking with Rita
about everything and about nothing, one more time realizing what a special person and a
wonderful friend she is.
Tiago: first we hated each other, then we were friends, then we weren't, then he took me to
Yoga, and then that dinner at Central Kitchen, and before I realized he was my best friend. In
Cambridge, somewhere in the Pacific Highway, in Portugal, in London, I know I can always
count on you to talk, to laugh, to jump ofjoy, or to take me out when I just want to cry in bed.
Talking of Portuguese in Boston, is talking of suffering and cheering for the Portuguese
Soccer Team. I made the promise, during the last world cup, that if Portugal won to Holland
(sorry Rob!) I would include Scolari in my acknowledgments. I do it with pleasure. I thank
Scolari, and Figo, and Ricardo, and all the amazing Portuguese players for showing us we can do
it, for uniting a country, for making us, emigrants in a strange land, feel more connected.
Even after an eternity abroad, my friends in Portugal still believe I will come back. And more
than that, I like to believe they still hope I will ;) From the remote golden fields in Alentejo, to the
deep blue water of the Atlantic in Torreira, I have amazing friends who have always been there
for me. In Estremoz, for more years than I like to remember: Ana Preta, Raquel Cortes, Ana
Taborda, Ana Raposo, Sofia Lameiras, Maria Joio, Pedro Costa, T6 Godinho, Nuno Pereira,
Bruno Grades, Nuno Rato. This list is not complete without Miguel Cortes, my alter ego, and Ana
Anjinho. Ana is more than a friend, she's family. There are no words to express how important
she is in my life. She has always been there for me, and I know she always will, and so will
Zezinha and Jodo. Thank you! And please, keep buying Ferrero Rocher.
Every time I arrive in Torreira, the first thing I like to do is to go to the beach and smell the
ocean. And then I go home, slurp some "carapaus" grilled by my dad in the backyard, and wait
anxiously for the time to go out and meet my friends: Bernardo Aguiar, I miss going to Alberto
with you; Carlos Goulio, I still can't believe you are ditching me; Andre Goulio, thanks to msn
you are always there for me; Filipe Prata, I wish you a lot of "sussexo"; Ze e Sofia, thank you so
much for all your help; Jorge and Daniela, when are you getting married? Clan'dia Tavares, Ana
Sofia, Ines Soares, Margarida Aranijo e Si, Filipa Sequeira, Kikas, I miss you girls! Sofia Rocha,
is there a guest room? Ana Teresa, I miss our walks along the beach or down
5thAvenue.
Margarida Aguiar (Mags!), I can hardly wait to meet Bernardinho next time I invite myself to
dinner at yours and Nuno's wonderful "canteen". Maria, Maria, Maria... you've always made me
dream higher.
Time traveling to Domus Nostra: Leonor Vasconcelos (thank you, thank you, thank you!),
Madalena Melo, Teresa Oliveira, Teresa Pereira, Teresa Morais, those were happy times! Even
Marilda couldn't stop us! Joana, my dear Joana, how I miss you. Margariiiida Meeelo, what can I
say that makes justice to how much I like you?
At T6cnico: Marta Fajardo and Laura Barros, you made me feel like I belonged. Joao Tavares
Cabral, Guilherme Milhano and Nuno Romio, thanks for your help and friendship. Studying at
IST was great, but it wouldn't have been the same without Ana Isa, Palila, Rodrigo Albuquerque,
and Luis Guilherme, among others.
Moving forward a few years: Ana Si da Costa (Bija!), please stop getting pregnant so we can
go out again! Vera Appleton, thank you for caring so much. Z6 Diogo, Duarte Morais Cabral,
Jota, Ant6nio Costa Quinta e Joana, Tomis Marques, you've enriched my life.
A detour to Belgium: Lies, my dear friend, you bring out the best in me.
JoAo Paveia, I wish you could be here.
Joao. Thank you. For showing me the world. For everything. You will always be in my heart.
ConceicAo Berger, thank you for all your support and friendship, you are my role model. My
dear Tomis, thank you for being such a special and refreshing person. Tio Z6, Ant6nio, Tia Nend,
Tio Jorge, Av6 Meneses, Tia Manela, you are forever part of my family.
And finally... Tia Benedita, who could imagine I would miss you so much. Tia Angelina, I
know we are always fighting but I really like you. Maneu and Jaime, I'm so proud we are related.
Teresa, thanks for being the best sister-in-law I could ask for. Andre, Afonso, Carolina e Eduardo,
you are the greatest gifts my brothers could have given me. I miss you immensely. Ok, and now I
am crying. GA, Z6, I love you so much. You are the best brothers in the world. Francisco, this
thesis is in your memory. Mom, Dad... words fail me.
Para a Luisa e o Valerio,
os meus queridos Pais
Contents
I
IN TRO D U C T IO N ... 211.1 O UTLINE OF THE THESIS ... 21
1.2 A BRIEF HISTORY OF FM RI ... 24
1.2. 1 Early observations on neurophysiology... 24
1.2.2 The em ergence of neuroim aging technology... 25
1.2.3 M etabolic and vascular "response" to neuronal activity... 26
1.3 BACKGROUND ... 26 1.3.1 Contrast m echanisms ... 26 1.4.2 Signal-to-noise ratio (SNR)... 28 1. 4.3 Sensitivity ... 29 1.4.4 Spatial specificity... 30 1.4.5 Linearity... 30 1.4.6 Temporal response... 31 1.4.7 Spatial resolution... 32 1.5 REFERENCES... 33
2 SPATIO-TEMPORAL CHARACTERISTICS OF IRON AND BOLD FMRI... 37
2.0 PREFACE ... 37
2.1 INTRODUCTION ... 38
2.2 M ETHODS ... 39
2.2.1 Anim al m odel... 39
2.2.2 Visual Stim ulation... 40
2.2.3 M agnetic Resonance Im aging... 40
2.2.4 D ata Analysis... 41
2.3 RESULTS... 43
2.3.1 Transverse relaxation rates and M ION blood half life ... 43
2.3.2 Response Scores... 43
2.3.3 Temporal Response... 44
2.3.4 Functional Sensitivity and Spatial Localization... 47
2.4 D ISCUSSION ... 51
2.4. 1 Temporal Response... 51
2.4.2 Functional sensitivity and Spatial Localization... 52
2.4.3 Iron Accum ulation and M anagem ent... 54
2.5 CONCLUSIONS... 56
2.6 REFERENCES... 56
3 CHARACTERIZATION OF EVENT-RELATED DESIGNS USING IRON AND BOLD FMRI.. 59
3.0 PREFACE ... 59
3.1 INTRODUCTION ... 59
3.2 BACKGROUND ... 60
3.2.1 General Linear Model... ... 60
3.2.2 D etection Power and Estim ation Efficiency... 60
3.2.3 Entropy as a M easure of Predictability ... 61
3.3 M ETHODS ... 62
3.3.1 Sim ulations... 62
3.3.3 Visual Stimulation... 64
3.3.4 M agnetic Resonance Imaging... 64
3.3.5 Data Analysis... 64 3.4 RESULTS... 66 3.4.1 Simulations... 66 3.4.2 Experiments... 67 3.5 DISCUSSION ... 69 3.6 APPENDIX ... 70
3.6.1 General Linear Model (GLM) with finite impulse response (FIR) estimators... 70
3.6.2 Detection Power and Estimation Efficiency... 71
3.7 REFERENCES... 72
4 RETINOTOPIC SPATIAL RESOLUTION OF IRON AND BOLD FMRI... 75
4.0 PREFACE ... 75
4.1 INTRODUCTION ... 76
4.2 M ETHODS...78
4.2.1 Animal M odel...78
4.2.2 Visual Stimulation...78
4.2.3 M agnetic Resonance Imaging... 79
4.2.4 Data Analysis...79
4.3 RESULTS ... 81
4.4 DISCUSSION ... 83
4.5 REFERENCES... 86
5 STRUCTURE OF NOISE IN IRON AND BOLD FMRI ... 91
5.0 PREFACE ... 91
5.1 INTRODUCTION ... 91
5.2 M ETHODS ... 95
5.2.1 Animal M odel... 95
5.2.2 Visual Stimulation... 95
5.2.3 M agnetic Resonance Imaging ... 96
5.2.4 Data Analysis... 96
5.3 RESULTS ... 98
5.4 DISCUSSION ... 99
5.5 REFERENCES... 101
6 MULTI-SHOT EPI WITH NAVIGATORS IN THE AWAKE MONKEY AT 3 TESLA ... 105
6.0 PREFACE... 105
6.1 INTRODUCTION ... 105
6.2 THEORY ... 107
6.3 M ETHODS... 109
6.3.1 M agnetic Resonance Imaging ... 109
6.3.2 Animal M odel... 110 6.3.3 Visual Stimulation... 110 6.3.4 Data Analysis... 110 6.4 RESULTS... I1 6.5 DISCUSSION ... 112 6.6 APPENDIX ... 113
6.61 Correction for the phase offset in k, in (x-k,) hybrid space... 113
6.6.2 Correction for the phase roll in k, in (x-k,) hybrid space ... 114
6.6.3 Correction for the phase roll in x in(x-ky) hybrid space... 114
6.6.4 Correction for the phase roll in in im age dom ain... 114
6.7 REFERENCES... 114
7 C O NC LU D IN G R E M A R KS ... 117
7.1 D ETECTION POW ER... 1 17 7.2 TEM PORAL RESPONSE ... 1 19 7.2.1 M easurem ents...
119
7.2.2 Physiology... 121
7.3 SPATIAL RESOLUTION... 122
7.4 SPATIAL LOCALIZATION ... 125
7.5 LINEARITY... 127
7.6 SUM MARY OF UNIQUE CONTRIBUTIONS ... 128
List of Figures
1.1 ANNUAL NUMBER OF PUBLISHED PAPERS WITH 'FMRI' AND/OR 'FUNCTIONAL MRI' AND/OR
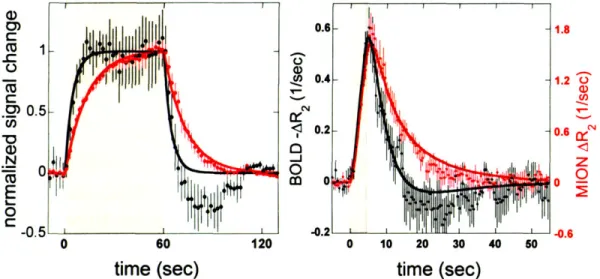
'FUNCTIONAL MAGNETIC RESONANCE IMAGING' IN THE TITLE AND/OR ABSTRACT... 24 2.1 A) NORMALIZED BOLD AND MION SIGNAL CHANGES AS A FUNCTION OF TIME DUE TO 60 SEC OF VISUAL
STIMULATION. B) MEASURED IMPULSE RESPONSE FUNCTIONS FOR BOLD AND MION SIGNAL USING A
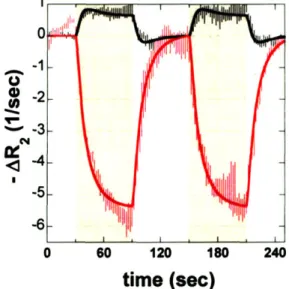
4 SEC STIM U LUS. ... 44 2.2 RELAXATION RATE CHANGES FOR BOLD AND MION CONTRAST, AND CORRESPONDING LINEAR MODEL
FITS, DURING TWO CYCLES OF THE 60 SEC OF STIMULUS FOLLOWED BY 60 SEC OF BASELINE... 45
2.3 RELAXATION RATE CHANGES MEASURED FOR BOLD AND MION CONTRAST DURING 16 CYCLES OF 4 SEC
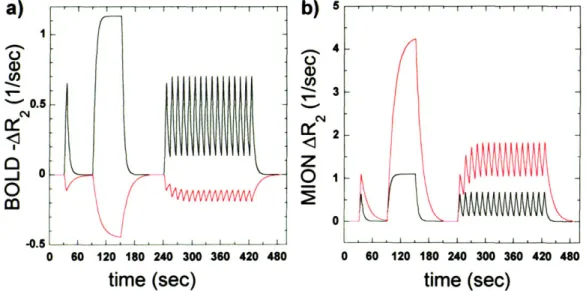
OF STIMULUS FOLLOWED BY 8 SEC OF BASELINE... 46 2.4 A GENERAL LINEAR MODEL FIT SEPARATED DATA OBTAINED USING BOLD AND MION INTO A FAST TIME
RESPONSE AND A SLOW RESPONSE. ... 46
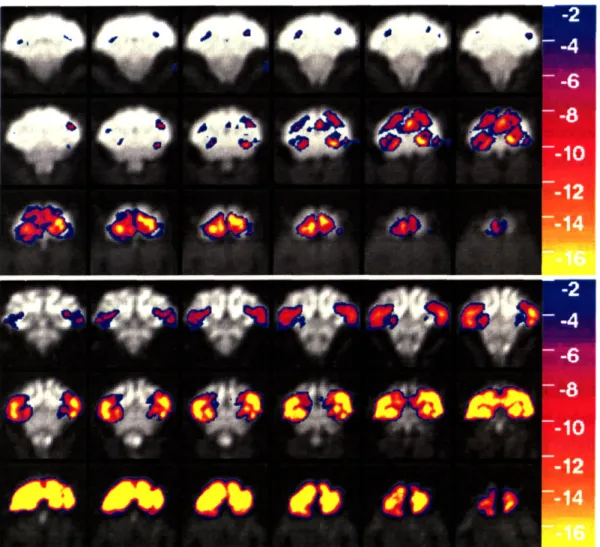
2.5 REPRESENTATIVE FUNCTIONAL BRAIN MAPS OBTAINED IN AN AWAKE, BEHAVING PRIMATE (M-A) DURING SINGLE 4.5 MINUTE RUNS USING EITHER BOLD OR MION CONTRAST... 48
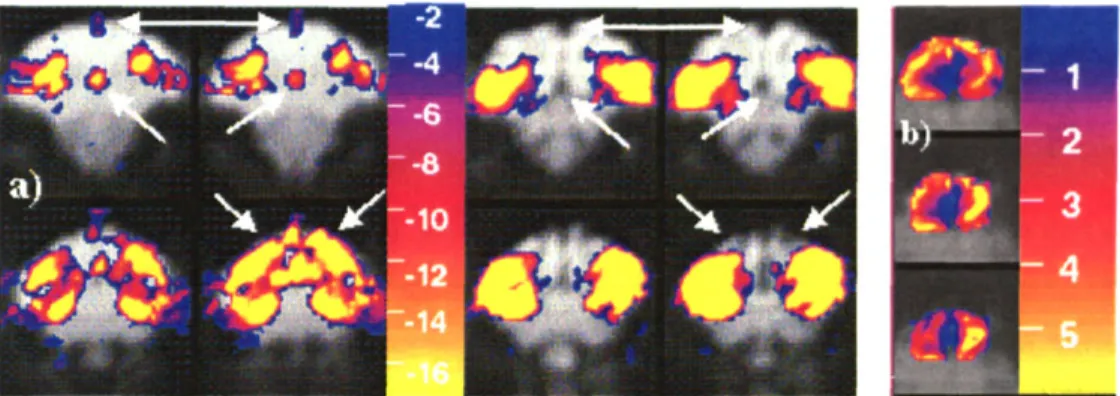
2.6 A) SLICES 3,4,9, AND 10 FROM FIGURE 2.5 AFTER AVERAGING ACROSS RUNS. B) THE RATIO OF MION
CNR TO BOLD CNR IS SHOWN AS COLOR OVERLAY ON THE LAST 3 SLICES IN FIGURE 2.5... 49
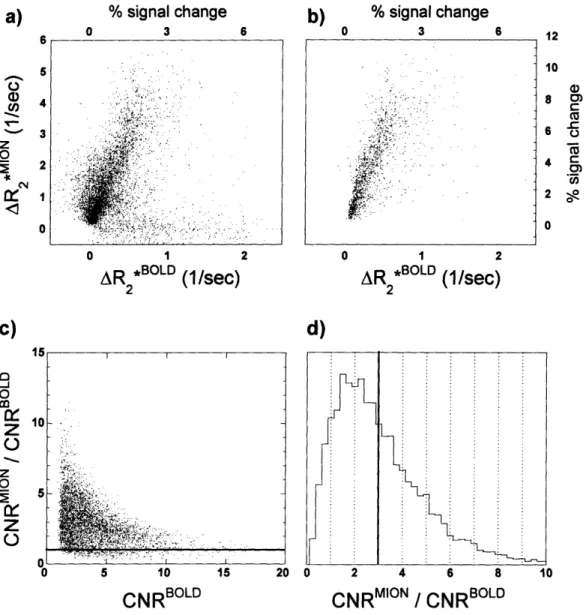
2.7 A) A SCATTER PLOT OF ALL VOXELS IN PRIMATE BRAIN THAT WERE ACTIVATED BY EITHER THE BOLD OR THE MION METHODS AFTER REGISTERING ACROSS SESSIONS AND AVERAGING ACROSS MONKEYS. B) THOSE VOXELS THAT WERE ACTIVATED BY BOTH METHODS. C) THE SENSITIVITY ENHANCEMENT FOR ALL VOXELS IN PANEL "B" AS A FUNCTION OF THE BOLD CONTRAST-TO-NOISE RATIO. D) A
HISTOGRAM OF THE RATIO OF FUNCTIONAL SENSITIVITIES OF THE TWO METHODS... 50
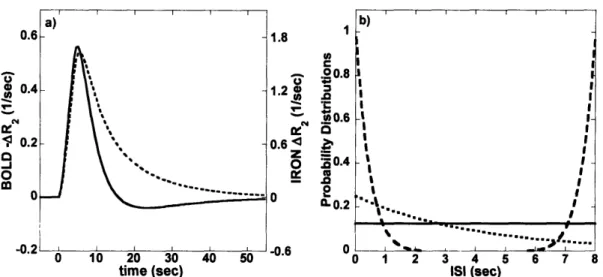
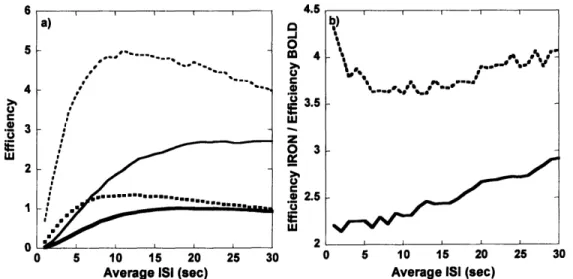
3.1. INPUT TO SIMULATIONS. A) HEMODYNAMIC IMPULSE RESPONSE FUNCTIONS FOR BOLD AND IRON SIGNAL. B) SAMPLE DISTRIBUTIONS OF INTERSTIMULUS INTERVALS FOR AN AVERAGE ISI OF 4 SEC: UNIFORM RANDOM DISTRIBUTION, EXPONENTIAL DISTRIBUTION, AND NOTCH DISTRIBUTION. ... 63 3.2. SIMULATION RESULTS. A) PLOT OF DETECTION EFFICIENCY VERSUS AVERAGE ISI. B) PLOT OF THE RATIO
OF DETECTION EFFICIENCY OF IRON SIGNAL TO DETECTION EFFICIENCY OF BOLD SIGNAL, AS A
FUNCTION OF THE AVERAGE ISI... 65
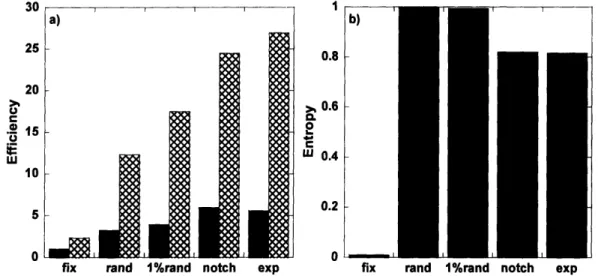
3.3 SIMULATION RESULTS. A) DETECTION EFFICIENCY FOR BOLD AND IRON SIGNAL INCREASES AS ONE MOVES FROM FIXED DESIGNS, TO RANDOM DESIGNS, AND TO SEMI-RANDOM DESIGNS. B) THE OPPOSITE
TREND IS OBSERVED FOR ENTROPY. ... 66
3.4. EXPERIMENTAL RESULTS WITH IRON TECHNIQUE, FOR ISIAV =4 SEC. REPRESENTATIVE TEMPORAL DATA AND GLM FIT AFTER REMOVAL OF BASELINE DRIFT FOR A) FIXED AND B) RANDOM DESIGNS. THE CORRESPONDING ACTIVATION MAPS ARE PRESENTED IN C) AND D). ... 67 3.5. COMPARISON OF SIMULATION RESULTS AND EXPERIMENTAL RESULTS, AS A FUNCTION OF THE AVERAGE
ISI. IN A) BOLD, AND B) IRON. PLOTS OF THE EFFICIENCY RATIO OF RANDOM DESIGNS TO FIXED DESIGNS AS A FUNCTION OF THE AVERAGE ISI ARE PRESENTED IN C) BOLD AND D) IRON... 68
4.0. A) TYPICAL STIMULUS. B) THE ANTERIOR BORDER OF THIS SLICE WAS LOCATED APPROXIMATELY 7.5 MM ANTERIOR TO THE OCCIPITAL NOTCH. ... 75
4.1 TYPICAL VISUAL STIMULI EMPLOYED: A) ALTERNATING BLACK AND WHITE SPOTS ON A GRAY
BACKGROUND, AND B) GRAY HOLES ON A BLACK AND WHITE ALTERNATING FULL-FIELD
CHECKERBOARD, AND C) FULL-FIELD CHECKERBOARD... 79
4.2 TYPICAL ACTIVATION MAPS IN CONSECUTIVE POSTERIOR CORONAL SLICES OF THE MONKEYS' VISUAL CORTEX OBTAINED WITH SPOTS' STIMULUS PATTERN, FOR A) IRON AND B) BOLD CONTRASTS. ... 80
4.3 PLOTS OF FWHM VS DIAMETER OF SPOTS, D, FOR ALL SESSIONS IN TWO MONKEYS FOR A) IRON AND B)
B O L D . ... 8 1
4.4 HOLES IN ACTIVATION MAPS WERE NOT OBSERVED FOR SMALL ANGULAR APERTURES, SMALLER THAN 30
OF VISUAL ANGLE, FOR ANY OF THE METHODS OF CONTRAST USED. ... 83
4.5 A) PLOT OF NORMALIZED CNR WITHIN THE SPOTS' ROI VS SPOT DIAMETER. B) A HOLE BECOMES
NOTICEABLE IN AN ACTIVATION MAP WHEN ITS RADIUS EQUALS THE MEAN FWHM FOR THE CONTRAST
M ETH O D U SED ... 84 4.6 PLOTS OF PSF VARIATION RANGE FOR EACH SPOT DIAMETER FOR A) IRON CONTRAST AND B) BOLD
C O N TRA ST ... 85
5.1 A) LOCALIZED VISUAL STIMULUS. IN B) FULL FIELD CHECKERBOARD STIMULUS WAS PRESENTED IN AN
EVENT-RELATED DESIGN ... 96
5.2 PLOTS OF THE ESTIMATED AUTOCORRELATION COEFFICIENTS AS A FUNCTION OF MODEL ORDER FOR A)
FIXATION-ONLY, B) BLOCK DESIGNS AND C) EVENT-RELATED DESIGNS. ... 97
5.3 AVERAGE MAPS OF AR(l) COEFFICIENTS FOR BOLD (A AND B) AND IRON (C AND D)... 98
5.4 POWER SPECTRAL DISTRIBUTIONS OF THE RESIDUALS OBTAINED FROM SPATIAL SMOOTHED IMAGES. IN A) IRON CONTRAST AND B) BOLD CONTRAST. IN C) THE BRAIN PSD IS SHOWN FOR EACH INDIVIDUAL
SESSIO N . ... 99
5.5 LINEAR FITS TO OBSERVED POINT SPECTRAL DISTRIBUTIONS. A) TYPICAL BOLD AND IRON FREQUENCY SPECTRA FOR A GOOD SESSION. B) IN THIS IRON SESSION THE MONKEY MOTION WAS SEVERE. SPATIAL DISTRIBUTION MAPS FOR C) RESPIRATION FLUCTUATIONS AND D) 1/F FLUCTUATIONS WERE OBTAINED
FROM THE IRON SESSION WHOSE SPECTRUM IS SHOWN IN A)... 100 6.1 EDGE PLOT FOR A TYPICAL SINGLE-SHOT EPI CORONAL SLICE AT A TIME POINT WHERE MAINLY A)
ZEROTH ORDER DISTORTIONS WERE OBSERVED, OR B) FIRST ORDER DISTORTIONS WERE OBSERVED. IN
C) THE TIMECOURSE OF THE SLICE CENTER OF MASS IN THE X AND Y DIRECTIONS IS SHOWN. IN D) AN INDEX OF DISTORTION IS PLOTTED FOR FOUR DIFFERENT SLICES... 108 6.2 TYPICAL EPI IMAGE OF A BRAIN CORONAL SLICE ACQUIRED WITH 16 SHOTS A) BEFORE AND B) AFTER
APPLYING NAVIGATOR CORRECTIONS. C) HISTOGRAM OF SNR GAIN OF CORRECTED VS UNCORRECTED
D A T A . ... I I I
6.3 IRON ACTIVATION MAP AND TIME COURSE OBTAINED WITH MULTI-SHOT EPI IN RESPONSE TO A SPOTS' STIM U LUS. ... 1 12
7.1 LINEWIDTH FOR BOLD AND IRON CONTRASTS AS A FUNCTION OF VOXEL SIZE FOR A) SS-EPI
ACQUISITION AND B) MS-EPI OR SENSE EPI ACQUISITION WITH ACCELERATION FACTOR OF 2... 124 7.2 A) RELATIVE BW PER PIXEL, RELATIVE VOXEL VOLUME, AND RELATIVE TE VERSUS VOXEL EDGE FOR
SINGLE-SHOT EPI WITH OUR MRI SYSTEM. B) RELATIVE BW PER PIXEL AND RELATIVE TE FOR SS-EPI AND SENSE-EPI WITH 2-FOLD ACCELERATION. C) RELATIVE SNR FOR SS-EPI AND SENSE-EPI WITH
List of Tables
4.1 INDIVIDUAL RESULTS FOR EACH GROUP OF EXPERIMENTS PERFORMED TO MEASURE THE SPOTS' FWHM,
DIVIDED ACCORDING TO MONKEY AND TYPE OF STIMULUS USED... 82
6.1 TEMPORAL TO ANATOMICAL SNR RATIO FOR SINGLE-SHOT EPI AND MULTI-SHOT EPI FOR BOLD AND
Chapter 1
Introduction
1.1 Outline of the thesis
The main goal of this thesis was to systematically characterize the detection sensitivity, temporal response, and spatial resolution of a new method of contrast for functional MRI (fMRI) within the awake, behaving macaque. Understanding these issues provides insights into the physiology of the functional response to local changes in brain activity, enables researchers to optimize experimental designs, and delineates the advantages and limitations of neuroimaging within this important animal model.
While BOLD (blood oxygen level dependent) signal is an effective neuroimaging tool for studying human populations, investigations in anesthetized rodents (1998, 1999) demonstrated that the use of exogenous contrast agent could significantly enhance detection power relative to BOLD fMRI, while the temporal response was modified. With this as a starting point, we sought to extend these methods to primates in the awake state, and then to exploit this model for careful comparisons of functional methodologies.
The remainder of this chapter provides a brief history of the foundations of functional brain imaging, a description of essential physiology relevant to the functional responses employed in our studies, and an overview of fMRI. Obviously, many aspects of MRI physics are common to the alternative methodologies enabled by this flexible imaging modality, whereas the choice of contrast for fMRI can significantly modify experimental choices and functional results.
Chapter 2 of this thesis measures and compares the functional sensitivity of BOLD signal relative to fMRI that employs an exogenous contrast agent; we refer to the latter as the IRON method (increased relaxation for optimized neuroimaging). BOLD and IRON studies were performed for different types of stimulus' paradigms. Special care was taken to accurately measure temporal fMRI responses, and to estimate the impulse response functions for BOLD and IRON contrasts using a basis of mono-exponential functions. In order to achieve this goal, a simple model of the hemodynamic response to neuronal activation had to be established. A general linear model provided a good first order approximation for BOLD and IRON responses, in agreement with previous reports for BOLD fMRI (e.g., Friston et al., 1995). We found that both BOLD and IRON data could be fit very well using the same two temporal components, and the relative magnitudes in each case made good sense in terms of the expected contribution of
arterials (fast component) and post-arterials (slow component). BOLD signal is dominated by the fast component, but IRON is dominated by the slow component, which accounts for 80% of the IRON response in block designs, and 40% of the BOLD response.
The slowness of the IRON method of contrast was the beginning point to chapter 3. Having found that the injection of an exogenous contrast agent provided a three-fold increase in sensitivity for a block design, but only 1.5 for fixed event-related (ER) designs, made us ask whether we could optimize the IRON response to rapid event-related designs, such that the longer duration of these responses with respect to BOLD responses would not penalize the use of IRON contrast. Because randomized event-related designs were known to increase estimation efficiency for BOLD fMRI (Burock et al., 1998), we hypothesized that due to its inherently slower impulse response function (IRF), the IRON method will benefit more from randomization of the interstimulus intervals (ISI) than the BOLD method, in terms of detection efficiency. In order to confirm this hypothesis, different ER designs were considered in terms of the distribution of ISIs: fixed, random, semi-random. We found that semi-random distributions of ISIs led to the most efficient designs in terms of detection sensitivity, without significantly increasing the predictability of the design, which we measured based on a metric of the entropy of a discrete distribution.
Chapter 4 switched the focus to space: we now tried to determine the ultimate spatial resolution of BOLD and IRON fMRI. We knew, from the work that led to chapter 2, that apparent spatial specificity was enhanced with IRON contrast. That is, activation maps obtained after the injection of an optimized dose of MION contrast agent did not show activation in draining veins or draining tissue, in contrast with very large "false" activations detected in these regions with BOLD contrast. The next obvious question was what would happen at the level of small vessels and capillaries for discrete and subtle stimuli which would not be expected to show detectable nonlocal venous drainage. To examine this issue we used stimuli where small spots of varying diameters would alternate between black and white at a frequency optimized to elicit activation in the primary visual cortex (VI). We measured the FWHM of the "cortical point image" in VI by extrapolating these measures to infinitesimal pixel size, in order to obtain an estimate of the point spread function (PSF) for BOLD and IRON fMRI. Additional factors could contribute to a higher effective measurement of the point spread function: finite image resolution, phase encoding blurring that is larger for IRON contrast because injection of MION markedly reduces T2, blurring due to image distortions, and fixation blurring. We also looked at the activation maps obtained with BOLD and IRON contrasts in response to holes' stimuli, and found no significant differences between the two methods.
Throughout all the work that led to the chapters 2, 3 and 4, we assumed that a general linear
model (GLM) including the contributions of the vascular response to a given stimuli, the time
courses of the monkey's eye fixation, and a rough measure of the motion-induced distortions,
captured most of the relevant dynamics, and that the contribution of mechanisms not specified in
the GLM could be neglected. In chapter 5, the accuracy of this assumption is examined by
looking at the structure of the residuals. Data was acquired with fixation-only, and after linearly
removing the known sources of signal, the obtained residuals were Fourier transformed. The
BOLD and IRON spectra were compared and the contribution of respiration and of a general
component that varies inversely with the frequency assessed.
The main impediment in achieving higher spatial resolution was the presence of severe image
distortions arising from monkey's body motion outside of the field of view (FOV). The body
motion originated strong susceptibility gradients that caused severe magnetic field
inhomogeneities, affecting the acquired images especially in the most posterior inferior region of
the monkey's brain. The distortions were sometimes so severe that the true activations were
completely erased, and the resultant activation maps showed only the effects of the motion. This
is an urgent problem that needs to be address before better measurements of the PSF can be
obtained in awake monkey, and its resolution will greatly increase the efficiency of data
acquisition. In chapter 6 of this thesis, we tried to solve this problem by moving from single-shot
EPI to multi-shot EPI with navigators. It will become clear in that chapter the reasons behind the
failure of this approach, and what we think is the right strategy for solving this problem.
In the last chapter I summarize our experimental findings. Our main conclusions are
presented and integrated with additional research that emerged during the development of this
thesis, to show that IRON contrast fMRI is an excellent choice to use in awake, behaving
macaque monkey fMRI at 3 Tesla. A discussion on the current limitations in achieving better
spatial resolution, and on what we believe are the next steps for the measurement of the ultimate
fMRI PSF conclude this thesis.
The majority of the work presented in this thesis has been published in scientific journals
and/or presented in international conferences. In 2002, chapter 2 was published in Neurolmage
(Leite et al., 2002a), and presented orally at the ISMRM conference (Leite et al., 2002b). Chapter
3 was also presented orally at the 2003 ISMRM conference (Leite and Mandeville, 2003), and has
recently been published in Neurolmage (Leite and Mandeville, 2006a). Different aspects of
Chapter 4 have been presented orally, or in poster form, at ISMRM conferences (Leite et al.,
2004, 2005), and at the OHBM conference (Leite et al., 2006c). This chapter is almost ready for
submission to a journal, which I hope will occur in the beginning of October. Preliminary work
leading to chapter 5 has been presented at the ISMRM conference this year (Leite et al., 2006b), but additional data are required before this work can be considered for publication.
1.2 A brief history of fMRI
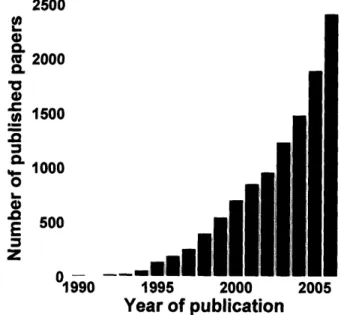
The first human functional MRI experiments utilized bolus injections of an exogenous contrast agent (Belliveau et al., 1991) to detect brain activation in response to a visual stimulus. Human functional experiments using blood oxygen level dependent (BOLD) contrast followed shortly thereafter (Kwong et al., 1992; Ogawa et al., 1992). From the early 1990s to the present, the functional MRI literature has increased in a cubic relationship with the relative year of publication. 2500 0, 0.
a
2000
-o 1500 . 1000 0 500 1990 1995 2000 2005Year of publication
Fig. 1.1 Annual number of published papers with 'fMRI' and/or 'functional MRI' and/or 'functional magnetic resonance imaging' in the title and/or abstract. Search performed on PubMed.
Even though approximately 9 papers are published every working day, the question of how exactly fMRI activity translates into neural activity remains incompletely answered.
1.2.1 Early observations on neurophysiology
It was shown by Mosso in the 1 9th century (Mosso, 1881) that blood pulsations in the brain,
which he monitored through a breach in the skull in terms of changes in intracranial pressure, would change in response to an outside stimulus. His conclusion that brain circulation changes selectively with neuronal activity was supported by Roy and Sherrington (Roy and Sherrington, 1890), who postulated that changes in blood flow are delicately correlated with changes in neuronal metabolism. But 6 years later, Leonard Hill, an eminent physiologist, concluded that no relationship exists between brain function and brain circulation (Hill, 1896). Twenty years later, Fulton found increased flow turbulence in occipital cortex during visual stimulation by recording
the bruit from a vascular malformation in occipital cortex (Fulton, 1928). He concluded that cortical blood flow changes according to the complexity of the visual task and the attention of the subject to that task, in agreement with Roy and Sherrington's hypothesis.
But it wasn't until 1948 that the first quantitative method for measuring whole brain blood flow and metabolism in humans was developed (Kety and Schmidt, 1948; Kety, 1951; Laudau et al., 1955). The method was based upon the uptake by the brain of a diffusible inert gas supplied by way of the arterial blood. The theory on which this method was based led to the development of current methods for the measurement of regional blood flow, metabolism, and the visualization of functional activity throughout the human brain (Ingvar and Lassen, 1962; Sokoloff, 1977). For the first time in history, it became possible to study what the different parts of the brain were doing in targeted experiments without the necessity of lesion models. Finally, in 1965, Ingvar and Risberg (Ingvar and Risberg, 1965) demonstrated directly in normal human subjects that blood flow changes regionally during changes in brain activity, definitely proving Roy and Sherrington's general hypothesis.
1.2.2 The emergence of neuroimaging technology
In 1936, Pauling and Coryell observed that changing the amount of oxygen carried by hemoglobin changes the degree to which hemoglobin disturbs a magnetic field (Pauling and Coryell, 1936). Ten years later, the physical principles of nuclear magnetic resonance (NMR) were discovered independently by Felix Bloch (Bloch, 1946) and Edward Purcell and his colleagues (Purcell et al., 1946). These principles governing the behavior of protons in a magnetic field would eventually lead to a number of magnetic resonance technologies. But it wasn't until 1973 that Paul Lauterbur expanded NMR principles to be utilized for imaging, thus introducing magnetic resonance imaging (MRI) (Lauterbur, 1973).
Also in 1973, Godfrey Hounsfield introduced X-ray computed tomography (CT) (Hounsfield, 1973), and just two years later positron emission tomography (PET) was derived from CT (Ter-Pogossian et al., 1975). It was then realized that highly accurate measurements of human brain function could be made with measurements of either blood flow or metabolism. Blood flow became the favored technique because it could be measured quickly using HO2 0, allowing for many repeat measurements in the same subject.
Finally, in 1990, following on the footsteps of Pauling and Coryell and their findings on magnetic field perturbations induced by deoxyhemoglobin, Ogawa and colleagues (Ogawa et al., 1990) demonstrated that in vivo, localized changes in blood oxygenation could be detected by MRI. This MRI signal became known as the blood oxygen level dependent (BOLD) signal.
1.2.3 Metabolic and vascular "response" to neuronal activity
Blood flow generally increases in activated brain regions. Why? This is, so far, an
unanswered question. But an intuitive thought is that when the neurons become active, the
neuronal metabolism needs to increase in order to generate larger quantities of adenosine
triphosphate (ATP), requiring increased delivery of glucose and oxygen.
While ATP can be generated by anaerobic glycolysis, this mechanism is much less efficient,
in terms of quantity of ATP generated, than oxidative phosphorylation. Therefore, it was thought
that while glucose consumption would probable increase by a larger amount in order to sustain
both anaerobic and aerobic generation of energy, the oxygen consumption would also increase
significantly, proportionally to the increase in blood flow. But surprisingly, in a seminal paper by
Fox and Raichle using PET (Fox and Raichle, 1986), it was demonstrated that the cerebral
metabolic rate of oxygen, or CMRO
2, increased only slightly in response to a stimulus, while
cerebral blood flow, CBF, increased by approximately 30%. This CBF increase, out of proportion
to the change in oxygen consumption, leads to the paradoxical fall of the concentration of
deoxygenated hemoglobin in activated regions of the brain.
Furthermore, increases in CBF imply increases in cerebral blood volume (CBV) due to vessel
compliance. The relationship between changes in flow and changes in volume was thoroughly
established by Grubb, who showed that CBV = 0.80 CBF
038(Grubb et al., 1974).
In summary, in response to activation there is a large increase in CBF, and more moderate
increases in CBV and CMRO
2.
Key issues in functional neuroimaging are still waiting for a satisfactory explanation. What
are the quantitative relationships and physiological mechanisms that govern the responses of
blood flow, glucose utilization, and oxygen consumption during neural activation? What
function(s) serves the large increase in blood flow? Many other questions exist, but the question
that first motivated this work is the following: what can we measure using functional MRI
methods?
1.3 Background
1.3.1 Contrast mechanisms
The NMR signal at the receiver is proportional to the transverse magnetization,
(I
- e-TR/TI -TE/T2S= p
sinR/T1I
-e 'R/T cosawhere p is the proton density in the sample to be imaged, R,
=
I /Ti is the longitudinal relaxation
rate, R
2= I/T
2is the transverse relaxation rate, TE is the echo time, TR is the repetition time, and
a relates to the fraction of longitudinal magnetization flipped to the transverse plane. In all subsequent formulae, R2 is used to denote either spin-echo relaxation or gradient echo relaxation
(generally denoted R2*, which includes additional contributions due to microscopic or
macroscopic non-uniformities in magnetic field, R2* = R2 + R2'). These relaxation rates can be manipulated to reflect the local concentration of an exogenous or endogenous contrast agent, with the following approximate form:
R 1or2 = Rendogenous + Ragent ~ endogenous + k[agent]. (1.2)
lo2 or2 I or2 lor2 Ior2[gn .
1.4.1.1 Blood Oxygen Level Dependent contrast (BOLD)
BOLD contrast uses deoxyhemoglobin as an endogenous contrast agent. Hemoglobin in the blood exists in two different forms depending upon whether it is bound to oxygen (oxyhemoglobin: HbO2) or not (deoxyhemoglobin: dHb). These two forms have different
magnetic properties: oxyhemoglobin is diamagnetic and deoxyhemoglobin is paramagnetic. For BOLD contrast, the approximate functional form above is more accurately modeled as:
R
BOLD(t)= kCBVa(t)[dHby (t). (1.3)Monte Carlo simulations predict that R2BOLD should vary linearly with CBV (a = 1) and slightly
superlinearly with [dHb] (p#> 1) at low magnetic fields like 1.5 Tesla (Boxerman et al., 1995). At high fields such as 7 Tesla, a good approximation is obtained using (a = 1) (Boxerman et al., 1995), as assumed by Ogawa et al. (1993).
During activation, blood flow increases much more than oxygen extraction, so the concentration of deoxyhemoglobin decreases relative to the resting state, and R2BOLD decreases.
It can be shown that the BOLD signal depends on CMRO2, CBF and CBV. From the hemoglobin saturation curve, [dHb]b1id = (1-Y)[Hb]lbood, Fick's law for oxygen flux conservation across the capillary bed, CBF[Hb](1 -Yvenous) = CMRO2, and by assuming that Ya = 1, one gets
R BOLD(t)= 2 kCBVa(t CMRO2) (1.4)
CBF(t)
A linearized version of this equation for a = = 1, and assuming small changes during activation, is given by (Ogawa et al., 1993)
AR2 (t =Ak[dHbiACBF(t) ACBV(t) ACMRO2(t)
(1.5) ( CBF CBVO CMRO20
1.4.1.2 Increased Relaxation for Optimized Neuroimaging (IRON)
Alternatively, one can perform T2 or T2* fMRI using an exogenous contrast agent like MION
(Monocrystalline Iron Oxide Nanoparticle). MION has a high magnetic susceptibility, remains intravascular and has a relatively long half-life (about 8 hours). Assuming that the blood concentration of MION is constant in time (steady-state), the functional form for IRON contrast will simplify to
R NION (t)= kCBV(t), (1.6)
and the relative change in CBV with activation is simply given by (Hamberg et al., 1996; Mandeville et al., 1998)
ACBV(t) _AR2
(t)
(1.7)CBVo
R2MION (o)IRON contrast was first used for fMRI in anesthetized rats (Kennan et al., 1998; Mandeville et al., 1998; van Bruggen et al., 1998), and its use was later extended to awake monkeys (Vanduffel et al., 200 1).
1.4.2 Signal-to-noise ratio (SNR)
The size of the signal relative to the size of the noise is known as signal-to-noise ratio (SNR). SNR may be improved by signal averaging, as signal adds coherently and noise adds in random phase. Because the noise power is additive, the root mean square of the noise amplitude is proportional to N 2, where N is the number of averages. As a result, the SNR improves with N 2
.
The thermal equilibrium magnetization for spins of gyromagnetic ratio y and spin quantum number I in a longitudinal field Bo is given by
Mo = Nsy2 h2
i(I + 1)Bo/3kBTS , (1.8)
where Ns is the number of spins per volume and Ts the sample temperature. According to Lenz's law, which states that the emf induced in a receiver coil is proportional to the time rate of change of field within the coil, the signal amplitude will be proportional to Moaq or 3 I(I + I)BO.
Therefore, the signal amplitude will increase proportionally to the square of magnetic field, the third power of the gyromagnetic ratio, and the number of spins in the volume. In summary, SNR is given by
SNR o. V - FTAc f-(TI,T2,T (1.9)
where w is the operating frequency, V is the volume of a voxel, TACQ is the k-space acquisition
function of T
1, T
2and T2*. SNR increases proportionally to Bo because the noise in MRI is also
proportional to Bo (Edelstein et al., 1986).
In echo planar images, the high temporal resolution is usually achieved at the expense of
SNR or spatial resolution. This tradeoff is unavoidable. EPI is further limited by the T2
of the
sample, the characteristics of the imaging gradients, and other hardware considerations.
1.4.3 Sensitivity
The functional contrast-to-noise ratio depends upon both the physiology and the physics of a
given technique. It can be defined generally as
fC
S
SS
(1.10)
fCNR = -t= fSNR -=-,
a,
St
where 6S refers to the time-dependent signal changes,
o
is the temporal standard deviation of the
signal, St is the timeaveraged signal, and fSNR is the functional SNR, given by fSNR =St/,
-Because some noise can be coherent, fSNR
aSNR, where aSNR is the "anatomical SNR",
defined in the previous section.
Fractional changes in signal are roughly proportional to absolute changes in relaxation rates,
as can be seen by expanding the exponential for small changes in relaxation rate:
dS=
e-TEAE2(t) - ~ -TE(1.11)SWt)
Using these expressions, the CNR for endogenous (BOLD) or exogenous (IRON) contrast agents
can be given as (Mandeville and Marota, 1999)
CNR
(t)=
TE R TE Ragent(0)eTE Raent (0) ntThe first term on the rhs of this equation is a scaling factor related to the baseline state, and is the
same for BOLD and IRON. The second term is an amplification factor that depends upon the
method and basal physiology, and it is maximized for TE
R2agent (0) =I. At common magnetic
field strengths, BOLD imaging lies far below the optimal signal attenuation. For example, at 1.5
Tesla,
R2age" (0) -2 sec~', and for TE
=40 msec the amplification factor will be approximately
equal to 20% of the maximum value. With an exogenous contrast agent one can theoretically
achieve the maximum amplification simply by changing the dose of agent injected and
optimizing the echo time accordingly. The third term has to do with activation and is usually of
the same order of magnitude for BOLD and IRON contrasts in steady state, although results to
date indicate that BOLD and IRON temporal responses differ significantly, so that CNR is a
complicated function of the duration and timing of stimuli, the choice of echo time and contrast
agent dose, the magnetic field strength, and (for reasons explained below) the local blood volume fraction.
1.4.4 Spatial specificity
Another way to express CNR at a spatial location r and time t as (Mandeville and Marota, 1999)
CNRT2 (r, t) = SNR(r)W(r)D(r, t). (1.13)
SNR(r) is the SNR at rest (before injection of the contrast agent in the case of IRON contrast), W(r) is a vascular weighting function, and CD(r,t) depends upon the functional changes but is independent of baseline physiology.
For BOLD contrast, the vascular weighting function (assuming small changes in signal and a tight regional linear relationship between resting state values of CBF and CMRO2) is given by
WBOLD(r)= kv(r), with k = TE(R 2BOLD)rain
For IRON contrast, the vascular weighting function is given by
WIRON =
r
v(r). (1.15)From the above expressions for the vascular weighting, one can see that BOLD linearly amplifies CNR by resting state CBV ("brain versus vein" ambiguity). Intuitively, this occurs because the BOLD effect is so weak that it produces no regional dependence on SNR (to first order), so CNR is driven by fractional signal changes, which scale linearly with the resting state blood volume fraction. Conversely, the IRON method is much less sensitive to resting CBV when an appropriate dose of contrast agent is used to produce an optimal tradeoff between SNR and fractional signal changes. Regions with a high blood volume fraction will have large fractional signal changes but small basal SNR, whereas lower blood volume areas will have smaller fractional signal changes but higher SNR. In fact, the dose of contrast agent can be selected to target a specific tissue blood volume fraction, so that the maximum sensitivity occurs for blood volume fractions that correspond to regions without significant large vessel contributions.
1.4.5 Linearity
We often assume that the vascular system is a time-invariant linear system (e.g., Friston et al., 1995) that is, the output of this system, the vascular response, is given by the convolution of the neuronal input with the system impulse response function. We further assume that the neuronal system follows the stimulus time course in a linear manner, such that the vascular response can be predicted by convolution of the vascular impulse response function with the timing diagram of the stimulus design.