HAL Id: tel-02872028
https://tel.archives-ouvertes.fr/tel-02872028
Submitted on 17 Jun 2020HAL is a multi-disciplinary open access archive for the deposit and dissemination of sci-entific research documents, whether they are pub-lished or not. The documents may come from teaching and research institutions in France or
L’archive ouverte pluridisciplinaire HAL, est destinée au dépôt et à la diffusion de documents scientifiques de niveau recherche, publiés ou non, émanant des établissements d’enseignement et de recherche français ou étrangers, des laboratoires
Visualization for information system security monitoring
Damien Cremilleux
To cite this version:
Damien Cremilleux. Visualization for information system security monitoring. Cryptography and Security [cs.CR]. CentraleSupélec, 2019. English. �NNT : 2019CSUP0013�. �tel-02872028�
Thèse de Doctorat
Visualization for information system security monitoring
Visualisation pour la supervision de sécurité des systèmes
d’information
Par :
Damien CRÉMILLEUX
CentraleSupélec
COMUE Université Bretagne Loire
École doctorale N° 601
Mathématiques et Sciences et Technologies
de l’Information et de la Communication
Spécialité : informatique
Thèse présentée et soutenue à Rennes, le 15 février 2019
Unité de recherche : IRISA
Thèse n° : 2019-02-TH
Rapporteur avant soutenance :
Hervé DEBAR
Professeur, Télécom SudParis
Guiseppe SANTUCCI
Professeur, Sapienza Università di Roma
Composition du jury :
Présidente :
Isabelle CHRISMENT
Professeur, Télécom Nancy
Examinateurs :
Hervé DEBAR
Professeur, Télécom SudParis
Benjamin MORIN
Responsable de la division détection, ANSSI
Giuseppe SANTUCCI
Professeur, Sapienza Università di Roma
Dir. de thèse :
Christophe BIDAN
Professeur, CentraleSupélec
Abstract
Security operations centers (SOCs) are the central place for the security of information systems. Two distinct teams of security analysts work together in a SOC to detect, analyze, and respond to security incidents. Tier 1 analysts are the first to receive security alerts and dispatch them to Tier 2 analysts for further investigations if needed. Despite the evolution of techniques and procedures over time, there remain some significant difficulties impacting the efficiency of SOCs. This situation results in failure to timely react to real attacks.
First of all, this thesis highlights and classifies the limitations of SOCs into two categories, technology and process. Tier 1 analysts are particularly affected by these limitations, resulting in a high burnout rate and strenuous working conditions. Visualiza-tion tools have been proposed to fulfill the tasks accomplished in SOCs. We identify that these tools are often not in adequation with the needs of security analysts, showing a lack of comprehension of their work and constraints.
We address the problem of the high number of IDSes alerts, the repetition of the same tasks, and the lack of creativity with VEGAS (Visualizing, Exploring and Grouping AlertS), a visualization and classification tool. VEGAS is based on a combination of data summarization and visualization. We compare the methods for dimension reduction and our proposition uses principal component analysis as a first step to produce a two-dimensional scatterplot that visually correlates the IDSes alerts. Our tool allows Tier 1 analysts to explore the various fields of similar alerts, to analyze them quickly, and to generate meaningful rules to group IDSes alerts. Our evaluations with a case study and experts have demonstrated that VEGAS is useful to quickly detect similar IDSes alerts and group them efficiently.
After addressing the problem of IDSes alerts triaging, we tackle the remaining process limitation of the lack of feedback alongside the limitations of threat escalation and rhythm of networks. We propose TheStrip, a process with a visual tool, to enhance the collaboration between Tier 1 and Tier 2 analysts. Our process creates a feedback loop between Tier 1 and Tier 2 analysts and improves rules to define security meta-events. Our concept of security meta-events adds time and collaborative features to enable better groups and the creation of attacks scenarios We propose a visualization tool to support this new process. This tool is organized around a timeline view, providing a quick perception of the context and easy reconstruction of attack scenarios.
Résumé
Notre monde est de plus en plus dépendant des systèmes d’information connectés. En 2018 il y avait plus de 3,66 milliards d’internautes et ce chiffre devrait dépasser les 4,13 milliards en 2021 [1]. Il est indispensable de veiller à la sécurité de ces systèmes d’information, face à des attaquants de plus en plus organisés et disposant de budget et de moyens de plus en plus importants. Les mesures de sécurité préventives s’avèrent insuffisantes pour assurer cette sécurité, les attaquants finissent par trouver des failles pour s’introduire au sein des systèmes ou les endommager. La plupart des systèmes d’information sont aujourd’hui assistés par un SOC (Security Operations Center, centre opérationnel de sécurité), afind’assurer une sécurité réactive avec la supervision et la gestion des incidents de sécurité.
L’activité principale d’un SOC est donc le triage et l’analyse des évènements de sécurité du système d’information, et en particulier des alertes provenant des systèmes de détection d’intrusion (IDS). En moyenne, un SOC collecte plusieurs milliers et même plusieurs millions d’évènements par jour, et a pour objectif de trouver ceux étant symptomatiques d’une véritable intrusion. En effet, la grande majorité des alertes reçues par un SOC sont des faux positifs et ne témoignent pas d’une véritable menace pour le système d’information. Ce nombre élevé d’alertes, associé à leur taux de non pertinence, est un problème car les vraies attaques ne sont pas détectées ou alors très tardivement. En outre, ce problème engendre une pression sur les analystes travaillant dans les SOCs. Ces analystes ont un temps très limité pour décider de la sévérité et de la véracité des alertes. Ils souffrent d’un taux de burn-out important : la durée moyenne de travail d’un analyste est de trois ans au sein d’un SOC.
Cette thèse a pour objectif d’améliorer la supervision au sein des SOCs. Les principales contributions que nous apportons sont :
• Une revue des SOCs et de leur organisation, aboutissant à l’expression de leurs limites. Ces limites sont de deux catégories différentes, technologie et processus.
• VEGAS [2, 3], un outil de visualisation et de classification qui permet aux analystes de première ligne dans les SOCs de regrouper les alertes grâce à leur représentation en analyse en composantes principales.
• TheStrip [4], un nouveau processus associé à un outil pour améliorer la collaboration au sein des SOCs.
En plus de ces contributions, cette thèse propose une revue des solutions de visualisa-tion pour la sécurité selon la connaissance situavisualisa-tionnelle (situavisualisa-tional awareness). Nous avons ajouté la collaboration entre les analystes de sécurité au concept de connaissance situationnelle afin de retranscrire complètement les différents cas d’utilisation rencontrés dans un SOC.
Centre opérationnel de sécurité
Les SOCs sont un élément central pour la sécurité des systèmes d’information. Ils doivent remplir des nombreuses missions, dont la plus importante est le triage et l’analyse en temps réel des évènements de sécurité. Les SOCs sont organisés autour de deux équipes d’analystes, les analystes Tier 1 et les analystes Tier 2. Les analystes Tier 1 sont situés en première ligne et disposent de quelques secondes ou minutes pour décider de la gravité d’une alerte. Ils utilisent comme source de données les alertes IDS. En cas de suspicion, l’alerte est envoyée à des analystes Tier 2 pour une analyse plus approfondie et l’élaboration de la réponse face à cette menace. Les analystes Tier 2 disposent de plus de temps pour effectuer leur analyse et ils utilisent toutes les sources de données à leur disposition tels que les logs des serveurs, des clients ou encore des applications.
Malgré l’évolution de leur mission et de leurs outils, les analystes au sein des SOCs souffrent d’inconvénients liés au processus et aux technologies utilisés. Cette liste de limites est une des contributions de cette thèse. Les limites de type technologique sont:
• De nombreuses données et sources de données qui ne sont pas nécessairement liées. Même avec les seules alertes IDS comme source de données principale, les analystes Tier 1 doivent faire face à un volume d’évènements de sécurité important. Ce problème existe aussi pour les analystes Tier 2, le nombre de données qui leur est transmis étant encore plus important. De plus, les sources de données sont variées telles que les antivirus, les alertes IDS, le trafic réseau. Comme ces sources de données ne sont pas nécessairement liées entre elles, il est nécessaire d’avoir une expertise pour chaque type. Enfin, cette caractérisque rend la corrélation et l’exploration difficiles.
• La progression de la menace. Il est particulièrement important de savoir si un évènement est isolé ou bien s’il fait parti d’un scénario d’attaque plus important. La connaissance du contexte actuel, des menaces et des incidents, est nécessaire pour que les analystes de sécurité puissent élaborer une réponse efficace.
• Le rythme du réseau. Les analystes de sécurité sont familiers du rythme du réseau qu’ils surveillent, ils connaissent les évènements fréquents et les conséquences qu’ils engendrent. La compréhension de ces évènements et du nombre classique d’erreurs au sein du système est insuffisament exploité.
Nous nous sommes aussi intéressés au processus du travail mené dans les SOCs et nous en avons indentifié les limites suivantes :
• La répétitivité des tâches. Les analystes Tier 1 accomplissent des tâches répétitives en suivant des procédures pré-établies. Cet aspect est également valable pour les analystes Tier 2 car ils doivent traiter les mêmes types d’évènements envoyés par les analystes Tier 1. Cela résulte en une perte de temps et une appréciation diminuée pour le travail accompli par l’analyste Tier 1.
• Le manque de retour. Une fois leur décision prise, les analystes Tier 1 perdent la trace de leurs actions. Ils ne sont pas notifiés du résultat de l’analyse faite par les analystes Tier 2 et ainsi ne savent pas s’ils ont pris la bonne décision.
• Le manque de créativité. Les analystes Tier 1 suivent des procédures qui limitent sevèrement leur créativité et n’en dévient pas, avec pour conséquences des difficultés pour réagir correctement à de nouveaux types d’attaques.
Les analystes Tier 1 sont particulièrement touchés par ces difficultés, engendrant des conditions de travail difficiles. Nous pensons que la visualisation de sécurités, associée à une meilleure collaboration au sein des SOCs, est une réponse à ces problèmes.
Visualisation de sécurité
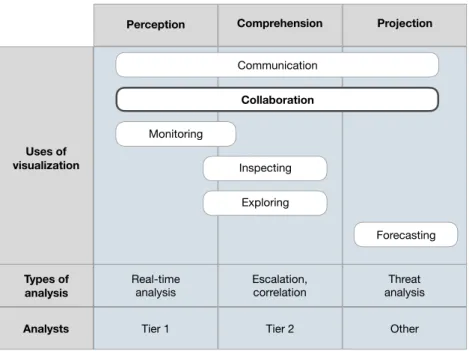
La visualisation de sécurité au sein des SOCs est utilisée avec plusieurs objectifs. Dans cette thèse nous avons passé en revue les solutions de visualisation de sécurité selon le concept de connaissance situationnelle. La connaissance situationnelle se définit selon trois étapes qui sont la perception, la compréhension, et la projection, ainsi que cinq cas d’utilisation : la supervision, l’inspection, l’exploration, la prévision, et la communication. Nous proposons un sixième cas d’utilisation qui est la collaboration car collaborer est une nécessité pour les analystes travaillant au sein d’un SOC. La collaboration entre les analystes de sécurité, tout comme la communication, est un cas d’utilisation transverse aux trois phases de la connaissance situationnelle.
Cette revue des solutions de visualisation de sécurité a mis en avant les différentes techniques avec leurs avantages et leurs inconvénients. Les outils de supervision dédiés aux analystes Tier 1 utilisent des représentations visuelles simples pour que les analystes perçoivent l’état actuel du système d’information. Cependant, le passage à l’échelle de ces solutions est souvent limité, et ces solutions ne sont pas toujours capables de supporter la charge d’une utilisation réelle. Les outils d’inspection et d’exploration proposent plus d’interactions et sont capables d’exploiter plus de sources de données. Ils sont utilisés par les analystes Tier 2, et sont de notre point de vue encore insuffisants par rapport aux limites que nous avons exposées concernant la progression de la menace et le rythme du réseau. Les solutions de prévision sont moins présentes dans la littérature scientifique, et exploitées généralement dans les SOCs ayant une certaine maturité sous le nom de threat
intelligence.
Alors que les analystes ont besoin de collaborer et de communiquer au sein d’un SOC, il semble y avoir un manque de solution visuelle pour effectuer ces tâches. Nous sommes persuadés qu’une manière plus efficace de gérer la large quantité de données est de rendre
la collaboration entre les analystes de sécurité plus simple par une meilleure organisation du processus de travail à travers la visualisation.
VEGAS
Pour faciliter la tâche de triage des analystes Tier 1, nous proposons un outil appelé VEGAS (« Visualizing, Exploring, and Grouping Alerts ») [2, 3]. Cet outil permet de visualiser les alertes IDS dans un espace en deux dimensions, afin de pouvoir ensuite facilement les regrouper. En effet, les alertes de sécurité sont composées de plusieurs dimensions telles que le port source, le port destination, ou encore les adresses IP, et leurs représentations graphiques directes sont difficiles à appréhender pour un analyste n’ayant qu’un court instant pour effectuer sa tâche. C’est pourquoi un algorithme permettant de transposer les alertes suivant une représentation en deux dimensions a été choisi. Cet algorithme doit être efficace d’un point de vue rétention d’information (des alertes similaires doivent être proche sur l’espace deux dimensions), doit passer facilement à l’échelle sur des milliers de données dans un temps contraint, et doit être non supervisé. Ces pré-requis ont orienté notre choix sûr l’analyse en composantes principales.
VEGAS propose ainsi de visualiser les alertes en deux dimensions grâce à l’analyse en composantes principales. Cette représentation permet à l’analyste de rapidement trouver des ensembles d’alertes ayant des caractéristiques similaires. Les ensembles d’alertes identifiés sont ensuite diagnostiqués à l’aide de représentations visuelles des caractéristiques de ces alertes. L’analyste Tier 1 peut sélectionner les caractéristiques qui sont pertinentes pour ce groupe. Une règle est générée afin de pouvoir rediriger directement les alertes similaires, passées comme futures, diminuant ainsi le flux de nouvelles alertes non diagnostiquées pour l’analyste travaillant en première ligne. Cette combinaison de l’analyse de données et de la visualisation est le cœur de notre proposition.
VEGAS permet de répondre à la limite technologique du nombre élevé d’alertes pour les analystes Tier 1. En outre, VEGAS est aussi une réponse concernant la répétitivité des tâches et le manque de créativité touchant ces analystes. En effet, de part la création de règles redirigeant les alertes similaires, les analystes Tier 1 n’ont plus à traiter plusieurs fois les mêmes alertes et peuvent se concentrer sur les alertes jusque là non rencontrées. De plus, la création de règles suite à une analyse rapide des alertes permet de répondre à la monotonie de la tâche due au manque de créativité.
Nous avons tout d’abord évalué VEGAS à l’aide d’un cas d’utilisation (challenge VAST 2012 [5]) puis nous avons interrogé douze experts-analystes de sécurité, de sexe masculin avec une à dix années d’expérience dans ce milieu. Les retours de ces tests sont positifs. Tout d’abord ils confirment la pertinence du problème de triage des alertes que nous cherchons à résoudre. Ensuite, les experts ont positivement évalué les visualisations et les interactions proposées par notre outil. Enfin, ils ont déclaré que VEGAS permet une amélioration de la productivité des analystes Tier 1 au sein des SOCs.
TheStrip
Les entretiens avec les experts nous ont permis de mettre en avant le manque de collaboration au sein des SOCs, et les limites qui en dérivent. Pour remédier à celles-ci, nous proposons TheStrip [4], un nouveau processus de collaboration entre les différents analystes et un outil associé pour mettre en œuvre ce processus.
Notre processus est basé sur le concept de méta-évènements, avec l’introduction d’une boucle de retour entre les analystes Tier 1 et les analystes Tier 2. Nous étendons les règles définies avec VEGAS pour regrouper les évènements en méta-évènements, permettant une division dans le temps des évènements capturés par une règle et une meilleure collaboration entre les analystes. Une fois la règle créée par un analyste Tier 1, les analystes Tier 2 peuvent ajouter des caratéristiques liées au temps, modifier la règle si besoin, et renseigner les différentes personnes coopérant dans la résolution de ces évènements de sécurité. Ce processus permet aux évènements identifiés par les règles d’être redirigés directement vers les analystes dédiés à ce type d’évènement. En outre, les analystes Tier 2 peuvent relier les meta-évènements afin de retracer les scénarios d’attaques.
Nous avons développé un outil pour mettre en oeuvre ce processus. Cet outil permet une perception rapide de la situation actuelle système à l’aide d’une vue sous forme d’une
timeline. Les interactions de cette vue permettent aux analystes de visuellement corréler
les méta-évènements et de reconstruire facilement les scénarios d’attaques. Des vues dédiées proposent la visualisation et la modification des règles pour les méta-évènements et les scénarios.
Ainsi TheStrip permet de répondre au manque constaté de retour envers les analystes Tier 1. Ceux-ci sont avertis des changements effectués sur les règles et peuvent comprendre les raisons de ce changement. Les fonctionnalités offertes par l’outil sont également une réponse aux limites de la progression de la menace et du rythme du réseau grâce aux représentations proposées.
Conclusion
Au cours de cette thèse, nous avons cherché à améliorer la supervision de sécurité. Nous avons explicité les limites des SOCs et montré que les solutions actuelles de visualisation de sécurité ne permettent pas de répondre complètement à ces limites. Nous avons proposé des solutions pour y remédier avec VEGAS et TheStrip. VEGAS assiste les analystes Tier 1 pour le triage des alertes avec des représentations adaptées et la création de règles. TheStrip renforce la collaboration entre les différents analystes au sein des SOC grâce à un nouveau processus associé à un outil de visualisation.
Acknowledgements
First of all I would like to express my gratitude to my advisors Christophe Bidan, Frédéric Majorczyk, and Nicolas Prigent for their guidance throughout this thesis. I had a great freedom in the choice of my research subjects and I appreciate all your contributions of time and ideas to make my PhD experience stimulating.
Completing this work would have been all the more difficult were it not for the support provided by the other members of the CIDre team. You have been companions in countless informal discussions, billiard games and pints, and a source of friendships as well as good advice. I thank you for making this research journey a pleasant experience.
During this thesis, I encountered some technical difficulties and I am especially grateful to Christopher Humphries for his guidance in these moments. You have been so helpful.
I am also grateful to the members of the DGA who took the time to test my work. Your feedback and comments were invaluable in making this thesis more relevant to the needs of security experts.
I want to express my deepest gratitude to my parents and my family for their endless support and constant encouragement I have gotten over the years. During this thesis, I have been amazed by your willingness to proof read countless pages of my work. Finally, I would like to thank Lauriane for her continued support and encouragement, especially during the final stages of this PhD. You lovingly tolerated my long hours of work, thank you.
Contents
Chapter 1 • Introduction 1
1.1 Information systems and security monitoring . . . 2
1.2 Research objectives and contributions . . . 3
1.3 Thesis structure . . . 4
Chapter 2 • Security operations centers 5 2.1 A brief history of security operations centers . . . 6
2.2 Missions . . . 7
2.3 Architecture . . . 8
2.4 Organizational model of the incident management zone . . . 11
2.5 Limitations of Security Operations Centers . . . 16
2.5.1 Technology challenges . . . 16
2.5.2 Process problems . . . 17
2.6 Conclusion . . . 19
Chapter 3 • Security visualization inside security operations centers 21 3.1 Situational awareness and purpose of visualization for security . . . 22
3.1.1 Situational awareness . . . 23 3.1.2 Other classifications . . . 24 3.2 Monitoring . . . 26 3.2.1 Scatterplots . . . 27 3.2.2 Link graphs . . . 27 3.2.3 Treemaps . . . 30 3.2.4 Three-dimensional techniques . . . 31 3.2.5 Interaction . . . 31 3.2.6 A priori processing . . . 32 3.3 Inspecting . . . 32 3.4 Exploring . . . 35 3.5 Forecasting . . . 35 3.6 Communication . . . 37 3.7 Collaboration . . . 37 3.8 Conclusion . . . 38
Chapter 4 • Visualization for quick triaging 41
4.1 Working with security alerts . . . 42
4.1.1 IDSes alerts as a data source . . . 42
4.1.2 Displaying alerts . . . 43
4.1.3 Computing PCA . . . 46
4.1.4 Workflow . . . 47
4.2 VEGAS interface . . . 47
4.2.1 Overview of the interface . . . 47
4.2.2 Analyzing alerts . . . 50
4.2.3 Generating relevant filtering rules . . . 52
4.2.4 Viewing filtering rules . . . 53
4.3 Implementation and evaluation . . . 53
4.3.1 Implementation . . . 53
4.3.2 Evaluation . . . 56
4.3.3 Use case . . . 56
4.3.4 Evaluation by experts . . . 59
4.4 Conclusion . . . 63
Chapter 5 • Visualization for collaboration between security analysts 65 5.1 Current process in security operations centers . . . 66
5.2 The process . . . 68
5.2.1 Security meta-events and their rules . . . 68
5.2.2 Proposed workflow . . . 71
5.3 Visualization for collaboration . . . 73
5.3.1 Interface components . . . 73
5.3.2 The timeline view . . . 75
5.3.3 The rules view . . . 79
5.3.4 The scenarios view . . . 81
5.4 Implementation . . . 81
5.5 Discussion . . . 83
5.6 Conclusion . . . 84
Chapter 6 • Conclusion and perspectives 85 6.1 Summary . . . 85
6.2 Future research directions . . . 86
Appendices 89
Glossary 95
List of Figures
2.1 Conceptual technical architecture of a SOCaccording to Joseph Muniz et
al. [33] (adapted). . . 10
2.2 Illustrative diagram of the architecture of a security incident detection service according to the ANSSI [9], version 2.0. . . 11
2.3 Organizational model of the SOC incident management zone according to the CLUSIF. . . 14
2.4 Organizational model of a SOC according to the MITRE. . . 15
3.1 Map of the successive losses in men of the French Army in the Russian campaign 1812–1813 by M. Minard. . . 23
3.2 Relationship between the stages of situational awareness and the uses of visualization, the types of analysis performed, the analysts using those types of visualization. Modified version based on [60], with our addition of collaboration and the analysts. . . 25
3.3 Snapshot of SnortView [67] . . . 28
3.4 NIMBLE interface [71] . . . 29
3.5 VisAlert [74] . . . 29
3.6 Treemap visualization for BANKSAFE [77] . . . 30
3.7 Overview of DDoS attack by Anonymous in DAEDALUS [79] . . . 31
3.8 Visualization Dashboard of [82] . . . 33
3.9 An overview of CORGI [83]. . . 34
3.10 User interface to visualize queries with conditional attributes [84]. . . 34
3.11 Visualization of a spam campaign with [85]. . . 35
3.12 Main view of BURN [89] . . . 36
3.13 VIAssist report [91] . . . 38
3.14 OCEANS [93] collaboration diagram. . . 39
4.1 A Snort alert. . . 43
4.2 VEGAS workflow. . . 48
4.3 VEGAS interface for Tier 1 analysts (beginning). . . 49
4.4 Before filtering on the scale. . . 51
4.6 A rule generated to filter alerts for two servers giving or receiving orders
to or from a botnet using the IRC protocol. . . 53
4.7 Representation of filtering rules over time. . . 54
4.8 Evolution of alerts filtered by rule2. . . 55
4.9 Rules list. . . 55
4.10 Representation after the 4 000 first alerts. . . 57
4.11 Alerts by destination port. Given the distribution, it may be a scan. . . . 58
4.12 Years of experience of our panel for each participant. . . 59
4.13 Q1: Is the problem relevant? . . . 60
4.14 Q2: Are the proposed visualizations relevant for our problem? . . . 61
4.15 Q3: Are the proposed interaction relevant for our problem? . . . 62
4.16 Q4: Is VEGAS usable? . . . 62
4.17 Q5: Will VEGAS improve the productivity of Tier 1 analyst? . . . 63
5.1 Current organization of SOCs with their limitations. . . 67
5.2 Division of security events filtered by a rule in security meta-events. . . . 69
5.3 Proposed workflow for a SOC. . . 72
5.4 Progression of security events. . . 74
5.5 Timeline view. . . 76
5.6 Timeline view after some manipulations. . . 78
5.7 Manual addition of a qualified incidents or a suspicious meta-events. . . . 79
5.8 Rules view (beginning). . . 80
5.9 Scenarios view. . . 82
A.1 Bank of Money Regional Headquarters Network. . . 91
List of Tables
1
Introduction
Contents
1.1 Information systems and security monitoring . . . 2 1.2 Research objectives and contributions . . . 3 1.3 Thesis structure . . . 4 Our world relies on information and computing systems. With mobile devices, computers, servers, the Internet, and IoT1 products, our addiction to a connected world is increasing. The adoption of IT systems has created a new playground for attackers. Data breaches and intrusions occur daily aiming at a wide range of targets going from end users to governments including large and small companies. Attackers have been so successful that in 2012 at the RSA Cyber Security Conference, the director of the FBI, Robert S. Mueller, stated [6]:
I am convinced that there are only two types of companies: those that have been hacked and those that will be. And even they are converging into one category: companies that have been hacked and will be hacked again.
His assessment still stands nowadays. Attackers are now well organized and can be sponsored by nation states meaning they have more resources and better technical skills, resulting in even more severe damages. The WannaCry ransomware [7] hit the headlines in 2017 with total damages ranging from hundreds of millions to billions of dollars. The United States, the United Kingdom, and Australia attributed this attack to North Korea.
Successful attacks do not just result in a loss of money: they also reveal personal information. The consumer credit report agency Equifax2 was featured on the headlines of news articles after losing the personal data of more than 145 million US citizens [8].
Firewalls, antivirus, secure programming, configuration hardening or cryptography are used to enforce the security policy and avoid security incidents3. However, proactive
1Internet of Things
2https://www.equifax.com/
3A security incident is defined as a single or a series of unwanted or unexpected information events
security i.e., measures taken to prevent perceived threats, are insufficient to protect information systems. Security incidents cannot be entirely prevented. Breaches will be found on information systems and attacks will be successful. The attackers only have to discover one way in while defenders have to defend the whole perimeter of the information systems.
This asymmetry brings an intense focus on incident detection, investigation, and reaction capabilities. While automated tools exist that try to detect and stop attacks reactively, their efficiency is still partial and intrusions are still occurring on information systems. Given the complexity and the evolving techniques of current and future attacks, these automated tools often fail to detect attacks and to adapt to the new threats. Humans with their contextual knowledge and intuition have a crucial part in incident detection, and we are convinced that this situation will continue. Even more, we advocate that humans have to increasingly collaborate together to understand the organization’s network, do the security data triaging, investigate the problems and remediate them.
This context and the motivations are presented more deeply in the first part of this introduction, with the description of security monitoring for information systems. Then we sum up the contributions of this thesis and present the structure of this document.
1.1 Information systems and security monitoring
Reactive capabilities, detection and reaction to threats, are often concentrated within a cybersecurity operations center (SOC) dedicated to handling security events and security incidents. The first SOCs were designed around 1990 [10] and nowadays most large information systems are monitored by one. SOCs are either internal or outsourced and managed by another company.
The most prominent and time-consuming activity of a SOC is monitoring, meaning triage and analysis of large numbers of security events. A typical SOC collects from thousands to hundreds of millions of security events every day [10] with the objective of finding which of them require priority attention. Among the numerous data feeds that are available, the primary source of security events are intrusion detection systems (IDSes).
While IDSes have proven to be useful, they are well-known to raise large quantities of alerts, with more than 90% of them unrelated to relevant security issues [11, 12]. The high volume of irrelevant security events and the way they are currently handled lead to the fact that real attacks are often missed and ignored. Consequently, there may be a significant delay (up to several months) between an intrusion and its discovery [13, 14], resulting in severe damages to the company owning the targeted information system. An extreme example is the Yahoo!4 data breaches [15]. A first data breach occurred in August 2013, followed by a second in late 2014. Both breaches were discovered in July 2016. Three billion Yahoo! accounts were impacted with names, email addresses, telephone numbers, dates of birth, and other personal information of users revealed.
The high number of security events to be reviewed by security analysts also put them under pressure. They have to answer immediately and correctly to the alerts raised by IDSes. This pressure leads to poor judgments when looking at security events. Security analysts sit all day in front of a computer screen, looking through thousands of raw alerts and security events coming from IDSes and multiple sensors to ignore them or escalate them, with the anxiety of missing real alerts tied to an actual attack. As a consequence security analysts suffer from a high burnout rate [16] and the turn-over is high.
1.2 Research objectives and contributions
This thesis contributes to improving system security monitoring and helping security analysts in collaborating and discovering intrusions inside information systems. SOCs are complex organizations which require specific knowledge of their internal mechanisms in order to improve their efficiency and solve these problems. The initial step towards this objective is a better understanding of its operations, and then the expression of the root reasons for the current situation.
First of all, fully automatic systems are not the silver bullet to maintain the security of information systems. We advocate that an efficient way to handle a large number of alerts and events is to make collaboration among security operators easier by better organizing the workflow through visualization [17, 18]. Visualization enables human analysts to stay in the loop, help them interact with the data and easily understand the context. Visualization for information systems security is a growing field, yet few pieces of work are specifically targeting security analysts working in SOCs.
The main contributions of this thesis are as follows:
• the review of SOCs and their organizations resulting in the expression of their limitations, classified in two different categories: technology and process. This review gives a reliable starting point for the two next contributions of this thesis and the development of adequate solutions for the security analysts working in SOCs.
• VEGAS [2, 3], an alerts visualization and classification tool that allows first line security operators to group alerts visually based on their principal component analysis (PCA) representation. VEGAS is included in a workflow in such a way that once a set of similar alerts has been collected and diagnosed, a filter is generated that redirects similar alerts to other security analysts that are specifically in charge of this set of alerts, in effect reducing the flow of raw undiagnosed alerts.
• TheStrip [4], a new collaboration process and a design prototype to enhance the cooperation between security analysts inside SOCs in order to quickly process security events and define a better workflow that enables them to efficiently exchange feedback.
Alongside these contributions, we also review visualization tools and their techniques according to situational awareness, with our addition of collaboration between security
analysts as a use case for situational awareness. This review shows us the lack of collaboration features of current solutions, and the different strengths and weaknesses of visualization techniques.
1.3 Thesis structure
Chapter 2 presents a literature review on security operations centers, based on three criteria: missions, architecture, and human organization. This review exposes the current limitations of SOCs with respect to two aspects, process and technology.
Chapter 3 discusses applications of visualization in cybersecurity inside SOCs. It describes the different use cases and how current visualization solutions try to answer the identified limitations are described.
Chapter 4 tackles the issue of triaging large quantities of alerts with our contribution, VEGAS [2, 3], an intuitive visualization tool that allows grouping similar alerts easily and dispatching these groups of alerts among security operators for further analysis.
Chapter 5 is dedicated to TheStrip [4], our new process and tool to enhance collabo-ration between security analysts.
2
Security operations centers
Contents
2.1 A brief history of security operations centers . . . 6 2.2 Missions . . . 7 2.3 Architecture . . . 8 2.4 Organizational model of the incident management zone . . . 11 2.5 Limitations of Security Operations Centers . . . 16 2.5.1 Technology challenges . . . 16 2.5.2 Process problems . . . 17 2.6 Conclusion . . . 19 Security operations centers are the central point for monitoring, analyzing and acting on threats so as to prepare for, detect and respond to security incidents. SOCs are receiving large amounts of data and security analysts are collaborating to discover the intrusions and attacks inside them. Most security analysts are struggling to efficiently accomplish these objectives, and real attacks are often missed and ignored [19], lost among the data stored by SOCs. Consequently, there is often a delay measured in months between an intrusion and its discovery, resulting in harmful repercussions for the victim organization.
Another important aspect is that the pressure put on security analysts in SOCs results in poor judgments when looking at security events and in a high burnout rate [16]. Due to this fact, the period of work of a security analyst generally spans between one to three years [20].
In this chapter, we provide a brief history of SOCs to understand their evolution over time. We then explain in details the functions they provide. We then explore two essential aspects of SOCs: system architecture and human organization. We advocate that taking these two aspects into account is necessary to cover the whole perimeter of a SOC on different scales and to draw the global picture. For each aspect, we differentiate the technology from the process. Based on these aspects, we finally highlight the current limitations inside SOCs into two categories: technology and process.
2.1 A brief history of security operations centers
The origins of computer security date back to 1975 with the creation of antivirus and firewall software, and their usage in government and military organizations [21]. Indeed with the creation of computer networks, first intrusions and abuses appeared. For instance as soon as 1979, Kevin Mitnick broke into the computer network of the American corporation DEC (Digital Equipment Corporation) and copied their software [22]. In this period of time, due to the low bandwidth, the computer security of an organization was handled by a single person having skills in network technologies.
The first generation of SOCs started around 1990. At this time, computer security was no more reserved for governments and military organizations and large organizations started to design and build their SOCs [10]. Attackers of that era created worms and bots to amplify their actions, like the Happy99 computer worm for Microsoft Windows [23]. SOCs reacted to these new attacks by focusing on intrusion detection and companies began to sell IDSes (Martin Roesch created the Snort1 IDS in 1998) and firewalls (the
first commercial firewall was DEC SEAL in 1991). The concept of security information event monitoring (SIEM) was introduced at the end of this generation with aggregators and correlators [21]. We can see that in this first generation of SOCs the response to intrusions was a technical one with the development of products.
The numbers of attacks increased rapidly after 2000. States constituted national CERT (Computer Emergency Response Team) to handle computer security incidents. This is an evolution from the first CERT founded in 1988 by the CERT Coordination Center at Carnegie Mellon University. In 2000, in France, the Prime Minister set up the CERTA (now CERT-FR2). The United States Congress created the US-CERT3 in 2003, with the responsibility to analyze and reduce cyber threats and vulnerabilities, disseminating cyber threat warning information and coordinating incident response activities to cyber defense, incident response, and operational integration center [24]. The same year, California state law SB 1386 [25] regulated the privacy of personal information, becoming the first US breach notification law. Along with adhesion to security and data protection standards and legal requirements, SOCs formalized their procedures and focused on early detection capabilities and prevention rather than strictly detection. This second generation was a turning point: the answer to digital threats was no longer only technical but involved processes and legal requirements.
The end of that decade was marked by the beginning of sophisticated and state-sponsored attacks, like the first publicly known cyberwar consisting in the Russian aggression on Estonia in 2007 [26] or the Stuxnet Trojan targeting Iranian SCADA systems in 2010 [27]. Organizations became aware that intrusions happen regardless of the deployed security measures and SOCs worked on improving exfiltration detections and containment capabilities [21]. This third generation of SOCs also induced the development of information sharing since no single SOC had all the data necessary to detect all threats
1https://www.snort.org/ 2https://www.cert.ssi.gouv.fr/ 3https://www.us-cert.gov/
and SOCs understood that they needed to collaborate to meet their objectives. SOC exchanged indicators of compromise (IOCs), such as virus signatures or hash values, to collectively improve their detection capabilities. Even if this exchange was already happening between the CERT Coordination Center and its partners for instance, this generation is marked by the increasingly active information sharing activity [21].
Nowadays the rate of attacks is still increasing, and the amount of data handled by SOCs has never been so high. The missions of the SOCs have extended over time. They now have to detect threats, prevent them and even forecast them with threat intelligence. Constant collaboration among organizations is now fundamental to improve security by maintaining up-to-date information and awareness.
2.2 Missions
We showed that SOCs have adapted continuously to face evolving threats. We argue that this evolution was following a reactive process and not a proactive one: when new threats emerged, modifications were made. We should underline that SOCs was not a central topic in the scientific community of computer security and the literature was mainly written by SOCs vendors or detection services providers. This section details the different missions that a SOC should or can provide according to the literature.
McAfee [28], Fortinet [29], Hewlett Packard Enterprise [20, 30], Splunk [31], or IBM [32] have all released white papers. Joseph Muniz, architect at CISCO, wrote a full book about operating SOCs [33]. Consulting groups like EY [34], Deloitte [35] or Tata Consultancy Services [36] also have edited guides on how to manage SOCs. The security consultant David Nathans wrote in 2015 a guide [37] on this subject. Other documents describing SOCs and best practices were written by institutes, agencies or magazines: The Information Security Journal [38], MISC [39], the SANS Institute [40], CLUSIF [41], MITRE Corporation [10], ANSSI [9] or the NIST [42]. Each of these documents gives a specific view of SOCs. For instance, CLUSIF [41] focuses on how to start a SOC from nothing, and Saâd Kadhi [39] shows tools dedicated to a SOC. All these documents agree on the fact that SOCs must enable business continuity and efficient recovery as well as prevent threats from impacting the business. SOCs also have to provide insightful risk and compliance reporting, and ensure that groups managing critical infrastructure components from a regulatory perspective are aware of potential threats to enable quick remediation of risks.
In 2013, Jacobs et al. [43] observed that there was no model to measure the effectiveness of SOCs. They proposed to evaluate a SOC through the functions it provides (named
capabilitites) and the maturity of these functions. The capabilities cited by Jacobs et al.
are divided into two groups, primary and secondary. Primary capabilities are essential to a SOC while secondary capabilities are functions offered in addition to the primary SOC capabilities. The list of capabilities offered by Jacobs et al. is technical. For instance, Jacobs et al. emphasizes log collection, retention, archival, and correlation. However, this paper lacks some capabilities like triaging or collaboration with other SOCs, and the adequacy of the architecture and the relevance of human processes are not evaluated.
A more complete list of capabilities a SOC is given in the report of Carlos Zimmerman for the MITRE Corporation [10]. This report updates the work done by West-Brow et al. [44] and aims at giving an as complete as possible list of capabilities. We separate the capabilities proposed by Zimmerman between primary and secondary, following Jacobs et al., in order to highlight the essential ones. The primary capabilities are:
• Real-Time Analysis. A SOC is the place to receive reports about security events and to do a real-time triage of data feeds to detect potential intrusions. This capability is described in the literature as the most significant offered by a SOC.
• Intel and Trending. A SOC collects and analyzes cyber intelligence. This includes the creation of new signatures, long-term analysis of event feeds, and threat assessment.
• Incident Analysis and Response. Security analysts working in the SOC perform an in-depth analysis of potential intrusions and provide recommendations on how to respond. This includes tradecraft analysis, countermeasures implementation and sometimes the actual response.
• Artifact Analysis. Gathering, storing and analyzing artifacts such as malware, network traffic or data from mobile devices are part of the capabilities of a SOC.
• Audit and Insider Threat. A SOCs collects data for long-term retention to enable further audits or analysis. It may be the support for insider threat analysis and investigation.
• Scanning and Assessment. A SOC maps its constituency networks to understand them better. The scan includes vulnerability scanning to find weaknesses in the network. Analysts working in SOCs can also perform penetration testing and red teaming to simulate attacks and test the security of the system.
Secondary capabilities are:
• SOC Tool Life-Cycle Support. The SOC contributes to its own IT, including ensuring the security of devices like the firewalls or proxies. This capability involves tuning the diverse sensors as well as developing original tools and signatures if needed. Staying up to date with the threat model implies to monitor the evolution of the commercial tools and the research in this domain.
• Outreach. A SOC can extend its core functions with product assessment, security consulting, training and awareness building, situational awareness, redistribution of adversary’s tactics, techniques and procedures as well as media relations.
2.3 Architecture
White papers from SIEM or SOCs providers focus on how to implement their solutions in an information system. They emphasize the central place of their solutions in the
security of the information system. They describe what are the different components of their solutions and how to link the different data feeds like the firewalls or the IDSes to their tools. These specific frameworks do not show the global architecture of a SOC. For instance, the architecture given by HP [30] only shows how the connectors, the data-centers and the correlation tools work together, but not how they interact with the capabilities of a SOC.
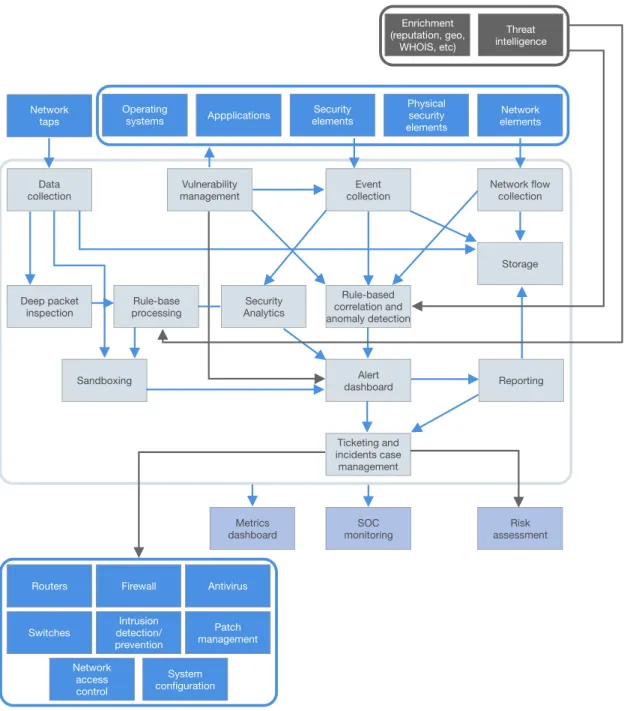
Joseph Muniz et al. [33] try to regroup all the SOC technologies under a cohesive architecture shown in Figure 2.1. This architecture depicts a possible organization of components and their relationships. On top, the data sources, divided between internal data and external data, constitute the input of the SOC. Then the SOC’s technologies (event collection, storage, correlation and so forth) are communicating together to efficiently use these inputs. At the bottom, alerts and actions constitute the output of the SOC. The arrows in this figure represent the relations between the diverse components. For instance, the alert dashboard uses the results from the anomaly detection. This architecture illustrates the different components of a SOC. However, it stays still close to the technology.
We believe that this technical approach to the architecture does not suffice to fully understand a SOC. The architecture of a SOC can be approached with a less technical and higher level point a view. For instance the French Cybersecurity Agency4 (ANSSI, Agence nationale de la sécurité des systèmes d’information) has edited a document that describes all the requirements a security incident detection service must comply with [9]. In this document, and in accordance with the capabilities of a SOC described before, three distinct activities are mandatory: event management i.e. collection and storage of security events, incident management i.e. identifying, qualifying and managing security incidents, and reporting i.e. to communicate with the targeted information system stakeholders. If a SOC does not comply with the requirements, it can not be endorsed by the ANSSI for certain missions.
The agency takes into account the three activities cited previously to design the architecture of a SOC. The reference architecture published by the ANSSI is shown in Figure 2.2. This architecture is independent of software solutions or technologies.
First, the SOC is separated from the information system it monitors, and the SOC is located in a trust zone. Even if the SOC is internal, it should be separated from the monitored system to prevent compromise of the SOC from the monitored network. The events gathered from probes are collected on the monitored information system and then sent through a safe connection to a collection zone inside the SOC, as presented on the left part of Figure 2.2. This first part constitutes the event management activity.
Events are then used in the analysis zone. Using dedicated tools, security analysts group events into meaningful incidents and are able to understand the situation of the information system.
The third step is the transfer of the incidents to a zone dedicated to report to the stakeholders of the monitored systems. Operators inside the SOC must transmit their findings to them and help in providing an appropriate response with the collaboration
Network taps
Vulnerability management Data
collection collectionEvent Network flowcollection Storage Rule-based correlation and anomaly detection Security Analytics Rule-base processing Deep packet inspection Alert dashboard Ticketing and incidents case management Reporting SOC
monitoring assessmentRisk Metrics dashboard Firewall Antivirus Routers Intrusion detection/ prevention Patch management Switches System configuration Network access control Sandboxing Security elements Physical security elements Network elements Appplications Operating systems Threat intelligence Enrichment (reputation, geo, WHOIS, etc)
Figure 2.1: Conceptual technical architecture of a SOCaccording to Joseph Muniz et al. [33] (adapted).
Commissioning entity’s internal Information System Collection sources Supervised perimeter Legend Activity Trust zone IPsec VPN SOC - Security incident detection service Information System
Operator
Commissioning entity
exchange zone Reporting zone Incident management Event management Collector Collection Enclave Analysis zone Analysis tools Storage Collection zone Events Reporting management Web portal + storage Security manager Consultation workstation Mobile workstation Consultation enclave Notification Events Incidents
Figure 2.2: Illustrative diagram of the architecture of a security incident detection service according to the ANSSI [9], version 2.0.
of the security manager. This appears on the right part of the figure. This reference architecture enables a clear separation between the different activities. Separations of activities must be taken into account when designing the network architecture which helps in ensuring defense in depth.
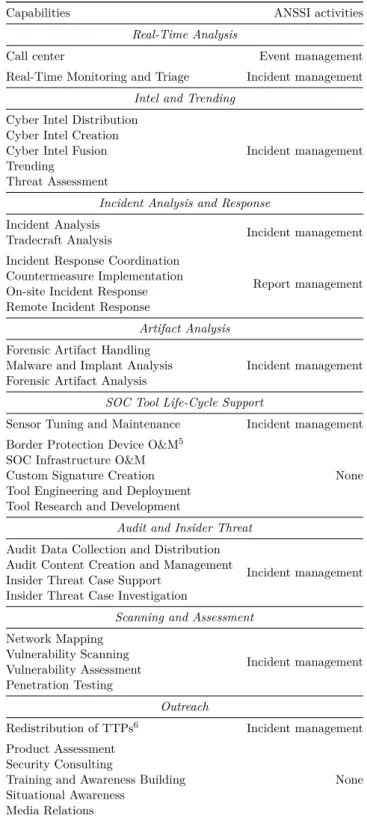
The classification of the capabilities of a SOC according to the ANSSI activities is in Table 2.1. This table shows that the capabilities not linked to an ANSSI activity are those which are secondary to assist the primary activities of a SOC.
After this presentation of the global picture of a SOC, the next phase is to focus on the incident management zone. This zone is arguably the most important of a SOC, where security analysts accomplish their jobs. Security data is analyzed and response to threat created in this zone. Section 2.4 presents its organization.
2.4 Organizational model of the incident management zone
SOC members should be able to analyze large volumes of data and know when to carry out further investigations. They also must have the appropriate training to deal with the evolving nature of the job of security analyst. Therefore, having a successful SOC requires security analysts with a broad range of skills and a variety of experiences.
Capabilities ANSSI activities
Real-Time Analysis
Call center Event management
Real-Time Monitoring and Triage Incident management
Intel and Trending
Cyber Intel Distribution
Incident management Cyber Intel Creation
Cyber Intel Fusion Trending
Threat Assessment
Incident Analysis and Response
Incident Analysis
Incident management Tradecraft Analysis
Incident Response Coordination
Report management Countermeasure Implementation
On-site Incident Response Remote Incident Response
Artifact Analysis
Forensic Artifact Handling
Incident management Malware and Implant Analysis
Forensic Artifact Analysis
SOC Tool Life-Cycle Support
Sensor Tuning and Maintenance Incident management Border Protection Device O&M5
None SOC Infrastructure O&M
Custom Signature Creation Tool Engineering and Deployment Tool Research and Development
Audit and Insider Threat
Audit Data Collection and Distribution
Incident management Audit Content Creation and Management
Insider Threat Case Support Insider Threat Case Investigation
Scanning and Assessment
Network Mapping Incident management Vulnerability Scanning Vulnerability Assessment Penetration Testing Outreach
Redistribution of TTPs6 Incident management
Product Assessment
None Security Consulting
Training and Awareness Building Situational Awareness
Media Relations
In a report dedicated to building a SOC [41] from scratch, the CLUSIF7 provides a workflow and specify how security analysts collaborate inside the incident management zone.
The security analysts of a SOC are separated in several categories, each with different duties. Tier 1 analysts are, in number, the biggest category. They are responsible for continuously monitoring the alert queue, triaging security alerts, monitoring the health of security sensors and endpoints as well as collecting data and context information necessary to initiate Tier 2 tasks. The tasks performed by Tier 2 analysts consist in fulfilling deep-dive incident analysis by correlating data from diverse sources, determining if a critical system or dataset has been compromised, advising on remediation and reporting periodically to the SOC manager.
According to the CLUSIF Tier 1 and Tier 2 analysts cooperate in two processes shown in Figure 2.3:
• The detection process. This process is shown in green on top of Figure 2.3. The Tier 1 analyst is responsible for the quick triage of the security alerts. If the security alert is associated with a written procedure, the Tier 1 analyst follows it; otherwise, he or she calls a Tier 2 analyst, who will execute the qualification process.
• The qualification process. This process is shown in blue on the Figure 2.3. Tier 2 analysts study the given set of security alerts and try to better understand them. Depending on the result of their analysis, Tier 2 analysts follow a procedure related to the incident if it exists or design new procedures.
Dealing with education and experience, Tier 1 analysts hold a Bachelor and a few years of experience while Tier 2 analysts usually hold a Master degree and several years of experience.
Tier 1 and Tier 2 analysts are under the supervision of the SOC manager who is responsible for prioritizing work and organizing resources to ensure that the SOC is running efficiently. He or she manages resources (personnel, budget, shift scheduling and technology strategy) to meet the SLAs8. He or she communicates with management and other authorities, serves as the primary contact for business-critical incidents, and provides overall direction for the SOC and input to the global security strategy. The SOC manager also handles internal and external communications.
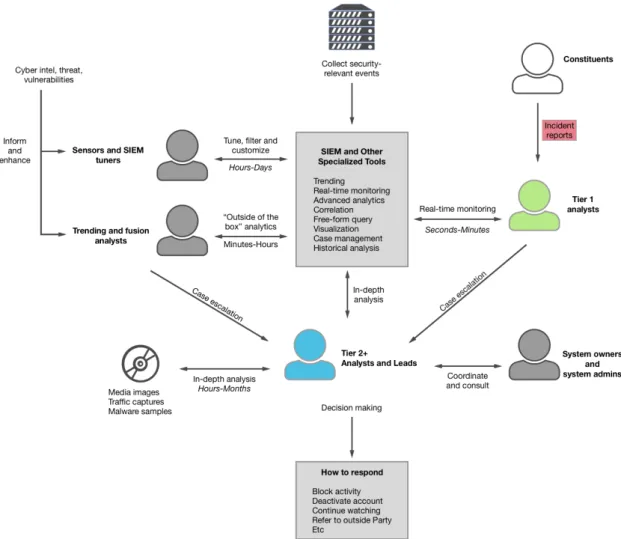
When the size of a SOC increases, other positions exist to fulfill specific capabilities [10]. Regarding the security analysts, there are sometimes Tier 3 analysts who take over Tier 2 analysts when specific analysis techniques are needed. Some SOCs may have trending analysts, scanning analysts, or product assessment analysts, having specific skills in these fields. Moreover, the SOC tool life-cycle support capabilities can be accomplished by dedicated engineers. The MITRE Corporation proposes a representation for a SOC with these positions (see Figure 2.4). Systems administrators and owners collaborate with
7https://clusif.fr/
8Service-Level Agreement. A SLA is a commitment between two or more parties, usually a service
provider and a client. Particular aspects of the service (quality, availability, responsibilities) are agreed between the parties.
Figure 2.3: Organizational model of the SOC incident management zone according to the CLUSIF.
Tier 2 analysts to find an appropriate response. Another source of case escalation, in addition to the Tier 1 analysts, are the security analysts doing sensors tuning and “out of the box” investigation. This representation details the timeframe given to each analyst. Tier 1 analysts only get a few seconds or minutes to accomplish their task, whereas Tier 2 analysts have more time, up to several months, to perform in-depth investigations.
2.5 Limitations of Security Operations Centers
A report of MWR InfoSecurity [45] focusing on the reasons why SOCs are failing stated that around 5 percent of the 100 attacks they simulate to evaluate SOCs are actually detected. So SOCs often missed attacks, the sign of these attacks being hidden among all the data stored. In its threats report from December 2016 [46], McAfee states that 93 percent of SOC managers are overwhelmed by alerts and unable to triage all potential threats. This alerts’ overload leads to organizations being only able to investigate 25 percent of their security alerts. We assert that this is due to intrinsic limitations. In this section, we present the current limitations of SOCs, divided into two categories: technology challenges, and process challenges.
2.5.1 Technology challenges
SOCs face technology challenges related to data, the progression of threat, and knowledge of the rhythm of the network.
Lots of unlinked data and data sources
For Tier 1 analysts, the main source of data is the security alerts from the IDSes. IDSes are categorized into two complementary types, knowledge-based and behavior-based [47]. Knowledge-based IDSes detect intrusions through established patterns of well-known attacks such as signatures. When a known pattern is detected, an alert is raised. This approach requires a complete and up-to-date knowledge base of attacks patterns, otherwise attacks will not be detected. This means that zero-day attacks do not raise an alert. This type of IDSes generates many false positives, i.e. alerts that are not related to an effective attack due to erroneous detection rules or incorrect tuning of the IDS.
Behavior-based IDSes detect a deviation from the normal or expected behavior of the system or the users. This means that the correct behavior must be learned or defined before. The IDSes then compare the reference model with the current activity and raise an alert when it observes a deviation. If the training phase is too specific, normal behavior marginally different from what has been learned will raise alerts which are false positives. On the contrary, if the model learned is too broad, some attacks will not be captured. Moreover, behavior of users evolves over time. Therefore, the model must be kept up-to-date which is a challenging task.
Even with a single data source, Tier 1 analysts have to face a huge volume of security events and only have seconds or minutes to accomplish their task in order to cope with
the flow of alerts. This challenge also exists for Tier 2 analysts. The amount of data given to them is prodigious, in the order of millions of security events to explore. Even when Tier 1 analysts help them so that they only look at interesting events, there is a lot of data to explore in order to understand threats.
Beyond IDSes, the data sources are various: antivirus, system events, network traffic, various logs. This diversity is a supplementary challenge to Tier 2 analysts, expertise in each of these data sources being required. In addition to the multiple sources of data, the sources used by Tier 2 analysts are not necessarily linked between them. Each data source e.g., IDSes alerts, netflow traces, packet data, web server logs, etc., has its own structure and semantic. Due to this fact, correlation and pivoting in the data is a hard task. Security analysts often have to understand which events are mirrored between the sets of data, how a value is translated from a set to another, etc. An example is the network address translation performed automatically when packets go through some routing devices that make it hard to link data packets and events before and after routing devices.
Progression of threat
Tier 2 analysts evaluate the level of threat of a given alert and investigate the events given the elements of context of the information system. It is particularly important to evaluate if the event is isolated or if it is a part of a bigger scheme. It is also required to discover the technicity of the attack,i.e., it comes from a script kiddy or if the information system if targeted by an APT9. The knowledge of the current context, threats, and incidents currently happening help the Tier 2 analysts to make a decision.
Rhythm of networks
Security analysts responsible for the security monitoring of an information system gain a specific knowledge of the rhythm of their network. They know the particular events happening periodically and what will follow such events. Security analysts frequently do not have the right to modify the sensors of the network, so they learn to deal with such events. In the context of visual security tools, Daniel Best et al [48] named this situation “Cadence of Network”. The understanding of such cadence and the typical amount of errors in the system is currently insufficiently exploited. We should mention that it is a part of the collection strategy required by the ANSSI [9].
2.5.2 Process problems
A SOC is a place of secrecy due to the sensitivity of the information handled and the high workload, making it challenging for researchers to easily investigate this subject. Two anthropological studies of SOCs were performed by Sundaramurthy et al. in 2014 [49] and
9Advanced Persistent Threat. An advanced persistent threat is a broad term used to describe a set of
continuous computer hacking processes, often orchestrated by a intruder or team of intruders targeting a specific entity.
2015 [16] to observe the security analyst burnout happening in SOCs. The collaboration inside a security team is also addressed by Rajivan et al. [50] who employed a hybrid methodology, a mix of field observations and simulations, to focus on the team situational awareness, meaning the global comprehension at a team level of the security events happening in the network. Even if the different teams observed in their study do not have the same objective as a SOC, some observations are relevant to our subject. Their findings, related to process problems, are divided into three categories.
Repetition of the same task
Tier 1 analysts perform repetitive tasks and are spending most of their time following known procedures. When the same type of events keeps coming, they have to repeat the same procedure over and over again.
This aspect is also true for Tier 2 analysts. Because Tier 1 analysts keep sending the same type of events, Tier 2 analysts have to deal with these same events. Even if they do not need to perform an analysis again, the consequence is a loss of time and a diminished perception of the work accomplished by Tier 1 analysts.
Lack of feedback
Once their decision is made, Tier 1 analysts lose track of their actions. They do not have the result of the analysis performed by Tier 2 analysts and therefore will not know if they performed correctly. Furthermore, if a procedure seems inefficient from their point of view, they often do not have the permission to change it. Therefore, Tier 1 analysts feel that they are not correctly empowered by the management, resulting in a decreasing motivation at work over time. Sundaramurthy et al. [16] pointed out that security analysts feel enthusiastic when they see the impact of their effort and perform better.
Lack of creativity
In addition to the repetition of the same task, the creativity of Tier 1 analysts is severely constrained. Creativity refers to the ability of analysts to handle an operational scenario that differs significantly from those they have encountered so far [16]. Tier 1 analysts simply execute the written procedure and stay with what they know; they are not empowered to deviate from the norm if the situation requires it. This results in the failure to react appropriately to a novel operational scenario.
In organizations where procedures are strict and rigid, security analysts burn out more quickly. The lack of rotations between analysts and assignments is also a decreasing factor for the creativity of security analysts.
The limitations we exposed in this chapter are impacting the efficiency of SOCs. Their division in technology and process is the first step to address them. Thanks to the better understanding of the cause of the problems of SOCs, we can propose appropriate solutions to both aspects.
2.6 Conclusion
SOCs are a central place for the security of information systems. Despite the evolution of their missions and tools, they suffer for process and technology limitations. Tier 1 analysts are particularly affected by these limitations, resulting in high burnout rate and strenuous working conditions. The situation of these security analysts is so precarious that organizations are struggling to find candidates for these positions and to keep their employees [51].
We strongly believe that visualization can be a response to the challenges met in cybersecurity, as Daniel Best et al. explained in their paper [48]. The current state of security visualization inside SOCs is the topic of Chapter 3 and the conclusions are then used to tackle the problem of overwhelming data given to Tier 1 analysts. Our proposition for the triaging of security alerts is detailed in Chapter 4.
Regarding the process limitations, we believe that collaboration is yet insufficient in SOCs. Rajivan et al. [50] show that collaboration and information sharing, when done correctly, have a positive effect for the triage and the investigation of complex alerts. For known and simple security events, there is no gain to put a team effort. Sundaramurthy et al. [52] highlights the necessity to empower Tier 1 analysts to reduce the process limitations. Chapter 5 presents our proposition for a better process in SOCs, taking into consideration these insights. We also address the technology problems related to the progression of threats and the rhythm of the networks with visualization by designing a prototype corresponding to this new process.
3
Security visualization inside
security operations centers
Contents
3.1 Situational awareness and purpose of visualization for security . . . . 22 3.1.1 Situational awareness . . . 23 3.1.2 Other classifications . . . 24 3.2 Monitoring . . . 26 3.2.1 Scatterplots . . . 27 3.2.2 Link graphs . . . 27 3.2.3 Treemaps . . . 30 3.2.4 Three-dimensional techniques . . . 31 3.2.5 Interaction . . . 31 3.2.6 A priori processing . . . 32 3.3 Inspecting . . . 32 3.4 Exploring . . . 35 3.5 Forecasting . . . 35 3.6 Communication . . . 37 3.7 Collaboration . . . 37 3.8 Conclusion . . . 38 Analyzing, processing and communicating about an ever-growing amount of data are daily tasks for the analysts working in a SOC. In cybersecurity, data is primarily stored in textual form called logs. Logs come from various sources such as IDSes alerts, servers, clients, applications, Processing such a quantity of text is a difficult task for the human brain. On the other hand, the human visual system is a powerful pattern seeker and processes images and pictures with more ease. Humans acquire more information through vision than through all other senses combined, and visual displays have the highest transmission capacity from the computer to the human [53]. In the context of cybersecurity, analysts show a preference for visualization as it helps them acquire a higher number of accurate insights [54].
The first part of this chapter is dedicated to the purpose of visualization for information systems security. Current visualizations suitable for tasks carried out by SOCs can be separated into different categories (monitoring, inspection, exploration, forecasting, communication and we add collaboration) and stages (perception, comprehension, and perception) according to situational awarenesss. We then review the state of the art of security visualization according to these categories, these stages, the type of analysis performed and the involved analysts in the remainder of this chapter, The scope of this thesis being the security monitoring and the work of analysts in SOCs, other areas of security visualization like malware or binary code visualization [55] are not discussed. The lessons taken from this study of visualization for security are used for our propositions called VEGAS and TheStrip, detailled in Chapter 4 and Chapter 5.
3.1 Situational awareness and purpose of visualization for
se-curity
Visualization is the process to generate visual representations of data. The concept of using visualization to understand data has been around for a long time. Some of the first representations were related to geographic information. One of the earliest known map, found on the walls of the Lascaux caves, dates back to 14 500 BC. Statistical graphics were conceived in the 17th century [56], to show quantity, time-series, scatterplots, and multivariate data. One of the most cited examples of statistical graphics and described as the possible “best statistical graphic ever draw” by Edward R. Tufte is the combination of data map and time-series drawn by Charles Joseph Minard in 1869 in Figure 3.1. It portrays the losses suffered by Napoléon during its Russian campaign. The thick tan flow-line shows the size of the army, its direction (gold when going into Russia, black for the retreat) as well as its location during the campaign, and the visualization links this sets of data to temperature and time for a more in-depth understanding of the event. Minard illustrates the explanatory power of visualization with this effective multivariate graphic.
Computers and technology enable the process of large amounts of data and empower the development of data visualization. They give us new ways to explore, interact with and communicate about large security datasets. The interest in visualization for cybersecurity is increasing with more research paper being published. As Lane Harrison pointed out [57] the need for better visualization tools is now widely recognized and supported.
Visualization relevant to SOCs’ missions can be reviewed from the scope of situational awareness. Situational awarenesss is presented in the next section and other possible classifications are then discussed.
![Figure 2.2: Illustrative diagram of the architecture of a security incident detection service according to the ANSSI [9], version 2.0.](https://thumb-eu.123doks.com/thumbv2/123doknet/14536512.724153/30.892.106.730.151.494/figure-illustrative-diagram-architecture-security-incident-detection-according.webp)


![Figure 3.3: Snapshot of SnortView [67]](https://thumb-eu.123doks.com/thumbv2/123doknet/14536512.724153/47.892.164.787.157.527/figure-snapshot-of-snortview.webp)
![Figure 3.6: Treemap visualization for BANKSAFE [77]](https://thumb-eu.123doks.com/thumbv2/123doknet/14536512.724153/49.892.162.786.151.551/figure-treemap-visualization-for-banksafe.webp)
![Figure 3.7: Overview of DDoS attack by Anonymous in DAEDALUS [79]](https://thumb-eu.123doks.com/thumbv2/123doknet/14536512.724153/50.892.110.738.151.465/figure-overview-ddos-attack-anonymous-daedalus.webp)
