Dynamic Analysis of Concrete Coupled Wall Structures -A Parametric Study
by
Elaine Annabelle Huang
B.S. Civil and Environmental Engineering (2004) University of Massachusetts Amherst
Submitted to the Department of Civil and Environmental Engineering In Partial Fulfillment of the Requirements for the Degree of Master of Engineering in Civil and Environmental Engineering
At the
Massachusetts Institute of Technology June 2005
02005 Massachusetts Institute of Technology All rights reserved
MASSACHUSETTS INSTITUTE
OF TECHNOLOGY
MAY 3 1 2005
LIBRARIES
Signature of Author... .... ...
Department of Civil a Jnvironmental Engineering May 6th 2005
C ertified by ... ... ...
Oral Buyukozturk Professor of Civil and Environmental Engineering Thesis Supervisor
I
A aAccepted by... ... ...
Andrew Whittle Chainnan, Departmental Committee for Graduate Students
Dynamic Analysis of Concrete Coupled Wall Structures
-A Parametric Study
By
Elaine Annabelle Huang
Submitted to the Department of Civil and Environmental Engineering On May 6h, 2005 in partial fulfillment of the
Requirements for the Degree of Master of Engineering in Civil and Environmental Engineering
ABSTRACT
Concrete coupled wall structure is a system that can efficiently dissipate energy under the effect of lateral loads. It has been widely used in medium height buildings for several decades. While researchers have conducted both experimental and analytical investigations in order to improve the performance of concrete shear wall, there is a lack of systematic comparison of coupled wall
behavior due to variation of parameters. Therefore, this report will carry out a parametric study
by varying the height of the building, the degree of coupling (DC), and the shape of the wall
piers.
A computer-simulated study was carried out on the performance of coupled wall structures. The
research process was divided into two phases with the first focusing on only on the shear wall system and the second on the interaction between the building and the core shear wall structure. Static pushover analysis was applied in Phase I, and acceleration response spectrum was
employed in Phase II. The comparison of the results from both phases provided valuable insight on the structural behaviors of shear walls.
The Phase I results showed that C-shaped coupled wall were more efficient than rectangular wall piers. From further investigation in Phase II, it was found that C-shaped wall with 15 degree opening could achieve the greatest stiffness. Same-size coupling beams could create DC in shorter buildings in Phase I, but the result was contradicted in Phase II testing. However, both Phases displayed the fact that shear stiffness played a more important role in affecting DC than flexural stiffness.
Pushover analysis and response spectrum analysis both suggested that the DC of coupled wall structure decreased after concrete cracked and the horizontal force was then withstood by base moment. While concrete shear wall reduced lateral deflection of buildings, Phase II displayed the fact that floor frames could bend and form a sagging shape when interacting with coupled walls in an earthquake. Further study can be focused on more detailed modeling to investigate the behavior of concrete shear walls for efficient and economic design.
Thesis Supervisor: Oral Buyukozturk
TABLE OF CONTENTS Page ABSTRACT ... 2 LIST OF TABLES...4 LIST OF FIGURES... 5 I INTRODUCTION...7 II LITERATURE REVIEW ... 8
III METHODOLOGY AND PROCEDURES...10
3.1 Phase I - Investigation of Coupled Wall Structure Only With Linear and Pushover Analysis...10
3.2 Phase II - Investigation of Entire Structure With Earthquake Response Spectrum...15
IV RESULTS AND DISCUSSION...18
4.1 Phase I Testing...18
4.1.1 Linear-Elastic Analysis... 18
4.1.2 Pushover Analysis...21
4.2 Phase II Testing...25
4.3 Comparison of Phase I and Phase II...30
V SUMMARY/CONCLUSIONS...31
REFERENCES...32 APPENDIX A COMPUTER OUTPUTS AND SUMMARY TABLES FOR PHASE I APPENDIX B SUMMARY TABLES FOR PHASE II
APPENDIX C FIGURES OF PHASE II TESTING APPENDIX D CALCULATIONS
LIST OF TABLES
Table Page
TABLE 1 LOADS APPLIED ON THE BUILDING...11 TABLE 2 HORIZONTAL LOADS APPLIED ON 10-STORY BUILDINGS...12 TABLE 3 HORIZONTAL LOADS APPLIED ON 20-STORY MODELS...14
LIST OF FIGURES
Figure Page
FIGURE 1 COUPLED WALL STRUCTURES...2
FIGURE 2 FLOOR PLAN...10
FIGURE 3 C-SHAPED COUPLED WALL DIMENSIONS...10
FIGURE 4 SIDE VIEW OF SIMPLIFIED COUPLED WALL STRUCTURE...11
FIGURE 5 COUPLING BEAMS WITH RIGID ENDS...13
FIGURE 6 MOMENT-ROTATION RELATIONSHIPS FOR HINGES...15
FIGURE 7 PLAN VIEW OF DIFFERENT WALL PIERS APPLIED...16
FIGURE 8 A 30-STORY, 0-DEGREE C-SHAPED WALL PIER BUILDING...17
FIGURE 9 ACCELERATION SPECTRUM OF SAN FERNANDO EARTHQUAKE AT PACOIMA DAM STATION (DAMPING = 2%)...18
FIGURE 10 FLEXURAL BEHAVIORS OF MODELS FOR LINEAR ANALYSIS...19
FIGURE 11 SHEAR BEHAVIORS OF MODELS FOR LINEAR ANALYSIS...20
FIGURE 12 COMPARISON BETWEEN 10 AND 20-STORY MODELS IN FLEXURAL BEHAVIOR20 FIGURE 13 COMPARISON BETWEEN 10 AND 20-STORY MODLES IN SHEAR BEHAVIOR...21
FIGURE 14 DISPLACEMENT VS. COUPLING STRENGTH FOR 10-STORY MODELS...22
FIGURE 15 DISPLACEMENT VS. BASE SHEAR FOR 10-STORY MODELS...22
FIGURE 16 DISPLACEMENT VS. COUPLING STRENGTH FOR 20-STORY MODELS...23
FIGURE 17 DISPLACEMENT VS. BASE SHEAR FOR 20-STORY MODELS...24
FIGURE 18 DISPLACEMENT VS. BASE MOMENT FOR 10-STORY MODELS...24
FIGURE 19 DISPLACEMENT VS. BASE MOMENT FOR 20-STORY MODELS...24
LIST OF FIGURES (CONTINUED)
Figure Page
Figure 21 Flexural Behaviors of Models of Different Wall Piers...26
Figure 22 Shear Behaviors of Models of Different Wall Piers...26
FIGURE 23 FLEXURAL BEHAVIORS OF MODELS OF DIFFERENT HEIGHTS...27
FIGURE 24 SHEAR BEHAVIORS OF MODELS OF DIFFERENT HEIGHTS...27
FIGURE 25 LATERAL DISPLACEMENTS OF COUPLED STRUCTURES AND PLAIN STEEL STRUCTURES...28
FIGURE 26 VERTICAL DISPLACEMENTS OF COUPLED STRUCTURE AND PLAIN STEEL STRUCTURE...29
I INTRODUCTION
A coupled wall structure is a combined system of frames and shear walls. It was
first seriously studied by Khan (1964) and was a milestone in the development of taller concrete buildings. The system is usually situated at the core of a medium height building and often provides spaces for elevator shafts, stairwells, and storage areas (Figure 1). In the coupled wall system, two or more individual wall piers are coupled together by reinforced concrete beams to form a structure that has large lateral stiffness and strength. By coupling individual flexural walls, the lateral loads, such as wind loads and earthquake motions, are resisted by an axial compression-tension couple across the wall system, rather than by the individual flexural action of the walls (Harris et. Al. 2000). The beams that connect wall piers are called coupled beams. Coupling beams serve the same purpose as the link beams in frame structures. When resisting large lateral loads, coupling beams develop plastic hinges and rotate in similar manner over the height of the building (Aktan and Bertero 1981). As a result, the energy can be dissipated by being distributed over the height of the structure in the coupling beams instead of concentrating it predominantly in the first-story piers (Aktan and Bertero 1984). The design of coupling beam is essential for the coupled wall structure to be effective since the stiffness of the beam to the wall controls the structure's ductility and the hierarchy at yielding. Guidelines and suggestions regarding designing coupled wall system were discussed by Moazzami (1995) and Harries (2001). The Prestandard and Commentary for the Seismic Rehabilitation ofBuilding published by American Society of Civil
Engineers (ASCE 2000) and Building Code Requirements for Structural Concrete and Commentary published by American Concrete Institute (ACI 2002) also contain restrictions that can serve as principles when designing coupled shear walls.
In this research, coupled shear wall structures were modeled and tested by computer simulation, SAP2000. While majority researchers focus only on the core structures, this report is going to present two phases of studying. In the first phase, the conventional method of modeling only the coupled wall system was performed.
Parametric studies were conducted by alternating the height, the degree of coupling (DC), and the shape of the wall piers. Both linear-elastic and non-linear pushover tests were completed. Results from the study demonstrated how the parameters influenced the performance and behavior of coupled walls. The results were compared to current literature to prove the validity of the computer modeling. In the second phase, entire building was modeled with coupled wall located in the center of the building. More elaborate computer testing was completed in the parametric studies. A response
spectrum was input into the computer program to simulate real earthquake situation. The results from the two phases were compared. Based on the simulation results, properties regarding the performance of coupled wall structures were able to be observed and possible future studies related to the topic were suggested as well.
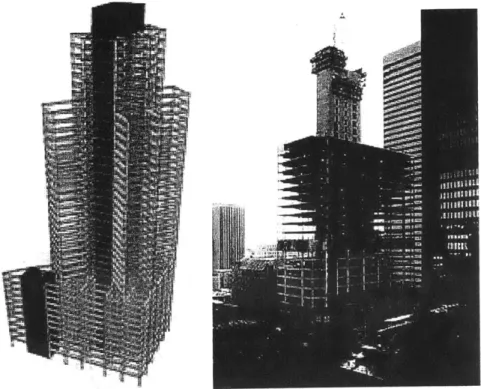
Figure 1 Coupled Wall Structures (www.cs.co.kr/cma/ data/sabo/200001/05.htm)
H LITERATURE REVIEW
Numerous researches have been carried out analytically and experimentally on coupled shear structures. The studies of coupled walls can be divided into two
categories: static analysis and dynamic analysis. Each category has been utilizing two approaches, which are continuum method and finite element method. There are few literatures that examine the coupled wall structure by employing computer software or pushover analysis. However, the literature reviewed built a rich background as the preparation for this study. The suggestions and results from existing literature provide resources as comparisons for the results generated by this research and also serve as potential explanations for the structural behaviors shown by computer simulation.
While the topics of the literature relating to this topic were relatively broad, there are a number of them that offers valuable information and are described in this section.
The concept of degree of coupling (DC) was discussed in detail in the paper published by Harries (2001). DC represents the ratio of the total overturning moment resisted by the
coupling action to the total overturning moment. The mathematical formula that represents DC is as follows:
DC = PL / (D2Mo+PL)
Where P = axial load in walls due to shears in coupling beams L = lever arm between centroids of wall piers
In additional to the traditional definition of DC, the paper also presented empirical formulas of degree of coupling from other researches using different approaches. The report also noted the limitation of degree of coupling and proposed that the DC should not exceed 50% for conventionally reinforced concrete coupling beams and 55% for
diagonally reinforced breams.
Other studies that concerned the degree of coupling can be seen in the report by Munshi and Ghosh (2000). Two coupled wall structures with weak coupling and adequate coupling were inspected under earthquake motion simulated by the program DRAIN-2DX. The analysis indicated that weakly coupled walls tend to develop excessive ductility demand and biased response under some critical ground motions, whereas walls that are adequately coupled produce displacement and ductility consistent with the design. The adequately coupled wall in this report was also cost-effective, for it saved about 25% in concrete and 30% in steel when comparing to the weekly-coupled system. Chaallal et. Al. (1996) developed methods to classify coupled wall system based on the magnitude of axial force or degree of coupling. The report concluded a boundary of 0.33 as the minimum for DC. Buildings were considered inadequately coupled if DC was below the minimum value. For buildings above 30 stories, the DC should be greater than 0.66, which was not difficult to satisfy. Many literature referred that increasing DC would also in term raise the ductility demand. Researchers ought to be cautious to take the fact in to consideration when optimizing the coupled wall design.
Besides the degree of coupling, other research articles were reviewed for the purpose of this study. Kwan and Chan (1999) performed an analysis on the
circumstances when coupling beams were out of plan relative to the wall piers. The report found that the effective stiffness of a coupling was dependent on the angles between the beam and the walls. The beams would exhibit greater stiffness when the angles between the beams and walls were small, and vice versa.
Literatures involving better modeling methods were the most common. Coull and Choudhury (1967) offered curves derived from hand calculation to quickly evaluate important properties of coupled walls. Another calculation method was presented by Tso and Rutenberg (1977) based on the response spectrum technique. Other studies such as the reinforcement in the coupling beam, comparison between concrete coupling beams and steel coupling beams, and the methods to upgrade existing coupled wall system were reviewed for the benefit of this research.
The previously mentioned researches all performed laboratory testing or
analytical analysis on the coupled wall systems. There is yet no study which investigates the entire building structure to observe the interaction between coupled wall and the rest of the elements. In comparison to current research papers relating to coupled wall
structures, this study is innovative and very useful for its contribution in precise empirical observation utilizing computer-modeled analysis. It is hoped that the results of this study will serve as valuable resource for future researchers and as one of the references for analytical studies.
III METHODOLOGY AND PROCEDURES
3.1 Phase I - Investigation of Coupled Wall Structure Only With Linear and Pushover Analysis
To establish a parametric study, nine coupled wall structures were modeled using
the computer software SAP 2000. SAP is an integrated software for structural analysis and design. It has very versatile functions and allows users to not only perform a linear analysis of structures but also numerous options in dynamic analysis in order to
investigate the effect of earthquake motions on structures. The models that were developed in this study were: 10-story with C-shaped wall piers, 10-story with
rectangular-shape wall piers, and 20-story with C-shaped wall piers, each with regular, high, and low degree of coupling. Three dimensions of coupling beams were used to very the degree of coupling and will be explained later in this section. The design of models were inspired by the analysis examples performed by Paul Brienen (2002), a structural engineer in Cary Kopczynski and Company, Inc. In the analysis, Brienen modeled a ten-story coupled wall structure with C-shaped wall piers, which was applied in this study. Besides using the same dimensions for the coupled wall and entire
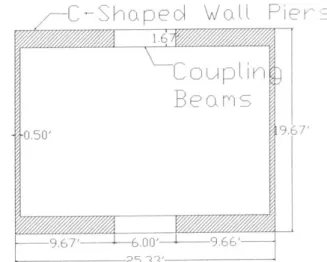
structure, the parametric study was perform by altering the existing shape of the wall piers and the building height in order to satisfy the objective of the research. The detailed plan view of the coupled wall core structure from Brienen's model is shown in Figure 2 and 3. The side view of the building can be seen in Figure 4.
100'
/
/-
Shoped
\/olPier
Building
Coupued
Wiall L~~
9.6F7' 2 600' P 9.6 6'F L __ 25 .3 3'
The total floor area in Brienen's example was 10,000 square feet with 100 feet on each side. The floor height in the example was indicated as 12' 2" for the first floor and
9' 2" for the second floor and up, which was considered too short in this project to
accommodate for human comfort. Therefore, the floor height was increased to 15 feet throughout the building. As shown in Figure 3, the coupled wall system was simplified to a plane frame. Due to the fact that the frame is a side view of the building, the beams represent the two coupling beams and the piers in Figure 3 stand for the centroids of the C-shaped wall, which was conventionally done in numerous researches. The magnitude of the loads from Brienen's report was adopted for this analysis. The loads included in this example were tabulated in Table 1. The loads from cladding, columns and core wall were decided not important for the loading onto the core structure. Therefore, the weight from these facilities was eliminated in this study. The detail of Brienen's analysis is not
included in the project since it is not the focus of the subhect. Further information can be obtained by request to Cary Kopczynski and Company, Inc.
YI z X
Figure 4 Side View of Simplified Coupled Wall Structure
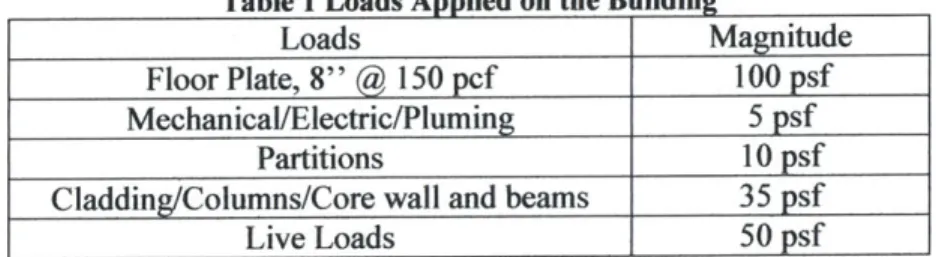
Table 1 Loads Applied on the Building
Loads Magnitude
Floor Plate, 8" @ 150 pcf 100 psf
Mechanical/Electric/Pluming 5 psf
Partitions 10 psf
Cladding/Columns/Core wall and beams 35 psf
All the dead loads were checked with Massachusetts Building Code and were found
reasonable. A live load of 50 psf was added for office use. The load combination used was calculated as follows:
1.2 DL + 0.5 LL + 1.0 E (Massachusetts Building Code, 1997) Where DL = Dead loads
LL = Live loads
E = Earthquake loads
The above formula was adopted because it was the load combination that could generate the largest load on the building when earthquake motion was present. The combined loads were then placed to the coupling beams as distributed loads and to the joints as concentrated loads. The core structure was calculated to afford half of the loads assigned to the building using two-way loading method. The calculation is attached in Appendix B. The horizontal loads which acted as earthquake loads were specified by Brienen as well. Table 2 shows the horizontal loads applied on each floor.
The material properties of concrete were defined by the default of SAP 2000, in which included density, Young's modulus, Poisson's ratio, Coefficient of thermal expansion, shear modulii, and yield stresses of concrete and steel reinforcement. The default values were acceptable and there was no need to re-define the properties. The moment of inertia of the beam was adjusted to be 0.35 of the original value in the bending direction, and the moment of inertia of the wall piers was reduced to 0.7 in the upper stories and 0.35 for the first story. The purpose of using a smaller moment of inertia in the bending direction was to acknowledge the fact of reduced stiffness in structures. The reduced stiffness was due to the cracks generated in earthquakes. All the coefficients for reduction of stiffness were adopted from ACI code (2002). For the coupling beams, it was assumed to be rigid at the two ends as shown in Figure 5 where the wall piers situated.
Table 2 Horizontal Loads A plied on 10-Story Buildings
Floor Horizontal Load (K)
10 318.2 9 279.3 8 241.6 7 205.1 6 170.0 5 136.4 4 104.5 3 74.7 2 47.2 1 23.0
For the models with rectangular wall piers, the dimension of the piers were designed so that it had the same distance from the centroid to the coupling beams as the C-shaped walls. The rectangular pier then had a cross section of 13 feet long by 1.67 feet wide. All the other parameters remained the same.
Coupling Beam
Rigid Ends
Figure 5 Coupling Beams with Rigid Ends
For the 20-story models, the horizontal loads needed to be re-calculated. The International Building Code (2000) was followed when calculating the horizontal earthquake load and the magnitudes of the loads are presented in Table 3. The calculation for the horizontal loads were included in Appendix D.
There were 3 different degree of coupling for each of the three cases: 10-story C-shaped wall piers, 10-story rectangular C-shaped wall piers, and 20-story C-C-shaped wall piers. Since the width of the C-shaped walls that were connected to the coupling beams were 20 inches, the depth of the coupling beams were modeled to be 24 inches to be conventional. It was recognized that increasing the beam depth would in term increase the degree of coupling, for deeper beams increase the stiffness of the walls and in term generate larger axial forces. The higher degree of coupling for the research was defined as altering the depth of the beam to 48 inches. On the other hand, the lower degree of coupling was defined to have a beam depth of 12 inches.
After all the preparation for computer modeling was completed, the nine models were analyzed linearly in SAP 2000. The results were not accurately representing the building's behavior due to the fact that the live loads and dead loads were extremely large on the core structure. In real situation, the core wall structure should not withstand half of the loads that acted on the building. The loads would more likely to be distributed uniformly on the columns placed on each floor, which reduced the forces that the coupled wall system had to afford. It was also found that the important properties that this
base shear did not alter a great deal when the gravity forces were absent. Therefore, it was decided that the gravity loads could be eliminated in order to observe the behavior of
coupled wall system under merely earthquake loads.
Table 3 Horizontal Loads Applied on 20-Story Models
Floor Horizontal Load (K)
20 270.55 19 257.03 18 243.50 17 229.97 16 216.44 15 202.92 14 189.39 13 175.86 12 162.33 11 148.80 10 135.28 9 121.75 8 108.22 7 94.69 6 81.17 5 67.64 4 54.11 3 40.58 2 27.06 1 13.53
After the linear analysis was completed, reinforcement was designed for the coupling beams in each model. Conventional reinforcement was used for this research. Reinforcement was designed according to the largest moment in the beams in each model and all the coupling beams were assigned the same steel reinforcement. Detailed
calculations were included in Appendix D. For some cases, the widths of the coupling beams were widened to accommodate the large moment. Reinforcement could not be designed for all the low degree of coupling cases because the beams would be too wide to be practical. The purpose of designing the reinforcement was to define the beam
capacities and thus characterize the pushover behavior of the hinges. A typical pushover curve for the hinges is shown in Figure 6, which shows the key parameters that were used to outline the shape of the curve. The curve remained a linear-elastic relationship until the beams yielded. The moment capacity of the beams reduced slightly until the beams reached the ultimate rotation angle. The capacity of the beams then dropped to 20% of the yielding moment and remained at the same level until the beams disengaged with the wall piers.
M
20% My
Rotation Angle Figure 6 Moment-Rotation Relationships For Hinges
Hinges were assigned to the two ends of the coupling beams. The length of the hinges was assumed to be the same as the height of the beam. The hinges would form when the moment on the beams were greater than the yielding capacity. Once certain beams in the system failed, that was, beyond the ultimate point, the moment would be re-distributed to other beams on upper stories until the moment could not be re-re-distributed. In this approach, the capacity of the core wall structure could be observed although not all the hinges would form. SAP 2000 also classified the stages of hinges by different colors. With the aid of the computer simulation, the linear and non-linear analyses were
successful performed. The results of the analyses are presented in section IV.
3.2 Phase 1 - Investigation of Entire Structure With Earthquake Response Spectrum
In Phase II of the project, building structures with shear wall at core were modeled by SAP2000. The objective of this phase was very similar to Phase I, and the parameters focused were identical. There were 50 computer models that were made for Phase II. The computer testing was more thorough and extensive in this part because of the lack of previous literature for guidance and reference. To vary the floor height of the building, models of 10 stories to 50 stories were created with a 10-story increment. For the parameter of wall pier shape, phase II placed an emphasis on C-shaped pier with openings of different degrees, since the testing results from Phase I had shown that C-shaped wall was more efficient than rectangular wall. The opening of the side wall piers were 00, 15 0, 30 0, 450, and 600 with respect to a horizontal line. The geometry of the
wall piers was carefully modeled so that the distance between the left centroid to the right centroid were identical in each case. Figure 7 shows the plan view of different wall piers. The heights of the buildings were fixed at 30 stories while the shape of the piers varied. Each previously mentioned structure was tested with five different degrees of couplings.
The width of the coupling beams remained the same as Phase I while the depth of the beams ranged from 12 inches to 36 inches with a 6-inch increment. It was hoped that
the detailed setting would result in accurate prediction of coupled wall interaction between the core and the rest of the structure.
0 Degree 15 Degrees
30 Degrees
~-~~~~~~>
45 Degrees
behavior and the
60 Degrees
Figure 7 Plan View of Different Wall Piers Applied
An example of SAP2000 model in Phase II is displayed in Figure 8. It features a 30-story and 0-degree C-shaped wall pier building. The building was assumed to have a composite design, with steel frames and concrete floor slabs (not shown in the picture). The loads and load combinations used remained the same as the ones used in Phase I.
Steel frame members were designed the designated load with a safety factor of at least 2. For simplicity, both the steel beams and columns were wide flange members W14x68.
Steel reinforcements in the coupling beams were designed to withstand the moment and shear under the effect of gravity loads. The dimension of the building was modified to have 175 feet on each side with coupled wall structure of 25 feet by 25 feet at the core. The representation of earthquake loads was completed by inputting a response spectrum rather than calculating the corresponding pushover forces. It was anticipated that the dynamic analysis using acceleration response spectrum would simulate a more realistic
earthquake situation than static pushover method.
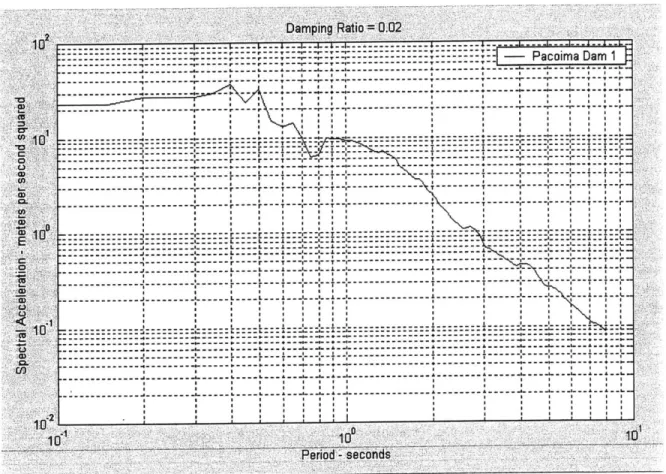
To select an appropriate earthquake, the data of a number of earthquakes were reviewed. Earthquake information was provided by Spectra Version 2001, a software developed by J.J. Connor, a structural engineering professor in MIT. In the program, response spectra and time histories could be generated by selecting the desired
earthquake and specifying the damping coefficient of the structure. For this project, the buildings were not equipped with any form of dampers. However, the natural damping ratio of a building was approximately 2%, which was what it was assumed when obtaining the response spectrum. After observing the characteristics of earthquakes in Spectra, an earthquake occurred in San Fernando, CA in Feb. 9, 1971 was selected. It was a very strong earthquake with maximum acceleration of 10.55 m/sec2 (34.82 ft/sec2), more than ground acceleration. The response spectrum generated is presented in Figure
9. The lateral earthquake force acted on the base of the building in the x-axis direction.
DampingRatio 002 --- -.-.-.... . Pacoima Dam 1 g g ~ ~ i ~ I --- - --- - ---- r I T T --- ---D -- - - -.- - -- - - - -- .,J - - - -- --- - - - --- - --- - -. - - - - -.,-.- - . -.- .,- - .- -.- - -- .. 10 i i i 100 0 i i ---r --- - r ---T I _ _ --- -10 _ _ _ _ _ _ -___ -__ ---- -- T 101
Figure 9 Acceleration Spectrum of San Fernando Earthquake at Pacojina Dam Station (Damping= 2%)
Besides the previously mentioned aspects, all other assumptions remained the
same as Phase I. The following section displays the results and discusses the comparison of the outcome from computer outputs.
IV RESULTS AND DISCUSSION 4.1 Phase I Testing
4.1.1 Linear Analysis
Coupled Wall Structure with Different Shapes of Wall Piers
The linear-elastic analysis was carried out by using SAP 2000. The software provided outputs such as displacement, joint reactions, axial force, shear, and moments of
every member. Appendix A shows the data and summary tables. From the results obtained, plots can be generated to further examine the linear performance of coupled walls. Figure 10 illustrates the comparison between C-shaped wall piers and
rectangular-shaped walls in flexural behavior. The Y-axis offers a scale to measure the strength provided by coupling beams, and the X-axis represents the size of the coupling beams.
While having the same coupling beams, the beams supplied the greatest percentage of strength for 10-story, rectangular wall models and the least in 10-story, C-shaped wall models. This fact explains that the 10-story, C-shaped wall piers could afford the most
overturning moment than other models. It could also be observed that the wall stiffness in flexure decreased when the height of the building increased. The wall stiffness can be compared quantitatively as well. For example, the EI for the 10-story, rectangular wall building was 0.1E8 in4 when the coupling was 82%, whereas the EI of the 10-story, C-wall model was 4.8E8 in4 for the same percentage of coupling. Therefore, the C-wall piers were about 48 times more stiffness than rectangular walls. By applying the same
approach, the stiffness of the piers for the 10-story, C-wall building was approximately 7 times greater than the 20-story, C-wall model.
0
Comparison Between C-Wall and Rec-Wall in Flexural Behavior 1.0000 0.9000 -0.8000 -0.7000 -- 10 Story C-Wall 0.6000 -0-- 10 Story Rec-Wall 0.5000 20 Story C-wall 0.4000 0.3000 0.2000 0.1000 0.0000
0.OOE+0 1.OOE+0 2.OOE+0 3.OOE+0 4.OOE+0 5.OOE+0 6.OOE+0 7.OOE+0
0 8 8 8 8 8 8 8
El of the Coupling Beams (K-inA2)
Figure 10 also shows that the degree of coupling stopped increasing for the rectangular wall pier models after 90% of coupling. The degree of coupling grew slowly for the C-shaped wall models for bigger coupling beam sized and seemed to reach an asymptote. It was uncertain when the degree of coupling would end growing for each of the model since there were limited data points. However, it was clear that the degree of coupling would arrive at a certain point where the degree of coupling started growing in a slower rate. Another point that could be drawn from the graph was that while increasing the beam size, the degree of coupling increased the most significantly in 10-story, C-wall models, which shows that the models were most sensitive when responding to the
variation of beam sizes.
A similar comparison was made between C-shaped walls and rectangular wall in
shear behavior and was shown in Figure 11. The examination of shear behavior is relevant for short beam members such as those appeared in coupled wall structures. The graph exhibits the same hierarchy of wall stiffness in shear as in flexure. The wall stiffness of the story, C-shaped wall was approximately 3.3 times larger than the 10-story, rectangular shaped wall models and 1.7 times greater than the 20-10-story, C-wall models. While most of the aspects of shear behavior and flexural behavior were alike, it was interesting to compare the magnitude of the shear area increased to the moment of inertia increased while the degree of coupling in the two graphs were identical. From Figure 10, the moment of inertia of the beams was amplified to 8 times larger from the small beam to medium beam while the shear area was only enlarged to twice as much from Figure 11. Due to the fact that the degree of coupling was increased by the same amount, it clearly showed that the degree of coupling corresponded to the shear area more strongly than to the moment of inertia.
Comparison Between C-Wall and Rec-Wall in Shear Behavior 1.0000 0.9000-0.8000 0.7000 0.6000 0 -+-- 10 Story C-Wall L0.4000 --- 10 Story Rec-Wall 0.3000 20 Story C-Wall 0.2000 0.1000-0.0000
0.OOE+0 2.OOE+0 4.OOE+0 6.OOE+0 8.OOE+0 1.OOE+0 1.20E+0 1.40E+0
0 5 5 5 5 6 6 6
GA of the Coupling Beams (K)
Coupled Wall Structures with Different Heights
Similar plots were generated to compare the difference between 10 and 20-story buildings in flexure and shear behavior. The X-axis in these plots were normalized by dividing the El of the beams by El of the wall piers to present a fair evaluation since in most real life cases, the size of the walls vary when changing the size of the coupling beams. However, a parametric study was performed in this research and the size of the coupling beams and the wall piers were the same for both 10-story, C-shaped wall models and 20-story, C-shaped coupled walls. The normalized plots essentially provided similar observations as the previous plots. Figure 12 shows the comparison between the two heights of buildings in flexural behavior, and Figure 13 presents the shear behavior.
Comparison between 10 and 20 stories In Flexural Behavior
1.0000 0 9000 08000 0.8000 -- 10-story, C-wall 0. 4000 0.3000 0.2000 0.1000 0.0000
0.00E+00 5.OOE-03 1.00E-02 1.50E-02 2.00E-02 2.50E-02 ElbeanlEiwa]
Figure 12 Comparison between 10 and 20-story Models in Flexural Behavior
Comparison between 10 and 20 stories in Shear Behavior
1.0000 0.9000 0.7000-0.80007 0.5000 ---- story, C-wall =-.-20-story, C-wall 0.4000 0.3000 0.2000 0.1000 00000 , 0.00 0.02 0.04 0.06 0.06 0.10 0.12 0.14 0.16 0.18 0.20 GAbeamGAwaI
4.1.2 Pushover Analysis 10-Story Models
The summary table of the pushover analysis was enclosed in Appendix A. The table shows axial force, base shear, base moments, displacements at the top story for each step of the pushover procedures. Plots were generated to examine the pushover behavior of models. Figure 14 displays the relationship between the moment strength provided by coupling beams versus the displacement of the 10-story buildings, and Figure 15 presents the relationship between the base shear versus the displacement of the 10-story models. Both plots show similar trends. The curves exhibit a linear-plastic behavior for all the
10-story models but the high DC, C-shaped coupled system. The reason that the C-wall, high DC model never yielded was that the moment in the coupling beams were averagely large throughout the floors so that the moment from the hinged beams could not be re-distributed to other beams. The software then stopped analyzing once the moment could not be re-distributed. From Figure 14 and 15, the high degree of coupling models deflected less than the regular degree of coupling models. The rectangular wall models yielded at approximately the same moment or shear, whereas the high degree of coupling model of C-shaped wall yields at a much higher magnitude of both moment and shear.
Displacement vs Coupling Strength for 10-Story Models 200000
180000
-160000
140000-120000 _ -+- 10-story, C-w all Regular
DC
S100000-1u-+10-story, C-w all High DC
I. 80000
60000 10-story, Rec-w all
40000Regular DC
4000 x- 1 O-story, Rec-w all High
20000 DC
0
0 2 4 6 8 10
Dis placem ent (in)
Figure 14 Displacement vs. Coupling Strength for 10-story Models
By comparing the C-shaped wall models and the rectangular shaped models, the
C-shaped buildings deformed less quantitatively than rectangular-shaped structures. As expected, the moment provided by coupling (PL) started to level off once the beams started to yield and form hinges. The base shear then in term stabilized and behaved as free, individual cantilevers. At this stage, the wall piers would require much less base shear for the same amount of displacements.
Displacement vs Base Shear for 10-Story Models
Figure 15 Displacement vs. Base Shear for 10-story Models
20-Story Models
Figure 16 and 17 show the same parameters for 20-story models. The slopes of the curves were almost identical to each other. The yielding step for each model was marked as a red dot on the graphs. These figures illustrated that the 20-story models also presented linear-elastic behavior. The curves were leveled off very slightly after yielding and it was more difficult to observe the behaviors after yielding. The deformation for 20-story models were approximately 5 times more than the 10-story models when measured
empirically. The higher DC model also showed slightly less deflection than the regular
DC model.
Displacement we Coupling Strength for 20-Story Modeft
700000 600000 400000 300000 200000 100000 0 e -m-20-story, C -- 20-story, C 0 10 20 30 40 50 60 70 -wall RegUar -wall High DC Displacement (in)
Figure 16 Displacement vs. Coupling Strength for 20-story Models
2500
2000-1500
--+ 10-story, C-wall
i Regular DC
-U-1-story, C-wall High
1o DC 10-story, Rec-wall Regular DC 500- -10-story, Rec-wall High DC 0 1 2 3 4 5 6 7 8 9 10 Displacement (in)
Displacement vs Base Shear for 20-Story Models 4000
3500 3000
2500 - 20-story, C-wall Regular
DC
2000 - 20-story, C-wall High DC
1500
1000
500
0 10 20 30 40 50 60 70
Displacement (in)
Figure 17 Displacement vs. Base Shear for 20-story Models
Displacement vs. Base Turning Moment
The relationship between the base overturning moment and the displacement was shown in Figure 18 for 1 0-story models and Figure 19 for 20-story models. It was obvious that C-shaped walls piers could withstand a much larger overturning moment than rectangular piers. By calculating the ratio of moments of C-wall and rectangular wall at the same displacement, the C-shaped wall has approximately 2.3 times more base moments than rectangular walls. The curves from Figure 18 and 19 showed that the base moments increased exponentially after yielding for some of the models. It was due to the disassociation of the coupling beams and the wall piers that the earthquake loads were mostly transformed to overturning moment. The rectangular wall models did not exhibit this behavior because there was not enough hinges forming to allow the walls move as free cantilevers. The 10-story, C-wall high DC model once again failed to re-distribute the coupling beam moments and never yielded in the process.
Finally, Figure 20 shows the strength provided by coupling beams during pushover analysis. The graph shows the same hierarchy in terms of the wall stiffness. The coupling remained constant and the dropped significantly after yielding, which was
Displacement vs Base Moment for 10-Story Models Ce E 0 a C m 45000- 40000- 35000- 30000-25000 - 20000-15000. 10000-5000 01 0 1 2 3 4 5 6 Displacement (in) + 10-story, C-wall
-3-10-story, C-wall High DC
10-story, Rec-wall
7 -E- 10-story, Rec-wall High
DC
Figure 18 Displacement vs. Base Moment for 10-story Models
Displacement vs Base Moment for 20-Story Models
90000 - 80000-70000 60000 50000-I 40000 20-story, C-w all
30000 -- 20-story, C-w all High DC
20000
-0 10 20 30 40 50 60 70
Displacement (In)
Figure 19 Displacement vs. Base Moment for 20-story Models
Norm
Strength from Coupling Beams during Pushover Analysis 0.94 0.92 - 0.90-0.88 o 0.86-a M -10-Story, C, Reg. DC 0- 0.84 - 10-Story, C, High DC
--2-- 10-Story, Rec, Reg. DC
S.82* --- 10 Story, Rec, High DC
0.80 -@-- 20-Story, C, Reg. DC --- 20-Story, C, High DC 0.78 0.76 0.00 0.20 0.40 0.60 0.80 1.00 1.20 1.40 Vi/Vb
Figure 20 Degree of Coupling during Pushover Analysis
4.2 Phase 11 Testing
Phase II contains dynamic analysis by applying acceleration response spectrum of San Fernando earthquake. The details of element output for the building were very lengthy and were not the focus of this study. Therefore, the computer output for Phase II was not included. However, the summary table of results was enclosed in Appendix B for reference.
Coupled Wall Structures with Different Shapes of Wall Piers
Figure 21 displays the flexural behavior of the coupled wall structure when the shape of wall piers varied. All the curves in Figure 21 had the general outline. The degree of coupling (PL/Mo) initially increased with increasing beam depth until it reached the peak value. After the maximum DC that it achieved, degree of couplings dropped and eventually leveled off. The most ideal beam depth for this special case was
18 inches with the beam width of 24 inches. The degrees of coupling that these models
achieved were in a narrow range, from 0.90 to 0.98. The most efficient angle opening of shear wall, according to empirical observation, was 15 degree with respect to horizontal. Figure 18 presents the shear behavior of concrete coupled walls with varying wall piers. The increase in shear area resulted in the change of degree of coupling in the pattern similar to what it shows in Figure 21. It was interesting to compare the magnitude of the shear area increased to the moment of inertia increased while the degree of coupling in the two graphs were identical. From Figure 21, the moment of inertia of the beams was
amplified to 3.35 times from 12-inch in depth to 18-inch in depth while the shear area only enlarged 1.5 times in magnitude. Due to the fact that the degree of coupling was increased by the same amount, it clearly showed that shear stiffness has a greater control over the behavior of degree of coupling.
Flexural Behavior of Models of Different Wall Piers
0 0.99 0.98 0.97 0.96 0.95 0.94 0.91 0.9 0.89 0.96 4-0 egre 0.41--5Dge -U-I0 Degree -h-15 Degree -A- 30 Degree --* 45 Degree * 60 Degree 0.01 0.015 Elbeam/Eilwall
Figure 21 Flexural Behaviors of Models of Different Wall Piers
Figure 22 Shear Behaviors of Models of Different Wall Piers 0.02
Shear Behavior of Models of Different Wall Piers
0.99 0.98 0.97 0.96 -+--0 Degree -0-15 Degree 0.95 -- r- 30 Degree S0.94 -- 45 Degree I0.93 -*- 60 Degree 0.92 0.91 0.9 0.89 0.02 0.03 0.04 0.05 0.06 0.07 0.08 0.09 GAbeam/GAwall 0 0.005 0.025
Coupled Wall Structures with Different Heights
Similar plots were generated to observe how building height impacted on the building's flexural and shear behavior. The normalized plots showed that in general it was more difficult for taller buildings to achieve higher degree of coupling. Although the range of degree of coupling was very narrow in this situation, the DC increased in shorter buildings when the depth of coupling beams increased. On the other hand, the degree of coupling dropped with increasing depth in coupling beam for the case of 50 stories. The ideal beam depth for these building models was again 18 inches with the width of the beams being 12 inches. Comparing Figure 23 with Figure 24, the shear stiffness effectively controlled the degree of coupling than the flexural stiffness.
Flexural Behaviors of Models of Different Heights
0.005 0.01 0. -+- 10 Story -- 20 Story ,s- 30 Story -x 40 Story *-50 Story )15 ElbeamIElwall
Figure 23 Flexural Behaviors of Models of Different Heights
Shear Behaviors of Models of Different Heights 0.975 0.97 0.965 --- 10 Story 0.96 - 20 Story 0.955-___ 0.95 A 30 Story --- 40 Story S094 _-50 Story 0.04 0.06 0.08 GAbeam/GAwall 0 a. 0.975 0.97 0.965 0.96 0.955 0.95 0.945 0.94 0.935 0.93 0 0 a. 0.935 0.93 0.02
Figure 24 Shear Behaviors of Models of Different Heights
I A411 : ii l
-Displacement vs. Degree of Coupling for Buildings of Different Heights
Graphs of maximum lateral displacement versus PL/Mo were generated for different building heights. The figures are attached in Appendix C. The results regarding the relationship of these two variables were not conclusive from the outputs. For 10- and 30-story buildings, the degree of coupling increased with displacement to a peak value and dropped thereafter. For 20- and 40-story buildings, the displacement and the degree of coupling displayed linear relationship. The degree of coupling of these two models finally dropped at a very high displacement. For the 50-story model, the degree of coupling decreased with displacement to a minimum value and concaved back up. The graphs did not provide a clear trend from which scientific observations can be based upon.
Displacements vs. Degree of Coupling for Buildings with Different Shapes of Wall Piers
The graphs created were attached in Appendix C. The figures show that the degree of coupling decreased when maximum lateral displacements increased. It can be explained that when displacements were large, cracks started to be created in concrete beams to cause the drop of degree of coupling. Among the different shapes of wall piers, wall opening of 30 and 45 degrees seemed to be the most effective since the degree of coupling decreased in the slowest fashion in these two models.
Horizontal Displacements at the Top of Buildings with Shear wall and Plain Steel Frame Buildings
A comparison (Figure 25) of buildings with coupled wall structure at the core and
buildings with only steel frame was completed. The coupled wall structures used were
10, 20, 30, 40, 50-story model with 0 degree C-shaped wall. Plain steel frame models of
corresponding heights were created for the comparison. The buildings with shear walls demonstrated a steady trend that the lateral displacements increased with increasing height. Although the plain models did not display this feature, the overall lateral displacements were much larger than buildings with concrete coupled walls by the magnitude of 60 in average.
Lateral Displacements of Coupled Structure and Plain Structure p1.4 1.2 0.8 - coupled 0.6 -- plain O 0.4 0. 02 0 0 20 40 60 Stories
Vertical Bending of Steel Floor Frames in Buildings with Shear Wall
Despite of the advantages that concrete coupled wall significantly reduced the lateral deflection of buildings, the stiffness of the concrete wall had a negative effect on the surrounding elements. The impact caused floors to bend to some extend, with the
floors around the core structure suffering the most intensely. Figure 26 presents the vertical deflection of the top floor for models with the shear wall and models with plain
steel frames. From the graph, it was clear that the vertical displacement of buildings with concrete coupled wall deflected much more severely than plain steel frame structure, with an average magnitude of 5.4. The phenomenon can be illustrated by Figure 27, which displays a 3-dimensional view of the building and a cross-sectional view of the building. This issue has brought to the attention of the consideration of different connections that can be used in a building. In the modeling process, all the connections in the buildings were assumed to be rigid. Therefore, the situation of vertical deflection could be improved by using different connections which allowed more flexibility in movements.
Vertical Displacements of Coupled Structure and Plain Structure 3.5 3 2.5 0 2 V -- coupled CL 1.0e plain X 0.5 1 0 0 10 20 30 40 50 60 Stories
I J_
Figure 27 Bending of Floors
4.3 Comparison of Phase I and Phase 11
The flexural and shear behaviors of the coupled wall were similar in both phases. However, the degree of coupling instead of leveling off at the end in Phase I, it reached a peak and dropped from that value. In Phase I, shorter buildings had more difficulty achieving higher degree of coupling due to the fact that coupling beams in higher
buildings usually withstand much larger moment. In a more realistic setting generated in Phase II, shorter building accomplished higher degree of coupling, which coincided with other literature. The range of degree of coupling in Phase II was narrower and the values were higher, which represented that coupled walls worked very effectively in buildings when situated at the core.
In pushover analysis, the beam coupling strength increased with increasing displacement until it yields. In the response spectrum analysis, the concrete coupled wall was cracked during the test and therefore the degree of coupling dropped with increasing displacements. From this fact, it could be deducted that the base shear would decrease with increasing deflection in Phase II and the base moment at the piers would
significantly increase as a result.
-It was an interesting fact to note that the concrete coupled wall did not provide advantage for vertical deflection but worsen the effect of earthquake on floor
deformation. Different connection methods should be employed to observe the optimum results at this respect.
V SUMMARY/CONCLUSIONS
This research formed a two-phase parametric study relating to the coupled wall structures. The parameters that this study emphasized were: the shaped of wall piers, the heights of structure, and the degree of coupling. In Phase I, the shapes of the wall piers applied were C-shaped walls and rectangular shaped walls. Story heights of 10 and 20
floors were studied. Computer models were built using the software SAP 2000 to simulate linear and non-linear behavior of coupled shear walls. In linear analysis, it was found that C-wall models had the greater stiffness in both flexure and shear than
rectangular models and the stiffness decreased with the increase of the height of building. The degree of coupling for linear analysis leveled off ultimately and could not grow effectively when increasing the beam size. While comparing flexure and shear stiffness,
it was recognized that shear stiffness corresponded to the shear area more closely than the flexural stiffness to the moment of inertia.
For the pushover analysis, the models were loaded horizontally to the extent that the moment of the beams could not be re-distributed. Hinges were formed at the end of
coupling beams and the wall piers acted similar to vertical cantilevers. The strength provided by coupling and base shear increased very slowly after the coupling beams yielded. On the other hand, the overturning moment increased significantly during this period since the wall piers withstood the horizontal loads without the aid of coupling beams. The degree of coupling of the beams remained constant and dropped
considerably after the yielding of the beams.
In Phase II, dynamic analyses of buildings with core shear wall structures were carried out. The flexural and the shear behaviors of coupled wall were similar to Phase I. It was found that piers with 45-degree opening could achieve the highest degree of coupling,
and piers with 15-degree opening contained the most stiffness. Contrary to Phase I, taller buildings had more difficulty to acquire higher degree of coupling.
Due to the fact of the strong magnitude of San Fernando earthquake, the concrete core wall started to crack and dropped its coupling strength while displacements increased. The stiffness of the shear wall was much more significant than the steel frames of the building, which caused the floor frames to bend when in contact with the coupled wall.
The results from this study agreed with other researches regarding this subject and thus proved to be valid. Further investigation can be achieved by modeling more structures
in order to obtain plots with more data. With detailed data, the performance of coupled wall system can be thoroughly observed and optimum design can be made based on the modeled results.
REFERENCES
American Concrete Institute (ACI). Building Code Requirements for Structural Concrete and Commentary. Farmington Hills, Michigan. 2002.
American Society of Civil Engineers (ASCE). Prestandard and Commentaryfor the Seismic Rehabilitation ofBuildings. Federal Emergency Management Agency. November 2000.
Atkan, A. E. and Bertero, V. V., "The seismic resistant design of R/C coupled structural walls." Report No. UCB/EERC-81/07, Earthquake Engineering Research Center, University of California, Berkeley. 1981.
Atkan, A. E. and Bertero, V. V., "Seismic Response of R/C Frame-Wall Structures." ASCE Journal of the Structural Division, 110 (ST8), pp.1803-1821.
Brienen, Paul. 10-Story Coupled Core Wall Example. Cary Kopczynski and Company. Washington. 2002.
Chaallal, 0., D. Gauthier, and P. Malenfant, "Classification Methodology for Coupled Shear Walls." Journal of Structural Engineering. December 1996. pp.14 5 3-14 5 8.
Coull, Alexander and J. R. Choudhury. "Analysis of Coupled Shear Walls." A CIJournal.
September 1967.
C.S. Structural Engineers. www.cs.co.kr/cma/ data/sabo/200001/05.htm. 2001.
Harries, Kent, Bingnian Gong, and Bahram Shahrooz, "Behavior and Design of
Reinforced Concrete, Steal, and Steel-Concrete Coupling Beams." Earthquake Spectra, Volume 16, No. 4, Nov. 2000.
Harris, Kent. "Ductility and Deformability of Coupling Beams in Reinforced Concrete Coupled Walls." Earthquake Spectra, Vol. 17, No. 3, August 2001.
Khan, F. R. and Sbarounis, J. A., "Interaction of Shear Walls and Grames in Concrete Structures under Lateral Loads," Journal ofthe American Society of Civil Engineers, 90
(ST3), June 1964.
Kwan, A. K. H. and W. T. Chan, "Effective Stiffness of Coupling Beams Connected to Walls in Out-of-Plan Directions." Computers and Structures 75, 2000, pp. 385-394. Massachusetts State Building Code, Sixth Edition. Commonwealth of Massachusetts.
1997.
Moazzami, Sara. "Design of Coupled Wall Structural Systems." The Structural Design of Tall Buildings, Vol. 4, 215-227. 1995.
Munshi, Javeed A. and S. K. Ghosh, "Displacement-Based Seismic Design for Coupled Wall Systems." Earthquake Spectra, Vol. 16, No. 3, August 2000.
Tso, Wai K. and Avigdor Rutenberg, "Seismic Spectral Response Analysis of Coupled Shear Walls." Journal ofthe Structural Division. STI. January 1977. pp. 181-196.
APPENDIX A COMPUTER OUTPUTS AND SUMMARY TABLES FOR
PHASE I
10 Story, C-Wall High DC 6818 19 11196 11200 151938 0.8526 663552000 3.06E+10 2.17E-02 1200000 6979200 0.17
10 Story, C-Wall Reg. DC 6172 19 18245 18217 153730 0.7628 82944000 3.06E+10 2.71E-03 600000 6979200 0.09
10 Story, C-Wall Low DC 4090 19 38504 38432 154646 0.5025 10368000 3.06E+10 3.39E-04 300000 6979200 0.04
10 Story, Rec-Wall High DC 7245 19 6535 6554 150744 0.9132 663552000 4.56E+10 1.46E-02 1200000 7800000 0.15
10 Story, Rec-Wall Reg DC 7123 19 6784 6819 148940 0.9087 82944000 4.56E+10 1.82E-03 600000 7800000 0.08
10 Story, Rec-Wall Low DC 6617 19 13867 13863 153453 0.8193 10368000 4.56E+10 2.27E-04 300000 7800000 0.04
20 Story, C-Wall High DC 25959 19 25640 25653 544514 0.9058 663552000 3.06E+10 2.17E-02 1200000 6979200 0.17
20 Story, C-Wall High DC 24656 19 39838 39828 548130 0.8547 82944000 3.06E+10 2.71E-03 600000 6979200 0.09
20 Story, C-Wall High DC 20082 19 84203 84164 549925 0.6938 10368000 3.06E+10 3.39E-04 300000 6979200 0.04
1u Steps P (K) L (ft) M1 (K-ft) M2 (K-ft) Mo (K-ft) 0 0 19 0 0 0 1 848 19 1882 1883 19877 2 1696 19 3764 3766 39754 3 2544 19 5646 5649 59631 4 3393 19 7528 7531 79526 5 4241 19 9410 9414 99403 6 5089 19 11292 11297 119280 7 5937 19 13174 13180 139157 8 6736 19 14946 14953 157883 9 6997 19 15808 15815 164566 10 7220 19 19555 19562 176297 11 7226 19 20076 20084 177454
Vb (K) VI (K) MYiIl Displacement (In) PL (K-ft) 2VI (K) M1+M2 (K-ft)
797 0 MMW0000 0 0 0 0 797 104 010 0.6863 16112 208 3765 797 209 ?0 2 62 1.3725 32224 418 7530 797 313 03927 2.0588 48336 626 11295 797 418 ozk245 2.745 64467 836 15059 797 522 10.6550 3.4313 80579 1044 18824 797 627 <j 0.7867 4.1175 96691 1254 22589 797 731 0L9472% 4.8038 112803 1462 26354 797 830 1 0414 5.4501 127984 1660 29899 797 865 1i0853 5.7552 132943 1730 31623 797 926 JEA 9 6.788 137180 1852 39117 797 932 11694 6.9566 137294 1864 40160
10 Story, C-Wall High DC
Steps P (K) L (ft) M1 (K-ft) M2 (K-ft) Mo (K-ft) P M_ Vb (K_ VI (K) _--VI Displacement (in PL (K-ft) 2VI (K) MI+M2 (K-ft)
0 0 19 0 0 0 0; 798 0 @00.00 0 0 0 0 1 1364 19 2239 2240 30395 26 2 798 160 02005$ 0.8404 25916 320 4479 2 2729 19 4480 4482 60813 -822 798 319 M0 1.6816 51851 638 8962 3 4095 19 6722 6725 91252 QS269 798 479 0-6Q3 2.5237 77805 958 13447 4 5463 19 8965 8969 121731 M0M8527M2 798 639 0800 3.3666 103797 1278 17934 5 6833 19 11211 11215 152253 08527 798 798 10000 4.2104 129827 1596 22426 6 8204 19 13458 13462 182796 8527 798 958 120 5.055 155876 1916 26920
Elb/Elw I GAb (K) GAW (K) IGAb/GAW
10 Story, Rectangular Wall Reg ular DC
Steps P (K) L (ft) M1 (K-ft) M2 (K-ft) Mo (K-ft) Mi Vb K) Vi (K) VINIJ. Displacement (in) PL (K-f) 2Vl (K) MI+M2 (K-ft)
0 0 19 0 0 0 O.0O02 796 0 0.0000 0 0 0 0 1 1120 19 1067 1072 23419 Aqq87._- 796 125 -0.1570 0.9789 21280 250 2139 2 2240 19 2133 2144 46837 0;9087 - 796 250 .3141, 1.9578 42560 500 4277 3 3359 19 3200 3216 70237 0.9057_ 796 376 0.4724-. 2.9367 63821 752 6416 4 4479 19 4266 4288 93655 _,4,9 8 796 501 06294 3.9156 85101 1002 8554 5 5599 19 5333 5360 117074 U907,z- 796 626 964 4.8946 106381 1252 10693 6 6719 19 6399 6432 140492 MG987 796 751 094,35 5.8735 127661 1502 12831 7 7838 19 7466 7504 163892 Q7_EQ87- 796 876 11008 6.8524 148922 1752 14970 8 8958 19 8532 8576 187310 -:Q@g@087 796 1001 <1 7 7.8313 170202 2002 17108 9 9351 19 8906 8952 195527 )MQ9047 796 1045 §1-31-2.81 8.175 177669 2090 17858 10 9331 19 9368 9414 196071 0:M20$42 796 1048 ,I6 8.5068 177289 2096 18782 11 9296 19 9695 9741 196060 O.9Q09 796 1048 71.3i665t 8.8579 176624 2096 19436
10 Story, Rectangular Wall High DC
Steps P (K) L (ft) Ml (K-f) M2 (K-ft) Mo (K-ft) jPL/Mo Vb (K) VI (K) VIb Displacement (in) PL (K-ft) 2VI (K) M1+M2 (K-ft)
0 0 19 0 0 0 j00Q' 798 0 -','0.00Q00 0 0 0 0 1 3623 19 3267 3277 75381 0.9.1,32' 798 399 Q5O0QQ' 2.7826 68837 798 6544 2 7245 19 6535 6554 150744 40.9I3r, 798 798 ilA0m00 5.5653 137655 1596 13089 3 8976 19 8095 8120 186759 9-12% 798 988 12381& 6.8947 170544 1976 16215 4 9104 19 8304 8328 189608 5Qi2 798 1004 "12 f 7.0337 172976 2008 16632 5 9259 19 8755 8780 193456 '$Q%4 798 1024 ;2832; 7.3757 175921 2048 17535 6 9427 19 9660 9686 198459 ,~;Q5 798 1050 %1.3158,, 8.2939 179113 2100 19346 7 9431 19 9704 9730 198623 0.9022- 798 1051 8.3557 179189 2102 19434