HAL Id: hal-00317252
https://hal.archives-ouvertes.fr/hal-00317252
Submitted on 1 Jan 2004
HAL is a multi-disciplinary open access
archive for the deposit and dissemination of
sci-entific research documents, whether they are
pub-lished or not. The documents may come from
teaching and research institutions in France or
abroad, or from public or private research centers.
L’archive ouverte pluridisciplinaire HAL, est
destinée au dépôt et à la diffusion de documents
scientifiques de niveau recherche, publiés ou non,
émanant des établissements d’enseignement et de
recherche français ou étrangers, des laboratoires
publics ou privés.
Unexpectedly small semidiurnal tidal wind amplitudes
in the mid-latitudemesopause region during September
2002
D. Kürschner, Ch. Jacobi
To cite this version:
D. Kürschner, Ch.
Jacobi.
Unexpectedly small semidiurnal tidal wind amplitudes in the
mid-latitudemesopause region during September 2002. Annales Geophysicae, European Geosciences Union,
2004, 22 (2), pp.701-704. �hal-00317252�
Annales
Geophysicae
Unexpectedly small semidiurnal tidal wind amplitudes in the
mid-latitude mesopause region during September 2002
D. K ¨urschner1and Ch. Jacobi2
1Institute of Geology and Geophysics, University of Leipzig, Talstr. 35, D-04103 Leipzig, Germany 2Institute of Meteorology, University of Leipzig, Stephanstr. 3, D-04103 Leipzig, Germany
Received: 9 December 2002 – Revised: 10 April 2003 – Accepted: 23 June 2003 – Published: 1 January 2004
Abstract. The mesopause region monthly mean winds and
semidiurnal tidal amplitudes and phases over Central Europe have been measured at Collm Observatory since Septem-ber 1982. The regular annual cycle of the semidiurnal tidal amplitudes show maximum values during late August and September. In contrast to that, in autumn 2002 no enhance-ment of the tidal amplitudes was measured, while the autumn tidal phase transition occurred unusually early.
Key words. Meteorology and atmospheric dynamics
(mid-dle atmosphere dynamics; waves and tides; climatology)
1 Introduction
The seasonal behaviour of the semidiurnal tidal (SDT) winds in the mesosphere/lower thermosphere (MLT) region around 80–100 km has been investigated using ground-based and space-based measurements (Lysenko et al., 1992; Burrage et al., 1995). Also, modelling of the seasonal variation has been performed using modified classical theory (Greisiger, 1975) and numerical models (Hagan et al., 1999; Manson et al., 1999). The authors concordantly report that the SDT wind amplitudes at higher mid-latitudes (50–55◦) are small
in spring/early summer and late autumn, but larger in winter and above all in late August and September. The phase of the SDT, often defined as the time of maximum eastward wind, generally has different positions in winter and summer, with the latter around 95 km being about 2 h earlier than the for-mer (e.g. Greisiger, 1975). The vertical wavelength of the SDT in winter is about 60 km or smaller, while it is much larger in summer (e.g. Jacobi et al., 1997; Manson et al., 1999). The transition from summer to winter phase gener-ally occurs very regularly during the second half of October. The mid-latitude mesospheric zonal prevailing winds usu-ally change from summer easterlies to winter westerlies in September, resulting in comparatively low mesospheric winds during this month. On average, the MLT winds at
Correspondence to: Ch. Jacobi ([email protected])
higher mid-latitudes are still eastward and increasing with height (e.g. Portnyagin and Solovjova, 2000), which is typi-cal for summer, but with smaller absolute values, and espe-cially in the mesosphere, rapidly changing to westerly winds, i.e. to winter conditions. At Collm Observatory mean winds and SDT amplitudes and phases near 95 km have been mea-sured over the last 4 decades. Vertical profiles of those pa-rameters in the height range 85–105 km are available since September 1982, so that a 21-year data set is available. Here we focus on the unexpected behaviour of the SDT winds in September 2002.
2 Measurements at Collm
At Collm Observatory, LF radio wind measurements are car-ried out on 177, 225, and 270 kHz with differing measuring paths, applying the spaced antenna method and the similar-fade method for analysis. The LF measurements use the re-flected sky wave at oblique incidence from commercial am-plitude modulated radio transmitters, with reflection levels in the MLT between 85 to 105 km and the centre of the tri-angle of the three reflection points is located at 52◦N and 15◦E. The individual measurements on each frequency are combined to half-hourly means, each representing an aver-age of over 30–60 data points, depending on local time, LF propagation, and reflection conditions.
The reference heights are obtained using the amplitude modulation in the frequency range near 1.8 kHz by measur-ing the travel time differences between correspondmeasur-ing mod-ulation bursts in the sky wave and in the ground wave. Due to the strong absorption of the sky waves in the daytime the measurements are restricted to nighttime and twilight condi-tions, especially in the summer months.
The obtained half-hour means of the measured zonal and meridional wind components and the reference height are analysed using a multiple regression analysis with height-dependent coefficients. The measurements and data analysis
702 D. K¨urschner and Ch. Jacobi: Small semidiurnal tidal wind amplitudes
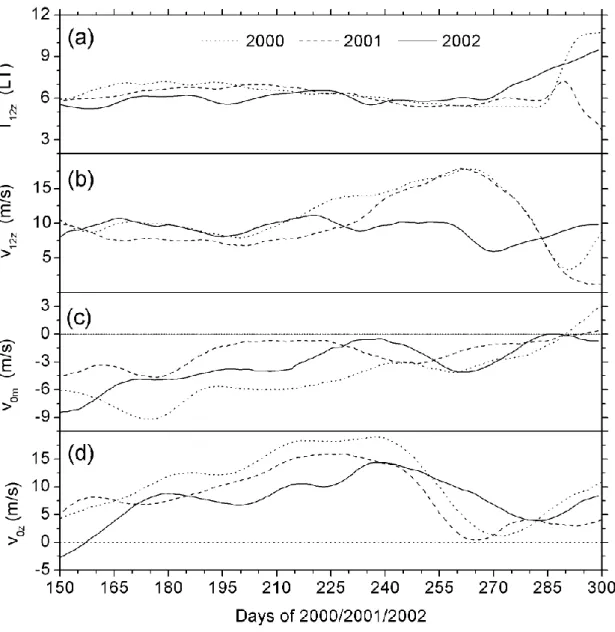
Fig. 1. Time series of (a) zonal SDT phases T12z, (b) zonal SDT amplitudes (v12z), (c) meridional prevailing winds (vom) and (d) zonal prevailing winds (voz) at 93 km over Collm in summer and autumn 2000, 2001, and 2002.
procedures have been described by K¨urschner et al. (1987), Jacobi et al. (1997, 1999), and references therein.
3 Results for September 2002
Figure 1 shows time series of the SDT phases (T12) and
am-plitudes (v12), together with the meridional and zonal mean
wind during summer and autumn 2000, 2001, and 2002. It has been shown, e.g. by Jacobi et al. (1999), that the monthly mean SDT is nearly circularly polarised (see also Fig. 2 be-low), so that the presentation of the zonal component only is obviously sufficient. The data presented in Fig. 1 has been calculated using multiple regression analyses with quadrat-ically height-dependent coefficients that include the mean winds and the oscillations with periods 12 h, 48 h, 10 days
and 30 days: v(h, t )− " 2 X k=0 hka0k+ 4 X j =1 2 X k=0 bj khksin ωjt + 2 X k=0 cj khkcos ωjt !# →min, (1)
with v being the measured zonal or meridional wind at height
h, and time t and ω are the angular frequencies 2π /12 h, 2π /48 h, 2π /10 d and 2π /30 d taken into account. From the resulting coefficients a, b and c the vertical profiles of the mean wind and tidal amplitudes and phases can be calculated (see also Jacobi et al., 1997, 1999). We did not include the diurnal tide into the analysis, because the quasi-regular daily data gaps can cause larger errors in some cases. However, as is discussed by Jacobi et al. (1999), discarding the diurnal
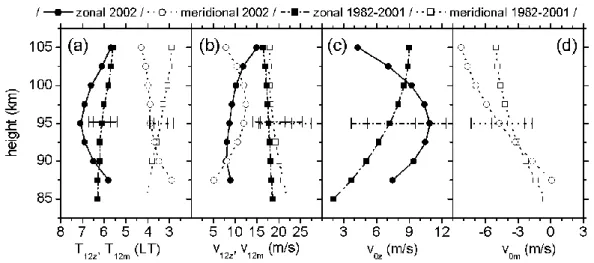
Fig. 2. September 2002 mean profiles of (a) SDT (b) SDT amplitudes (c) zonal prevailing winds and (d) meridional prevailing winds over
Collm. The circles show the 2002 values, while squares denote the climatological 20-year mean values calculated from all September data between 1982 and 2001. The horizontal bars show the maximum/minimum values and the 1−σ variation during that time interval.
tide does not strongly influence the results for other oscilla-tions and the mean winds. Each analysis was performed on a basis of 25 days with each point weighted equally. The results were attributed to the centre of the 25-day time in-terval. The long data window was chosen to obtain a more realistic estimate of the prevailing winds without influence of planetary waves and irregular variations. Therefore, it has to be taken into account that this analysis includes a strong smoothing. The results are shown for an altitude of 93 km, which is the height of maximum measuring density during September 2002. Since the tidal amplitudes during Septem-ber change little with height in the MLT (e.g. Jacobi et al., 1997, see also Fig. 2 below), the exact anchoring height is not decisive for the results.
It can be seen from Fig. 1 that v12and T12in early summer
2002 do not strongly differ from those during other years. However, the increase in amplitude that is regularly starting in early August is not visible in the curve for 2002. The tidal amplitudes remain near 10 m/s during the whole of Au-gust and part of September, while during the second half of September, when a strong maximum is found during other years, even a tendency towards a minimum is visible. The use of the 25-day data window leads to a smoothing effect in the case of variable tidal parameters and consequently, to a reduction of the resulting mean tidal wind amplitudes (vec-tor means), compared with arithmetic mean amplitudes de-termined without respect to the individual phase values from single daily estimations of 12-h tides. When analysing esti-mates after Eq. (1), considering only the SDT and without taking into account the varying measuring height, we ob-tain a September 2002 mean v12 of 14 ± 5 m/s. However,
monthly means calculated from daily analyses of v12in 2000
and 2001, similarly as the smoothed values in Fig. 1, are 5 or 6 m/s larger, respectively, with similar variability. These analyses also show that T12does not change much from day
to day in September 2002. Thus, the smoothing has no
qual-itative effect on the comparison of the 2002 tidal amplitudes with those from other years.
The unexpected behaviour of the SDT amplitudes in 2002 is accompanied by a very early change in the SDT zonal phases from their summer value (about 06:00 UT near 93 km) to the winter value (about 09:00 LT near 93 km). In most years, this change is starting in a very narrow time interval in the second half of October, in the course of which this transi-tion may occur in different ways: either it consists of a sharp phase jump (as in 2000), or of a more moderate progression or also regression of the phase is found (as in 2001). In 2000 and 2001 the phase transition did not start before mid Oc-tober. In contrast to that, the phase transition in 2002 starts about two weeks earlier.
The meridional mean winds in 2002 do not show any un-usual behaviour. The zonal mean winds are different from those during other years in that the decrease in the westerly wind (that in most years also includes easterly winds during a short time interval) is shifted to October 2002, and it is much weaker than usual.
The monthly mean profiles of T12 and v12 and the zonal
and meridional prevailing winds are shown in Fig. 2, together with the mean values calculated from all the September data gathered during 1982–2001. The vertical wavelengths, usu-ally calculated from the T12change with height, are very long
or the wave is even evanescent. This is in accordance with other measurements, but is often poorly reproduced in the models (e.g. Manson et al., 1999). To determine whether or not the 2002 profiles are outside the range of previously mea-sured winds, the maximum and minimum values between 1982 and 2001 at 95 km are also shown, together with the 1−σ variation during that time interval. It can be seen that both the v12 and T12 values are outside of the range of
pre-viously measured values. Comparison with literature results (Lysenko et al., 1992; Manson et al., 1999) also show that none of the v12presented are as small as those measured at
704 D. K¨urschner and Ch. Jacobi: Small semidiurnal tidal wind amplitudes Collm in 2002. The prevailing winds fall in the range of
pre-viously measured wind values, but there is a weak indication that the zonal prevailing winds in the lower height range con-sidered here is stronger than usual, while this is not the case in the upper height range. This is an indication for an un-expected early transition from summer to winter conditions, i.e. westerlies in the mesosphere and a reversal to easterlies above that layer.
4 Conclusions
At Collm, in September 2002, unexpectedly small SDT wind amplitudes have been measured. The September mean am-plitudes are smaller than those measured at Collm in any year of observation since 1982. They are also smaller than those presented by other authors (Lysenko et al., 1992; Manson et al., 1999) for different years or different periods. The small v12 have been accompanied by an unexpected early change
of T12from its summer to winter position.
Regarding the mean zonal wind profiles there is some weak indication that the summer mean circulation in the mesosphere has been shifted to mean winter conditions ear-lier than during other years, so that it is conceivable that the September tides have been modified by an unusual behaviour of the mean circulation. The specific situation in the meso-sphere cannot be shown by the MLT measurements. It may, however, be concluded that the seasonal cycle of tidal winds in the MLT is more variable than hitherto assumed.
Acknowledgements. Topical Editor U.-P. Hoppe thanks a referee for his/her work in evaluating this paper.
References
Burrage, M. D., Wu, D. L., Skinner, W. R., Ortland, D. A., and Hays, P. B.: Latitude and seasonal dependence of the semidi-urnal tide observed by the High-Resolution Doppler Imager, J. Geophys. Res., 100, 11 313–11 321, 1995.
Greisiger, K. M.: Experimentelle und theoretische Untersuchungen des halbt¨agigen Gezeitenwindes als Beitrag zur Dynamik und Struktur der Mesosph¨are, Z. Meteorol., 25, 205–212, 1975. Hagan, M. E., Burrage, M. D., Forbes, J. M., Hackney, J., Randel,
W. J., and Zhang, X.: GSWM-98: Results for migrating solar tides, J. Geophys. Res., 104, 6813–6828, 1999.
Jacobi, Ch., Schminder, R., and K¨urschner, D.: Measurements of mesopause region winds over Central Europe from 1983 through 1995 at Collm, Germany, Contrib. Atmos. Phys., 70, 189–200, 1997.
Jacobi, Ch., Portnyagin, Yu. I., Solovjova, T. V., Hoffmann, P., Singer, W., Fahrutdinova, A. N., Ishmuratov, R. A., Beard, A. G., Mitchell, N. J., Muller, H. G., Schminder, R., K¨urschner, D., Manson, A. H., and Meek, C. E.: Climatology of the semidi-urnal tide at 52◦N–56◦N from ground-based radar wind mea-surements 1985–1995, J. Atmos. Solar-Terr. Phys., 61, 975–991, 1999.
K¨urschner, D., Schminder, R., Singer, W., and Bremer, J.: Ein neues Verfahren zur Realisierung absoluter Reflex-ionsh¨ohenmessungen an Raumwellen amplitudenmodulierter Rundfunksender bei Schr¨ageinfall im Langwellenbereich als Hilfsmittel zur Ableitung von Windprofilen in der oberen Mesopausenregion, Z. Meteorol., 37, 322–332, 1987.
Lysenko, I. A., Makarov, N. A., Portnyagin, Yu. I., Kashcheyev, B. L., Lizogub, V. V., Sidorov, V. V., and Fahrutdinova, A. N.: Sea-sonal and latitudinal variations of the lower thermosphere tidal winds from meteor radar measurements in the U.S.S.R., J. At-mos. Terr. Phys., 54, 915–926, 1992.
Manson, A., Meek, C., Hagan, M., Hall, C., Hocking, W., Mac-Dougall, J., Franke, S., Riggin, D., Fritts, D., Vincent, R., and Burrage, M.: Seasonal variations of the semi-diurnal and diur-nal tides in the MLT: multi-year MF radar observations from 2 to 70◦N, and the GSWM tidal model, J. Atmos. Solar-Terr. Phys., 61, 809–828, 1999.
Portnyagin, Yu. I. and Solovjova, T. V.: Global empirical wind model for the upper mesosphere/lower thermosphere. I. Prevail-ing wind, Ann. Geophysicae, 18, 300–315, 2000.