Dynamic single cell imaging of direct
reprogramming reveals an early specifying event
The MIT Faculty has made this article openly available.
Please share
how this access benefits you. Your story matters.
Citation
Smith, Zachary D et al. “Dynamic Single-cell Imaging of Direct
Reprogramming Reveals an Early Specifying Event.” Nature
Biotechnology 28.5 (2010): 521–526. Web.
As Published
http://dx.doi.org/10.1038/nbt.1632
Publisher
Nature Publishing Group
Version
Author's final manuscript
Citable link
http://hdl.handle.net/1721.1/74519
Terms of Use
Creative Commons Attribution-Noncommercial-Share Alike 3.0
Dynamic single cell imaging of direct reprogramming reveals an
early specifying event
Zachary D. Smith1,2,*, Iftach Nachman1,3,*, Aviv Regev1,4, and Alexander Meissner1,2 Alexander Meissner: alexander_meissner@harvard.edu
1 Broad Institute of MIT and Harvard, 7 Cambridge Center, Cambridge, MA 02142
2 Harvard Stem Cell Institute and Department of Stem Cell and Regenerative Biology, Harvard
University, 7 Divinity Ave, Cambridge, MA 02138
3 Department of Biochemistry and Molecular Biology, Tel Aviv University, Tel Aviv, 69978, Israel 4 Howard Hughes Medical Institute and Department of Biology, Massachusetts Institute of
Technology, Cambridge MA 02140
Summary
Generation of induced pluripotent stem cells is a reproducible but inefficient procedure. While genomic approaches have previously been used to study reprogramming, they average
measurements across a large population of cells, the majority of which fail to induce pluripotency. Here, we used high-resolution, live time–lapse imaging to trace the reprogramming process from single donor cells to pluripotency factor positive colonies. Tracing back successfully
reprogrammed colonies, we calculate a normalized cell-of-origin reprogramming efficiency that is limited to the pool of responding cells that form colonies. Our data provided a detailed physical description of the specific characteristics of reprogramming populations and reveal a robust, sequential trajectory from a somatic morphology and proliferative index to those of pluripotent cells, suggestive of an early specifying event. Our results clarify and expand previously proposed theoretical models, and provide important new insights into the still poorly defined process of direct reprogramming.
Ectopic expression of Oct4 and Sox2 in combination with both Klf4 and c-Myc (OSKM) 1, Klf4 alone 2,3, Lin28 and Nanog 4 or Esrrb 5 is sufficient to reprogram somatic cells to a pluripotent state. These induced pluripotent stem (iPS) cells exhibit many of the molecular and functional characteristics of embryonic stem (ES) cells 6. While iPS cell technology has progressed dramatically within the past three years (reviewed in 7), the extended latency and low efficiency of reprogramming events within induced populations obscure efforts to characterize the underlying mechanism 8. One simple model suggests that progressive proliferation allows for the accumulation of factor-mediated stochastic events that lead select members through a path towards pluripotency. In an alternative model, the likelihood of iPS cell colony formation is specified at an earlier time, after which the resulting path is more defined 8,9,10. Population-level measurements typically done in reprogramming studies cannot distinguish between these stochastic or more sequential events.
Correspondence to: Alexander Meissner, alexander_meissner@harvard.edu. *These authors contributed equally to this work
Author contributions
NIH Public Access
Author Manuscript
Nat Biotechnol. Author manuscript; available in PMC 2010 November 1.
Published in final edited form as:
Nat Biotechnol. 2010 May ; 28(5): 521–526. doi:10.1038/nbt.1632.
NIH-PA Author Manuscript
NIH-PA Author Manuscript
To study reprogramming at the single cell level, we developed a live cell, high throughput imaging system based on previously characterized, clonally inducible murine embryonic fibroblast (MEFs) 11 (Supplementary Fig. 1,2). High-resolution transmitted light images (Fig. 1a, upper panels) taken along a 12-day time course from the initial fibroblasts to the final iPS cell colonies show that even at low starting cell densities it is virtually impossible to accurately follow the progeny of a single cell over the course of days. To facilitate tracking of individual cells, we transduced MEFs with one of several lentiviral vectors encoding different fluorescent proteins and seeded them at variable densities into unlabeled populations (Fig. 1a; lower panels and Supplementary Movie 1).
Our system allows us to trace multiple discrete reprogramming “lineages” from parental fibroblast to terminal iPS cell colony. We acquired images over complete 12 or 14 day experiments at 0.25–0.5 day intervals across a connected spatial range to provide a representative global field at a sufficient resolution for tracing lineage identity from any starting cell (Fig. 1b). To provide information for multiple distinctly labeled lineages at every site over time, we acquired information at each position in phase contrast and for up to four fluorescent wavelengths (Fig. 1b). We generated over 500,000 images covering a total of over 80 imaged plates for the subsequent analysis. We scored positive reprogramming events from terminal acquisitions (at day 12 or 14) via stringent Nanog and E-Cadherin (Cdh1) immunostaining, and traced them retroactively to their first progenitor at t=0 days. Using multi wavelength overlays (Fig. 1d, lower panels and Supplementary Movie 1) we can readily distinguish initial MEFs and track the resulting iPS cell colonies in the global field (Fig. 1b; upper right corner, Fig. 1d; lower panels and Supplementary Movie 1). We measured the reprogramming efficiencies as the fraction of double positive colonies from the starting cell numbers for each distinct wavelength (e.g., a representative Cdh1 stain on day 12.5; Fig. 1c). Overall reprogramming efficiency fell within 0–33%, an expected variability given the low starting numbers of labeled cells (50–200). The mean efficiency of 3.7% across all examined experiments (n=40) and the downstream characterization of isolated lines (Supplementary Fig. 2,3) show that our system is consistent with other studies
11,12,13.
However, upon retroactive tracing, we found that only a subset of iPS cell colonies (termed “primary”) could be traced to a source MEF at t=0 days (Fig. 2a; yellow arrowheads). Another subset of smaller and more symmetrical colonies consistently appeared later between days 6–12 days and upon close inspection could not be traced to an original fibroblast (Fig. 2a, b and Supplementary Fig. 4; red arrowheads and Supplementary Movie 2). Moreover, these late colonies appear to emerge in the inspected position as complete iPS cells, with characteristic small size, round shape, rapid self-renewal and compacted colony growth. We concluded that they likely arise from single cells or small compacted clusters that had reprogrammed at an ectopic site outside the inspected region and are likely secondary events or “satellites” that do not uniquely correspond to a single responding lineage (Fig. 2a, b and Supplementary Fig. 4, 5). As such, these secondary satellites inherently confound true calculations of reprogramming efficiency. We therefore defined a normalized efficiency in which reprogramming events are counted only if they can be traced to their originating fibroblast, and in which satellites were excluded. This normalized efficiency ranged between 0–8% primary colonies per representative wavelength with a mean of 1.15% across all experiments (Fig. 2c and Supplementary Fig. 3).
The distinction between primary and satellite colonies allowed us to reappraise calculated reprogramming efficiencies over time. Surprisingly, primary colonies arise rapidly and reach a stable number within the first 8 days of reprogramming. Furthermore, in many instances, single originating cells were found to separate into distinct sub-populations that uniquely and independently gave rise to iPS cell colonies at the same time (Fig. 2d and
NIH-PA Author Manuscript
NIH-PA Author Manuscript
Supplementary Movie 3). Conversely, satellites appear later and continue to increase, likely an effect of the progressive growth of iPS colonies each of which can expand clonally over time (Fig. 2e), increasing the likelihood that cells will detach from a primary colony and form a satellite elsewhere. These observations suggest that during the initial two-week period, only a select number of cells are capable of reaching the iPS cell state and do so within a defined temporal window shortly after factor induction. The ability to distinguish primary from satellite colonies can thus impact current models of reprogramming that may have previously included artifacts scored as de novo events (Fig. 2e).
Several distinct cell types arose after induction based on broad morphological and proliferative characteristics. As expected, most cells fail to initiate reprogramming, and generally resemble the initial somatic fibroblast population (Fig. 3a; t=0 days) and respond with either arrested/apoptotic (A) or slow dividing (SD) behaviors, consistent with time series data and Annexin V staining (Fig. 3a; A and SD panels, and Supplementary Movies 4a and b). In addition, we observe a fast dividing fibroblast (FD) population at a much lower frequency (~1% of the starting fibroblasts). These cells exhibited a higher proliferative rate than normal fibroblasts and initially showed a large decrease in size, but retained
mesenchymal characteristics (Fig. 3a; FD panel and Supplementary Movie 4c).
In contrast, when we traced primary iPS cell colonies back to their original source cell, we found that these lineages belong within a unique class of small and fast dividing cells that is established early upon induction (Fig 3a; iPS panel, and Supplementary Movie 4d). Based on gross morphological examination, within a few divisions, these cells become
significantly smaller than the starting fibroblast population and exhibit a heightened proliferative rate. To quantify these observations we examined 19 representative primary colonies and traced them back to a starting MEF at t=0 days (Supplementary Fig. 6). The cells that lead to iPS cell colonies had an increased proliferative rate (generation time 12.2±2.8 hrs) after the first division, and grew exponentially over the next several days at a rate similar to that observed for murine ES cells (11–16 hrs) 14, and much faster than that of somatic murine cells such as MEFs (18–22 hrs) 15 or of the induced population as a whole (Fig. 3b). The fast proliferative trait was conferred equally to both daughter cells as early as the first division (Supplementary Fig. 7a, and Supplementary Movie 1).
iPS cell forming populations were also distinct in cell area and shape. Lineages that form iPS cell colonies exhibit a sequential reduction in cellular area over time (when normalized by the number of divisions), and acquire a new, stably maintained size concurrent with their increased proliferative rate within 3–4 divisions (Fig. 3c, Supplementary Fig. 7b). The narrow size range of these smaller cells is unique compared to the variability in initial fibroblasts or within FD cells. iPS cells also exhibit changes in eccentricity, or cell shape, and their intercellular characteristics suggest an enhanced clustering compared to the original MEFs (Supplementary Fig. 7c, d). Moreover, as the number of cells descending from an individual MEF increases, multiple progenitors confer these morphological and proliferative characteristics on all their progeny cells. The apparent symmetry by which these traits are inherited indicates a fundamental change in the homeostatic principles governing somatic MEFs that can occur as early as the first division (Fig. 1d, 3c, Supplementary Movies 1,3,4d, Supplementary Fig. 7). These results suggest that
establishing rapid divisions, in which size decreases, is not only an essential trait needed to establish iPS cells, but one that emerges early and precedes subsequent, more frequent, and possibly less stochastic events.
Recent reports have suggested that p53 and downstream pathways can significantly enhance murine and human reprogramming efficiency 16,17,18,19,20,21. Given our ability to monitor the reprogramming process, we directly investigated the effect that p53 plays at the single
NIH-PA Author Manuscript
NIH-PA Author Manuscript
cell level. We substituted one of our labeled fluorescent populations with one infected by a lentiviral vector co-expressing constitutive EGFP and an shRNA targeting the canonical tumor suppressor p53 (Fig. 4a and Supplementary Fig. 8) 22. We found a notable (4.1-fold) increase in the number of cells that initiated and maintained a heightened proliferative rate, size reduction, and cluster formation compared to the internal fluorescently labeled (but no shRNA) controls (Fig. 4a, b). On day 14, our terminal image acquisition for this experiment, we stained for Nanog, E-Cadherin, and Alkaline Phosphatase (AP) in all imaged wells (Fig. 4a; right panels). While p53 knockdown apparently expanded the global population of responding cells, many led to aberrant colonies, thus resulting in no increase or even a reduction in the overall reprogramming efficiency when normalized against single cells at the time of induction. In particular, when we characterized the ratio of aberrant (non reprogrammed) to fully reprogrammed colonies, we found a higher fraction of aberrant colonies in p53-depleted cells compared to control populations (Fig. 4a–c, Supplementary Movie 5). Interestingly, we found that the early response within p53 KD cells (time of first division 1.30+-0.19 days (n=11)) that led to these pluripotency marker-negative colonies was comparable to the normal responding populations that form marker-positive iPS cells (Fig. 4d, e, Supplementary Movie 5 and Supplementary Fig. 8). However, at later time points we observed a greater variability in proliferation and terminal size (Supplementary Movie 5). Given the finite number of p53 depleted cells per population in this experimental setting, and their discrete, fibroblast-of-origin dependent normalization, we conclude that the progenitor pool can be expanded by this perturbation, but this expansion does not
necessarily improve the fraction of cells that can form complete, molecularly defined iPS cell colonies within the described temporal window.
Previous reports in which p53 has been globally depleted and shown to improve
reprogramming efficiency rely on counting iPS cell colonies at a (static) terminal time point. They are thus incapable of discerning the subset of somatic cells that respond positively to factor induction or of measuring the co-occurring accumulation of aberrant colony
morphologies 16,19,20. Conversely, our results suggest a model where early loss of p53 may derail cells with an otherwise established stochiometry of OSKM factors from the normal reprogramming trajectory or stabilize an intermediate state that would otherwise lead sequentially to the formation of complete iPS cells 16,19,20.
As reprogramming lineages continued into intermediate points within the timeline, it became increasingly difficult to identify or segment all cells in a responding population. Nevertheless, distinct events within the timeline could still be identified and attributed to unique lineages. We scored the analyzed colonies for compaction events by which cells exhibited enhanced intercellular binding and through which final iPS cell colonies emerged. These consistently arose between days 4 and 8 from the rapidly-dividing, size-reduced cells with similar latency (Supplementary Figure 9, Supplementary Movie 6) 11,13,23.
Previous studies propose several models for reprogramming 9,10, most recently a ‘stochastic one-step model’ 10, where reprogramming of a given cell type under a given condition can occur stochastically in one step throughout the time line of the experiment at a uniform intrinsic probability per cell that depends only on the derivation conditions. We tested the fit of a ‘stochastic one-step model’ when limited to the iPS cell lineages alone, using colony compaction times as determinants for reprogramming and found a rate on the order of 0.001 per cell per day (Supplementary Fig. 9e, purple curve). Our rate is markedly higher than the kinetics found when tracing reprogramming events that occur after a standard 14 day time period 10. Furthermore, colony compaction times show a similar or better fit to a normal distribution that is more consistent with a sequential model, where a series of steps in a lineage leads to successful reprogramming (Supplementary Fig. 9e). The immediate induction of these responses and the consistent subsequent events are in line with both an
NIH-PA Author Manuscript
NIH-PA Author Manuscript
“elite” deterministic model (where the subset of reprogramming lineages is determined early) and a stochastic model that assumes a stepwise acquisition of traits in which early choices play a dominant role (Supplementary Figure 9). The highly synchronized and reproducible nature of these events further argues against a model with multiple stochastic rate-limiting steps.
In conclusion, our high resolution data lead to several new insights including: (1) an accurate measure of reprogramming efficiency that is normalized according to a colony’s cell of origin and may be used to characterize molecular strategies for enhanced iPS cell generation (2) the identification of iPS cell forming characteristics by proliferation, size, and morphology that precede terminal pluripotency and (3) a more refined interpretation of proposed theoretical models within a practical framework. The observed de-coupling of cell size and proliferation in reprogramming cells is a radical departure from the fibroblast cell cycle, and suggests that overcoming this cell size checkpoint is an important early step in reprogramming. Normal fibroblasts maintain tight control over their cell size that is retained after mitosis during the prolonged G1 phase of the somatic cell cycle 24. The fact that all tracked cells that successfully reprogram show immediate initiation of increased
proliferation and cell size reduction suggests that ectopic factor expression allows these cells to overcome those checkpoints early as a necessary step (Fig. 3b, c). However, the fact that alternative fates, such as the observed fast dividing (FD) cells and p53 KD cells, show a similar initial response (Fig. 3 and 4) suggests that increased proliferation and size-reduction is not itself sufficient or is even an intermediate state that can be itself stabilized to the detriment of iPS cell generation. Furthermore, while successful reprogramming may be initiated early, it nonetheless requires the continued expression of the factors as demonstrated by previous doxycycline withdrawal experiments 13,23.
The low efficiency of reprogramming emphasizes that population-based measurements are not perfectly suited to dissect its molecular mechanism. Unfortunately, the identification of physical parameters unique to responding populations does not yet explain the nature by which these decisions are made. More nuanced strategies for isolating or expanding this small responding population will be needed in order to completely understand the stages inherent within the gradual re-acquisition of pluripotency as well as their mediating factors. We propose as one possible mechanism that the preliminary response may rely on a unique coupling of somatic silencing as mediated by Oct4/Sox2 and the acquisition of ES-like biosynthesis and cell cycle as mediated by the Myc oncogene, a predominant transcription factor with abundant somatic targets. A complete understanding of the changes that occur within the cells that transition to pluripotency will be necessary for safer and more efficient generation of iPS cells that will eventually unlock their tremendous potential for
regenerative medicine.
Materials and Methods
Generation of Fluorescently-Labeled Inducible Fibroblast Lines
E13.5 doxycycline-inducible fibroblasts were generated as described previously and passed twice before infection with a FUW lentivirus 12 in which GFP, YFP, RFP or a CFP-B actin fusion protein (Evrogen) was cloned via PCR amplified EcoRI sites. Fibroblast cultures infected with one respective fluorescent protein were expanded for at least one additional passage before serum starvation and seeding at unique representations within control, uninfected inducible MEFs that were passaged in parallel. MEFs were cultured under serum starvation conditions until the onset of imaging at which point they were switched into standard mouse ES medium supplemented with 2 μg/ml doxycycline (Sigma). This protocol ensured a uniform initial response to ectopic factor induction from a globally stable somatic population arrested in G1 and facilitated the tracking of single cells. Cells were kept on Dox
NIH-PA Author Manuscript
NIH-PA Author Manuscript
for the duration of all imaging experiments. Isolated iPS cell lines were expanded without Dox and characterized by immunostaining and via blastocyst injection. Primers for real time are as described in 12 and 21 and conducted using an SuperScript® II Reverse Transcriptase (Invitrogen), Power SYBR® Green PCR Master Mix (Applied Biosystems) and a 384 well 7900 RT-PCR Machine (Applied Biosystems).
Image Acquisition, Immunohistochemistry, and iPS cell Colony Scoring
Inducible MEFs were plated in 12 well plates at low densities and imaged using a IX-71 microscope (Olympus) and motorized Prior XY stage (Supplementary Fig. 10). Images were taken within a connected 4×4 or 5×5 spatial range at 10x magnification and in up to 4 fluorescent wavelengths using Metamorph Advanced High Though-put Screening software (Metamorph). Acquisitions were taken with manual oversight every 6 to 12 hours for 10–14 days to minimize the exposure of induction plates to atmospheric conditions and
temperature. At the end of a given imaging experiment, plates were fixed in 4% Paraformaldehyde and immunostained for (Abcam or Convance) and/or E-cadherin (Abcam) at 1:500 dilution and detected using Alexa488 or Alexa594 conjugated secondary Antibodies (Jackson Immunoresearch). Additional Immunostaining for line characterization used Oct4 (Abcam), Stella (Millipore), and SSEA1 (Santa Cruz) primary antibodies. Alkaline Phosphatase was detected using a standard AP staining kit (Stemgent) with 8 and 40 minutes (see Supplementary Figure 8) sequential incubations that provided a precise gauge of stain sensitivity. Without analyzing time-lapse information, colonies were scored in efficiency calculations if they demonstrated uniform signal positivity and appeared distinct from other colonies (see Figure 1c) as a standard metric.
Image Analysis
A semi-automated cell segmentation pipeline using the CellProfiler package 25 was employed on images from the fluorescent channels for the period in which cells were discernable by eye (around 4 days for proliferative cells). The package then calculated morphological attributes (such as area and eccentricity) for each cell. Further analysis was done in Matlab. Manual analysis such as time of compaction, or assigning of morphological attributes (SD, FD, iPS, A), used time-lapse images of entire 4×4 or 5×5 global fluorescent overlays across the entire experimental timeline. Sites of interest (predominantly those containing iPS colonies) were scored and tracked retrospectively to the earliest point in which a parent cell could be observed. Primary colonies were scored as those with initial fibroblast origins whereas secondary events were scored if no discernable origin could be found. Primary colonies were catalogued according to their initial response, the time of compaction as measured by the earliest instance in which cells demonstrated compact ES-like colony growth, and pluripotency marker staining. Satellites were scored for marker positivity and for the earliest time in which they were observed. Colonies and other morphologies for CellProfiler analysis were annotated during this manual analysis and stacks of phase contrast and respective wavelengths of interest were generated
(Supplementary Figure 10). Movies were constructed using basic ImageJ software with StackCombiner and MtrackerJ plug-ins (ImageJ). For the characterization of the satellite colony appearance, a bounding rectangle was manually determined for each of the analyzed satellite and primary iPS cell lineages. Total fluorescent intensity in the rectangle was summed for each time point.
Modeling and Statistical Analysis
We tested a one-step stochastic model 10 where the probability of a given cell to reprogram at time t is proportional to e−kt. Assuming average proliferation time of τ, and neglecting cell death events, the model implies the probability of a lineage to have any reprogramming cell by time t is:
NIH-PA Author Manuscript
NIH-PA Author Manuscript
Colony compaction times were fit to this model to find the optimal k using τ=12h, as well as to a Gaussian distribution model. Maximum likelihood estimator was used to fit parameters, and a likelihood ratio test was used to compare the fit of the models.
Supplementary Material
Refer to Web version on PubMed Central for supplementary material.
Acknowledgments
We thank Anne Carpenter and Mark Bray from the Broad Imaging Platform for help with the initial CellProfiler image analysis pipeline. We thank Eric S. Lander and Christoph Bock for critical reading of the manuscript as well as Matt Thomson, Max Staller, Alejandro De Los Angelos, and Julia Dennett for technical assistance and intellectual input. IN was supported by a Merck postdoctoral fellowship and an Alon fellowship. AR was supported by a Career Award at the Scientific Interface from the Burroughs Wellcome Fund, an NIH Pioneer Award, and the Sloan Foundation. A.R. is an Early Career Scientist of the Howard Hughes Medical Institute and an Investigator of the Merkin Foundation for Stem Cell Research at the Broad Institute. AM was supported by the Pew Charitable Trust and a New Investigator grant by the Massachusetts Life Science Center (MLSC). This work was funded by the Pew and MLSC.
References
1. Takahashi K, Yamanaka S. Induction of pluripotent stem cells from mouse embryonic and adult fibroblast cultures by defined factors. Cell 2006;126:663–676. [PubMed: 16904174]
2. Nakagawa M, et al. Generation of induced pluripotent stem cells without Myc from mouse and human fibroblasts. Nat Biotechnol 2008;26:101–106. [PubMed: 18059259]
3. Wernig M, Meissner A, Cassady JP, Jaenisch R. C-Myc is dispensable for direct reprogramming of mouse fibroblasts. Cell stem cell. 2007
4. Yu J, et al. Induced pluripotent stem cell lines derived from human somatic cells. Science 2007;318:1917–1920. [PubMed: 18029452]
5. Feng B, et al. Reprogramming of fibroblasts into induced pluripotent stem cells with orphan nuclear receptor Esrrb. Nat Cell Biol 2009;11:197–203. [PubMed: 19136965]
6. Maherali N, et al. Global epigenetic remodeling in directly reprogrammed fibroblasts. Cell Stem Cells 2007:55–70.
7. Amabile G, Meissner A. Induced pluripotent stem cells: current progress and potential for regenerative medicine. Trends in molecular medicine 2009;15:59–68. [PubMed: 19162546] 8. Jaenisch R, Young R. Stem cells, the molecular circuitry of pluripotency and nuclear
reprogramming. Cell 2008;132:567–582. [PubMed: 18295576]
9. Yamanaka S. Elite and stochastic models for induced pluripotent stem cell generation. Nature 2009;460:49–52. [PubMed: 19571877]
10. Hanna J, et al. Direct cell reprogramming is a stochastic process amenable to acceleration. Nature 2009;462:595–601. [PubMed: 19898493]
11. Mikkelsen TS, et al. Dissecting direct reprogramming through integrative genomic analysis. Nature 2008;454:49–55. [PubMed: 18509334]
12. Wernig M, et al. A drug-inducible transgenic system for direct reprogramming of multiple somatic cell types. Nat Biotechnol 2008;26:916–924. [PubMed: 18594521]
13. Stadtfeld M, Maherali N, Breault D, Hochedlinger K. Defining molecular cornerstones during fibroblast to iPS cell reprogramming in mouse. Cell stem cell 2008;2:230–240. [PubMed: 18371448]
NIH-PA Author Manuscript
NIH-PA Author Manuscript
14. Orford KW, Scadden DT. Deconstructing stem cell self-renewal: genetic insights into cell-cycle regulation. Nat Rev Genet 2008;9:115–128. [PubMed: 18202695]
15. Kamijo T, et al. Tumor suppression at the mouse INK4a locus mediated by the alternative reading frame product p19ARF. Cell 1997;91:649–659. [PubMed: 9393858]
16. Hong H, et al. Suppression of induced pluripotent stem cell generation by the p53-p21 pathway. Nature 2009;460:1132–1135. [PubMed: 19668191]
17. Kawamura T, et al. Linking the p53 tumour suppressor pathway to somatic cell reprogramming. Nature 2009;460:1140–1144. [PubMed: 19668186]
18. Li H, et al. The Ink4/Arf locus is a barrier for iPS cell reprogramming. Nature 2009;460:1136– 1139. [PubMed: 19668188]
19. Marion RM, et al. A p53-mediated DNA damage response limits reprogramming to ensure iPS cell genomic integrity. Nature 2009;460:1149–1153. [PubMed: 19668189]
20. Utikal J, et al. Immortalization eliminates a roadblock during cellular reprogramming into iPS cells. Nature 2009;460:1145–1148. [PubMed: 19668190]
21. Banito A, et al. Senescence impairs successful reprogramming to pluripotent stem cells. Genes Dev 2009;23:2134–2139. [PubMed: 19696146]
22. Ventura A, et al. Cre-lox-regulated conditional RNA interference from transgenes. Proc Natl Acad Sci U S A 2004;101:10380–10385. [PubMed: 15240889]
23. Brambrink T, et al. Sequential expression of pluripotency markers during direct reprogramming of mouse somatic cells. Cell stem cell 2008;2:151–159. [PubMed: 18371436]
24. Singh AM, Dalton S. The cell cycle and Myc intersect with mechanisms that regulate pluripotency and reprogramming. Cell stem cell 2009;5:141–149. [PubMed: 19664987]
25. D’Amour KA, et al. Production of pancreatic hormone-expressing endocrine cells from human embryonic stem cells. Nat Biotechnol 2006;24:1392–1401. [PubMed: 17053790]
NIH-PA Author Manuscript
NIH-PA Author Manuscript
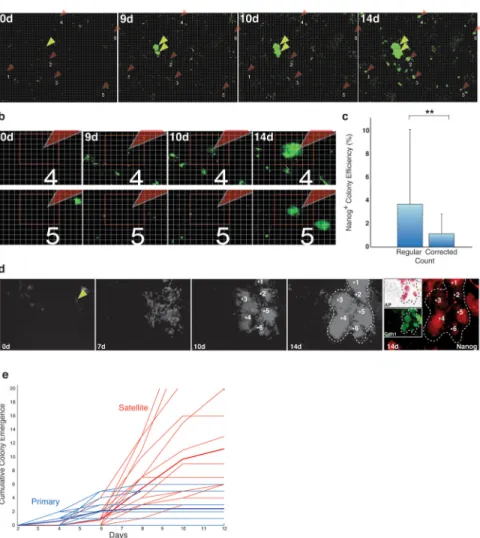
Figure 1. Continuous single cell imaging allows tracking of reprogramming cells
a) Tracking of uniquely labeled inducible fibroblast populations over a reprogramming time
series. Selected images are displayed as a global 4x4 field in phase contrast (Upper Panel) and with respective wavelengths highlighted (Lower Panel). All images are at 10× magnification.
b) 4×4 multi-wavelength overlay at t=0 days. These images were used to accurately count
the seeded (and attached) number of starting MEFs for direct assessment of reprogramming efficiency of equivalently induced populations. Cells of a given wavelength (here YFP, n=78) within the tracked field were enumerated for downstream analysis.
c) Terminal (day 12.5) E-Cadherin (Cdh1) immunostaining demarcates successfully
reprogrammed colonies and demonstrates the equitable distribution of colony forming events across analyzed wavelengths and for the population as a whole. Yellow arrowheads mark colonies that originated from unique YFP labeled MEFs. Red arrowheads mark colonies that originated from RFP labeled MEFs. Magenta numbers indicate colonies (circled with dashed line) that were counted. Efficiencies provided are based on the number of marker positive colonies divided by the number of MEFs counted in b (YFP and RFP) or the total number (including unlabeled) seeded.
NIH-PA Author Manuscript
NIH-PA Author Manuscript
d) Progression of single fibroblast to an iPS cell colony over 12.5 days in phase contrast
(Upper Panel) and with respective wavelengths highlighted (Lower Panel). Colonies were identified at the terminal time point and retrospectively traced to their founding fibroblast. Tracking of a single cell through the complete time series allows for comparative
morphological characterization of cells that do reprogram against those that do not. Here, a reprogramming lineage beginning with a single YFP labeled fibroblast (#16 shown in Fig 1b, magenta square) is traced to the resulting iPS colony (see Supplementary Movie 1).
NIH-PA Author Manuscript
NIH-PA Author Manuscript
Figure 2. Progressive accumulation of secondary, non-unique “satellite” colonies skew interpretation of reprogramming data
a) GFP labeled satellite colonies without unique origins over a global 5x5 field in 10x
magnification. Satellite colonies (a subset highlighted with red arrowheads; see
Supplementary Fig. 5 for more images) typically become macroscopically visible after day 6 and clearly and the formation of primary colonies (yellow arrowheads) without a traceable origin (see Supplementary Movie 2). A grid (light grey) and squares (red) were added to the image to help orientation and facilitate comparison.
b) Zoom-in view of two satellite colonies (satellite # 4 and #5). For colony #4 it is clearly
visible between day 9 and 10, that all cells are accounted for, but that a new cluster of cells (arrowhead) has appeared within 24h. Note the small green dot that has not moved. Similarly, below it is apparent that neither of the two colonies present in the day 14 image originated from any cell in this field. The entire imaged area and additional colonies can be inspected in Supplementary Fig. 4.
c) Corrected efficiencies accounting for colonies in which a unique cell of origin status can
be assigned, and removing all apparent secondary events, compared to un-corrected
efficiencies. Mean of all analyzed (n=40) experiments is shown. The efficiency distributions are significantly different (p=0.00034, paired t-test).
d) A single YFP labeled inducible MEF (asterisk) exhibits the potential to contribute
multiple (at least 6) colony forming events before cells demonstrate an iPS cell morphology,
NIH-PA Author Manuscript
NIH-PA Author Manuscript
suggesting that the ability to reprogram is specified in early precursors and distributed to multiple progeny (see Supplementary Movie 3).
e) Cumulative primary and satellite colonies per well analyzed (n=16). Primary colonies
arise during the first 4–8 days after which the number stabilizes. Satellites were scored at day 14 and traced to the earliest time (typically between day 6–12) in which a founding cell could be identified. Thin lines represent individual experiments. Bold line indicates the mean over all experiments.
NIH-PA Author Manuscript
NIH-PA Author Manuscript
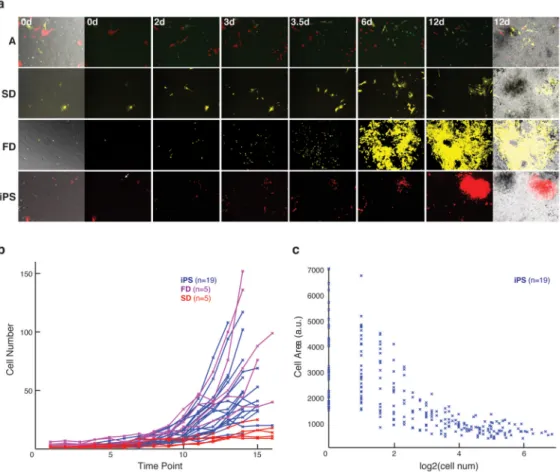
Figure 3. Unique fates of induced fibroblasts reveal a conserved trajectory for reprogramming cells
a) Representation of unique cell fates in response to factor induction. From top to bottom:
Apoptotic/Arrested (A), Slow Dividing (SD), Fast Dividing Fibroblast (FD) and (iPS) cell morphologies at t=0 days and across representative time points during the reprogramming process (see Supplementary Movies 4a-d). The left and right images are transmitted, multi-or single- wavelength overlays. Center images show only the different wavelength images. Time is indicated in days. Images are 10×.
b) Cell number over the first 4 days of the reprogramming timeline (time point= 0.25 days);
lines represent the median for lineages of non-reprogramming cell types (FD, magenta, n=5; SD, red, n= 5) and cells that will form iPS cell colonies (iPS, blue, n=19)
c) Cellular area (in arbitrary units/pixels) as mapped over division number within iPS cell
forming lineages (n=19). A stable ES/iPS like cell size is reached within 2–4 divisions.
NIH-PA Author Manuscript
NIH-PA Author Manuscript
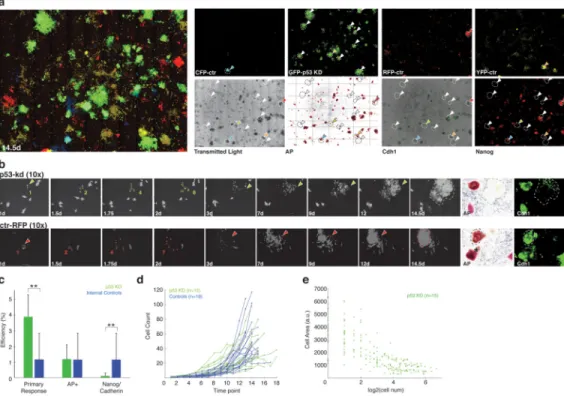
Figure 4. Effects of p53 knockdown on single cells during the reprogramming process
a) A revised imaging experiment in which control cells were tagged as before with YFP,
CFP or RFP. The control GFP vector was replaced with a p53-shRNA containing GFP vector 22. Induction and acquisition were done as before. Left: Multi-wavelength overlay shows the notable increase in GFP colonies. Right: p53 depleted cells (tagged with GFP) exhibit an increased number of colony-like morphologies that display only minimal
activation of endogenous pluripotency factors. Most of the GFP colonies cannot be matched to an AP, Cdh1 or Nanog positive colony. Note: The transmitted light and the marker stains show all colonies (including unlabeled controls which represent the majority; white arrows: factor negative colonies; colored arrows: factor positive colonies). Colonies are circled with dashed lines to facilitate mapping across images.
b) Selected images of the progression for a single p53 depleted cell (upper panel) and a
control cell (tagged with RFP, bottom panel). Both exhibit similar enhanced proliferation and morphological characteristics at early time points but result in disparate fates
(Supplementary Movie 5). Last panels on the right show AP and Cdh1 staining.
c) Formation of primary colonies, AP positivity, and Nanog/Cadherin signal for p53
depleted cells compared to alternatively labeled controls (p-values 0.00004, 0.4 and 0.01, respectively, paired Kolmogorov-Smirnof test) as calculated by events over starting population. Means over 8 wells are shown.
d) The proliferative characteristics of reprogramming p53 knockdown cells are comparable
to reprogramming controls over the first 4 days.
e) p53 knockdown cells exhibit size reduction dynamics that are also similar to those for
normally reprogramming cells within the first 4 divisions.