This may be the author’s version of a work that was submitted/accepted
for publication in the following source:
Perrin, Dimitri
& Duhamel, Christophe
(2013)
Optimisation algorithms for microarray biclustering.
In Lovell, N (Ed.) Proceedings of the 2013 35th Annual International
Con-ference of the IEEE Engineering in Medicine and Biology Society (EMBC
2013).
IEEE, United States of America, pp. 592-595.
This file was downloaded from:
https://eprints.qut.edu.au/82684/
c
Consult author(s) regarding copyright matters
This work is covered by copyright. Unless the document is being made available under a Creative Commons Licence, you must assume that re-use is limited to personal use and that permission from the copyright owner must be obtained for all other uses. If the docu-ment is available under a Creative Commons License (or other specified license) then refer to the Licence for details of permitted re-use. It is a condition of access that users recog-nise and abide by the legal requirements associated with these rights. If you believe that this work infringes copyright please provide details by email to [email protected]
Notice: Please note that this document may not be the Version of Record
(i.e. published version) of the work. Author manuscript versions (as
Sub-mitted for peer review or as Accepted for publication after peer review) can
be identified by an absence of publisher branding and/or typeset
appear-ance. If there is any doubt, please refer to the published source.
Optimisation algorithms for microarray biclustering
Dimitri Perrin
?and Christophe Duhamel
†Abstract— In providing simultaneous information on expres-sion profiles for thousands of genes, microarray technologies have, in recent years, been largely used to investigate mecha-nisms of gene expression. Clustering and classification of such data can, indeed, highlight patterns and provide insight on biological processes. A common approach is to consider genes and samples of microarray datasets as nodes in a bipartite graphs, where edges are weighted e.g. based on the expression levels. In this paper, using a previously-evaluated weighting scheme, we focus on search algorithms and evaluate, in the context of biclustering, several variations of Genetic Algorithms. We also introduce a new heuristic “Propagate”, which consists in recursively evaluating neighbour solutions with one more or one less active conditions. The results obtained on three well-known datasets show that, for a given weighting scheme, optimal or near-optimal solutions can be identified.
I. INTRODUCTION
The mechanisms leading to the development of the phe-notype form a very complex biological system, that involves interactions between a large number of genes. Common techniques used to study gene expression mechanisms in-clude microarrays and related analysis techniques. These are used for large-scale transcriptional profiling, measuring expression levels of thousands of genes at the same time. By understanding gene expression, further insight can be gained into cell function and cell pathology [18].
Several analysis techniques have been developed, (see e.g. [15] for a general review), and a number are variations of the concept of clustering. The idea is to group genes, based on their expression under multiple conditions (or over different time-points) or, conversely, to group conditions according to expression of several genes [13], [14].
Biclustering was introduced, by [4], as the simultaneous clustering of both genes and conditions. The authors identi-fied three advantages over traditional clustering:
• Better at selecting genes and conditions with coherent measurement and dropping those representing noise.
• Grouping based on similarity in the context of the subset of conditions. Biclustering, therefore, discovers both grouping and context, a result more advanced than that obtained from successive clustering of rows and then columns separately.
• Biclustering allows genes and conditions to be part of multiple biclusters, i.e. be identified by more than
?D. Perrin is with the Laboratory for Systems Biology, RIKEN Center
for Developmental Biology, Kobe, Japan, and with the Centre for Scien-tific Computing and Complex Systems Modelling, Dublin City University, Dublin, Ireland.dperrin at cdb.riken.jp
†C. Duhamel is with LIMOS, CNRS UMR 6158, Universit´e Blaise
Pascal, Clermont-Ferrand, France.duhamel at isima.fr
one functional category. This is reflective of actual functionality of genes.
These authors also considered the complexity of the prob-lem, later shown to be NP-complete [12].
Several categories of biclustering algorithms coexist, and vary as to type of biclusters achieved. While some look for biclusters with constant values on rows and/or columns, (see e.g. [1]), it was highlighted by [10] that more advanced, improved algorithms locate biclusters with coherent values [20] or coherent evolution [8]. This latter category is very interesting: biclusters are formed irrespective of the exact expression values, but rather by looking at evidence that a group of genes show similar expression patterns over a number of conditions, (see e.g. [16]).
However, analysis methods for gene expression microar-rays, even though widely used, often lack formal validation and evaluation, either as a whole (as outlined in [17]), or even of their main components. In particular, these tech-niques rely heavily on weighting schemes which, given their importance, are surprisingly rarely analysed. This is also true for algorithms underpinning the analysis, yet most are said to perform “reasonably”. This presents difficulties in terms of meaningful evaluation and attempted improvements. We focus here on the analysis techniques, and use a weighting that has been previously described and assessed [7]. In particular, we evaluate the performances of a parallel genetic algorithm (PGA) and of a new heuristic (“Propagate”).
II. MATHEMATICAL MODEL
In this study, we consider data from the gene expression matrix as bipartite graph. Two sets of nodes represent genes and experimental conditions, respectively. Edges are limited to connecting these two sets, hence the bipartite structure. It is a complete bipartite graph (or biclique), since there is an edge linking any pair of gene-condition. In this context, a bicluster is a subgraph which conserves the biclique structure. In other words, the proposed algorithm will look for bicliques with minimum total weight (see Figure 1).
Let cij be the weight of the edge between gene i under
condition j, (with value based on expression data stored in the matrix). As explained in the introduction, we focus on this paper on the evaluation of the optimisation methods. The weights are therefore considered as inputs, and are not part of the analysis. For a detailed description and evaluation of the distribution-based scheme used in our tests, we refer readers to the corresponding article [7]. In brief, a negative weight indicates an expression level for gene i under condition j that differs notably from the “average” expression observed for this gene across all conditions, as well as from what
genes
conditions
Fig. 1: A biclique with 3 genes and 2 conditions in a complete bipartite graph with 6 genes and 5 conditions
is observed for the majority of genes for condition j. This weighting scheme was shown to perform well on the main properties desirable for subsequent search algorithms, such as discrimination, reusability and robustness.
Let yi (respectively yj) be the boolean variable defining
whether gene i (resp. condition j) belongs to the biclique. Thus the product yiyj states whether the edge {i, j} is
con-sidered in the solution or not, and the biclustering problem is mathematically defined by Equation 1.
( M inimise P
i,j
cijyiyj
s.t. yi, yj∈ {0, 1} ∀i, j
(1) This formulation is quadratic since it involves products of variables xij = yiyj. We propose the following linearisation: • xij ≤ yi: an edge {i, j} can not be included in the
biclique if the gene i is not included.
• xij ≤ yj: an edge {i, j} can not be included in the
biclique if the condition j is not included.
• xij ≥ yi+ yj− 1: if a gene i and a condition j are
included in the biclique, then the edge {i, j} is also included.
• xij≥ 0.
The linearised version of the biclustering problem is therefore given by Equation 2.
M inimise P i,j cijxij
s.t. (linear description) ∀i, j yi, yj∈ {0, 1} ∀i, j
(2)
Since this problem is NP-hard, these formulations cannot be used as is for large microarrays: heuristics are required.
III. HEURISTICS A. Greedy heuristic
We propose a new search heuristic. Given a current solution s with k active conditions, the “Propagate” heuristic performs two moves:
1) the promotion, which considers all inactive conditions and finds the best one to include in the bicluster, to obtain a solution with k + 1 active conditions. 2) the demotion, which considers all active conditions
and finds the best one to remove from the bicluster, to obtain a solution with k − 1 active conditions.
p r m m m m
Fig. 2: Coarse-grained, stepping stone structure. Before a migration step, each subpopulation is sorted. Then, m so-lutions are selected those ranked below threshold r, and are sent clockwise. Similarly, m solutions are selected from those ranked above threshold p, and are sent anti-clockwise. Finally, new solutions are received: m good solutions arrive clockwise, and m poor solutions arrive anti-clockwise.
These two moves are used recursively, starting with the “empty” solution and the “complete” solution respectively. The recursion occurs every time an improving solution is found for its number of active conditions (k − 1 or k + 1). The heuristic returns the best bicluster it generated for each number of active conditions.
B. Genetic algorithm
Genetic algorithms are loosely based on mutations in nature and how these lead to biological evolution through survival of the fittest elements only [6]. They have been extensively used in the context of biological applications. For microarray biclustering in particular, there have also been some attempts at developing genetic algorithms (e.g. [3], [11]), but assessment of these implementations is limited.
The proposed architecture is coarse-grained parallelisation based on the stepping stone model [2]. For migrations, each subpopulation is sorted according to the total weight of the encoded bicluster, and two thresholds are used to define the “rich” and “poor” areas, (which contains the solutions with the lowest and highest total weights, respectively). A bidirectional ring is then used to send solutions selected from these two areas, as shown in Figure 2. Based on this parallel structure, the local genetic algorithm is developed, and detailed in what follows.
Encoding the solution
Given the objective function defined in Equation 2, a naive solution would be to use edge presence in the solution bicluster as a Boolean variable or, following Equation 1, to have an array encoding presence of both genes and conditions in the solution bicluster. Besides consuming a lot of memory, these encodings suffer from issues such as requirement for a “repair” function and a bias towards the modifications on the genes rather than the conditions. However, explicitly encoding genes is not necessary. Once a subset of conditions is chosen, interesting biclusters only involve genes for which the total weight over the selected conditions is negative. It is, therefore, possible to perform biclustering while explicitly encoding only a small part of
the bicluster. An interesting property is that any subset of conditions corresponds to a feasible solution. Thus, no repair function is needed.
Evolution operators
Evolution operators are used to introduce new solutions obtained through small variations of existing ones. We first use the mutation: a solution is randomly chosen, and one of its boolean variables is altered. The uniform mutation is also implemented: a solution s is randomly chosen and a random boolean array u of same length is created. A new solution is then obtained by keeping the value of a boolean variable s[i] when u[i] is equal to 1, and altering it otherwise.
The crossover operators work on two existing solutions. In our algorithm, one is selected a uniform probability an the other one must belong the best 10% solutions. Once the two solutions are chosen, a cutting point is selected in the solution array, using a uniform probability, and the solutions exchange the variables located after that point. A variant exists where two cutting points are chosen, and solutions exchange variables located between those two points.
Selection
A typical iteration of a genetic algorithm includes the cre-ation of new solutions, (i.e. the “expansion phase”), followed by the evaluation of population and selection of solutions that will be conserved for the next iteration, the remainder being eliminated, (i.e. the “selection phase”).
We propose a hybrid approach: the n/2 best solutions are conserved, while the others are involved in ‘tournaments” until we obtain a population of size 9n/10. Population is then restored to n by introducing new solutions. Each of these is obtained as follows: (i) for each condition j, we count kj, the number of times it appears in the N current
solutions; (ii) we generate random numbers rj, uniformly
in [0, N ]; (iii) condition j is included in the new solution if and only if rj > kj. In other words, the probability to
include condition j is inversely proportional to its current representation, and this improves the diversity in the overall population.
IV. EXPERIMENTAL EVALUATION
The approaches presented here are tested on the same datasets used for validation of the weighting scheme [7]. These include: (i) the Yeast Cell Cycle Data (YCC) dataset [21], which contains time-course expression profiles for more than 6000 genes, with 17 time points for each gene; (ii) a Lymphoma (L) dataset [9], which relates to an experiment to characterise gene expression in Diffuse Large B-cell lymphoma and contains expression levels for 4026 genes and 96 samples; (iii) a Gefitinib Treated Kasumi Cell Line (KCL) dataset [5], which includes 22283 genes and 10 samples.
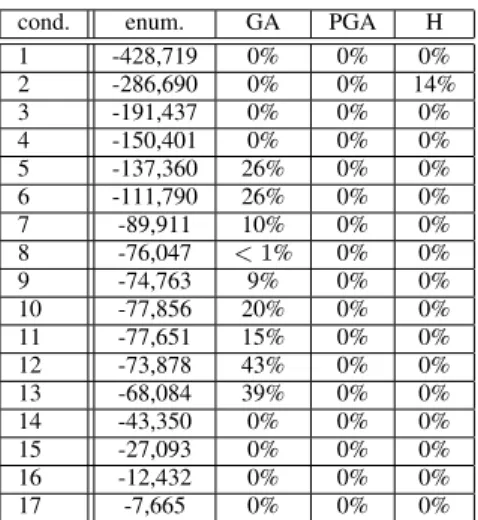
Evaluation is first done on the smaller datasets, KCL (m = 10 conditions) and YCC (m = 17 conditions), and looks at the results obtained from the enumeration method (enum), the genetic algorithm (both sequential (GA) and parallel (PGA)) and the Propagate heuristic (H). Results are not detailed for KCL: the dataset is small enough that all methods find the optimal solutions. Table I summarises
results for the YCC dataset: optimal values are reported for the enumeration method while the relative gap to the optimal value is given for the other methods.
Clearly, the parallel genetic algorithm and the heuristic method are performing well. They identify optimal solutions in all cases, with only one exception for the latter. To further highlight the superiority of the parallel genetic algorithm over its sequential counterpart, it is useful to look at the frequency at which the optimal solution is identified. On the YCC dataset, the latter finds each optimal solution in at least 10% of all runs, but less than half of them are always identified. The parallel implementation, with a similar computation time, finds the best solutions every time.
cond. enum. GA PGA H 1 -428,719 0% 0% 0% 2 -286,690 0% 0% 14% 3 -191,437 0% 0% 0% 4 -150,401 0% 0% 0% 5 -137,360 26% 0% 0% 6 -111,790 26% 0% 0% 7 -89,911 10% 0% 0% 8 -76,047 < 1% 0% 0% 9 -74,763 9% 0% 0% 10 -77,856 20% 0% 0% 11 -77,651 15% 0% 0% 12 -73,878 43% 0% 0% 13 -68,084 39% 0% 0% 14 -43,350 0% 0% 0% 15 -27,093 0% 0% 0% 16 -12,432 0% 0% 0% 17 -7,665 0% 0% 0%
TABLE I: Results on the YCC dataset. For each bicluster size (in number of conditions), we give the score of the optimal solution obtained by exact enumeration, and the gap between this score and the scores of the solutions obtained using the three methods (GA, PGA, H).
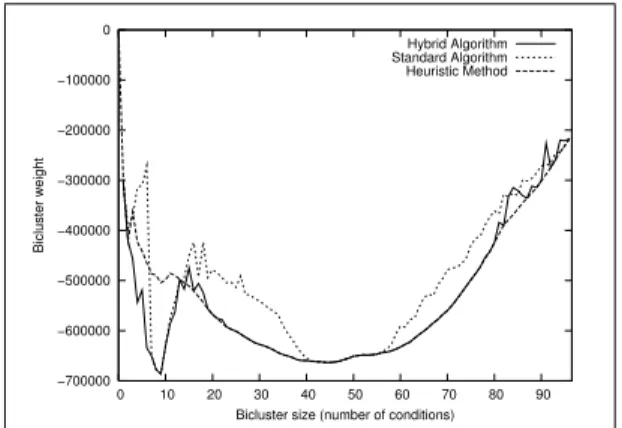
For the largest dataset (L with m = 96 conditions), the enumeration method cannot be applied anymore. Thus, the results from our methods cannot be compared to the optimal values. The parallel genetic algorithm has been shown to dominate the sequential version, and it is kept. We propose an improvement in which a local search based on add/drop moves is applied on some randomly selected solutions. It is called Hybrid algorithm. The solution profiles obtained with the parallel genetic algorithm (Standard Algorithm), our heuristic (Heuristic Method) and the hybrid algorithm (Hybrid Algorithm) are shown on Figure 3. A single run of the hybrid algorithm significantly outperforms the standard parallel genetic algorithm overall, and the heuristic method in a specific region (low bicluster sizes) and obtains results similar to that of this method elsewhere.
Interestingly, the profile obtained by the hybrid algorithm is largely conserved over multiple runs: 71 biclusters, (out of 96), are obtained at each run and 18 of the remaining 25 have a standard deviation smaller than 10% of the average solution obtained. The latter ones correspond to non-optimal low-energy solutions in which the algorithm gets “trapped”. Overall, these results suggest that most of the solutions
identified are optimal, or at least nearly-optimal, for their respective bicluster size.
−700000 −600000 −500000 −400000 −300000 −200000 −100000 0 0 10 20 30 40 50 60 70 80 90 Bicluster weight
Bicluster size (number of conditions) Hybrid Algorithm Standard Algorithm Heuristic Method
Fig. 3: Solution profile on the Lymphoma dataset.
V. CONCLUSION
In this article, we considered the problem of identify-ing meanidentify-ingful information from large microarray datasets. Given a robust weighting scheme proposed in [7], we mod-elled the problem as a biclustering problem for which we proposed a propagation heuristic and several variations of a genetic algorithm. The original version of the genetic algorithm is first parallelised, and later hybridised with a local search as an additional mutation operator.
The results obtained on three classic instances illustrate the effectiveness of our approaches. For a given weighting scheme, optimal solutions are identified, especially with the hybridised parallel genetic algorithm.
Additional experiments have shown results of the hybrid genetic algorithm are also robust, i.e. optimal solutions ap-pear in successive runs despite the method being stochastic. The biological significance of the solution depends on the weighting scheme, and is therefore outside the scope of this paper, but analysis of the clusters confirmed they contained genes involved in the same functions. The combination of the weighting scheme and the optimisation techniques performs as expected.
Future analysis may investigate the stability of the pro-posed methods, (e.g. verifying the robustness of the clusters with an hold-out schema). Future work may also include comparison with feature reduction methods, (either prior to, or combined with, clustering).
For the largest dataset, solutions are obtained in only five minutes using a standard cluster and the parallel approach with eight islands. The approach is therefore useful not only for microarray analysis but also for larger datasets, biological (e.g. next-generation sequencing) or otherwise. Provided meaningful weighting schemes can be designed, it may also be possible to extend the approach to problems involving multiple datatypes. Such integrative methods have for instance proved very useful in looking at data across species [19].
ACKNOWLEDGMENTS
The parallel implementations discussed in this paper were tested in-house on the cluster made available by the Centre for Scientific Computing & Complex Systems Modelling, Dublin City University.
Financial support from the Irish Research Council for Science, Engineering and Technology (IRCSET), co-funded by Marie Curie Actions under FP7, and subsequently from the RIKEN Foreign Postdoctoral Researcher Program, is warmly acknowledged (DP).
REFERENCES
[1] S. Busygin, G. Jacobsen, and E. Kramer. Double conjugated clustering applied to leukemia microarray data. In Proceedings of the 2nd SIAM International Conference on Data Mining, Workshop on Clustering High Dimensional Data, 2002.
[2] E. Cantu-Paz. A summary of research on parallel genetic algorithms. IlliGAL report 95007, University of Illinois (IL), 1995.
[3] A. Chakraborty and H. Maka. Biclustering of gene expression data using genetic algorithm. In Proceedings of the 2005 IEEE Symposium on Computational Intelligence in Bioinformatics and Computational Biology, 2005.
[4] Y. Cheng and G. M. Church. Biclustering of expression data. In Proceedings of the 8th International Conference on Intelligent Systems for Molecular Biology (ISMB 2000), volume 8, San Diego, California, USA, August 2000.
[5] Gefitinib Treated Kasumi Cell Line Dataset, MIT Broad Institute. http://www.broad.mit.edu/cgi-bin/cancer/datasets.cgi.
[6] J. H. Holland. Adaptation in natural and artificial systems. MIT Press, 1975.
[7] G. Kerr, D. Perrin, H. J. Ruskin, and M. Crane. Edge weighting of gene expression graphs. Advances in Complex Systems, 13(2), 2008. [8] J. Liu and W. Wang. OP-cluster: clustering by tendency in high
dimensional space. In Proceedings of the 3rd IEEE International Conference on Data Mining, pages 187–194, 2003.
[9] Lymphoma/Leukemia Molecular Profiling Project Gateway. http://llmpp.nih.gov/lymphoma/.
[10] S. C. Madeira and A. L. Oliveira. Biclustering algorithms for biologi-cal data analysis: a survey. IEEE/ACM Transactions on Computational Biology and Bioinformatics, 1(1):24–45, 2004.
[11] S. Mitra and H. Banka. Multi-objective evolutionary biclustering of gene expression data. Pattern Recognition, 39(2006):2464–2477, 2006. [12] R. Peeters. The maximum edge biclique problem is NP-complete.
Discrete Applied Mathematics, 131(3):651–654, 2003.
[13] S. Raychaudhuri, P. D. Sutphin, J. T. Chang, and R. B. Altman. Basic microarray analysis: grouping and feature reduction. Trends in Biotechnology, 19:189–193, 2001.
[14] D. K. Slonim. From patterns to pathways: gene expression data analysis comes of age. Nature Genetics, 32:502–508, 2002. [15] G. Stolovitzky. Gene selection in microarray data: the elephant, the
blind men and our algorithms. Current Opinion in Structural Biology, 13:370–376, 2003.
[16] A. Tanay, R. Sharan, and R. Shamir. Discovering statistically sig-nificant biclusters in gene expression data. Bioinformatics, 18(Suppl. 1):S136–S144, 2002.
[17] H. Turner, T. Bailey, and W. Krzanowski. Improved biclustering of microarray data demonstrated through systematic performance tests. Computational Statistics and Data Analysis, 48(2005):235–254, 2005. [18] F. Valafar. Pattern recognition techniques in microarray data analysis: A survey. Annals of the New-York Academy of Sciences, 980(1):41–64, 2002.
[19] P. Waltman, T. Kacmarczyk, A. R. Bate, D. B. Kearns, D. J. Reiss, P. Eichenberger, and R. Bonneau. Multi-species integrative bicluster-ing. Genome Biology, 11:R96, 2010.
[20] H. Wang, W. Wang, J. Yang, and P. S. Yu. Clustering by pattern similarity in large data sets. In Proceedings of the 2002 ACM SIGMOD International Conference on Management of Data, pages 394–405, 2002.
[21] Yeast Cell Cycle, available from R.W. Davis’ website at Stanford. http://genomics.stanford.edu/yeast cell cycle/cellcycle.html.

![[PDF] Support de cours CAO DAO : calcul et dessin assistes par ordinateur PDF - Cours Informatique](data:image/gif;base64,R0lGODlhAQABAIAAAP///wAAACH5BAEAAAAALAAAAAABAAEAAAICRAEAOw==)