Infrared Spectroscopy During Shoulder Arthroscopy in
the Beach Chair and Lateral Decubitus Positions
Glenn S. Murphy, MD,* Joseph W. Szokol, MD,* Jesse H. Marymont, MD,* Steven B. Greenberg, MD,*
Michael J. Avram, PhD,† Jeffery S. Vender, MD,* Jessica Vaughn, BA,* and Margarita Nisman, BA*
BACKGROUND: Patients undergoing shoulder surgery in the beach chair position (BCP) may be at risk for adverse neurologic events due to cerebral ischemia. In this investigation, we sought to determine the incidence of cerebral desaturation events (CDEs) during shoulder arthroscopy in the BCP or lateral decubitus position (LDP).
METHODS: Data were collected on 124 patients undergoing elective shoulder arthroscopy in the BCP (61 subjects) or LDP (63 subjects). Anesthetic management was standardized in all patients. Regional cerebral tissue oxygen saturation (SctO2) was quantified using near-infrared spectroscopy. Baseline heart rate, mean arterial blood pressure, arterial oxygen saturation, and SctO2were measured before patient positioning and then every 3 minutes for the duration of the surgical procedure. SctO2 values below a critical threshold (ⱖ20% decrease from baseline or absolute value ⱕ55% for ⬎15 seconds) were defined as a CDE and treated using a predetermined protocol. The number of CDEs and types of intervention used to treat low SctO2 values were recorded. The association between intraoperative CDEs and impaired postoperative recovery was also assessed.
RESULTS: Anesthetic management was similar in the BCP and LDP groups, with the exception of more interscalene blocks in the LDP group. Intraoperative hemodynamic variables did not differ between groups. SctO2values were lower in the BCP group throughout the intraoperative period (P ⬍ 0.0001). The incidence of CDEs was higher in the BCP group (80.3% vs 0% LDP group), as was the median number of CDEs per subject (4, range 0 –38 vs 0, range 0 – 0 LDP group, all P⬍ 0.0001). Among all study patients without interscalene blocks, a higher incidence of nausea (50.0% vs 6.7%, P⫽ 0.0001) and vomiting (27.3% vs 3.3%, P ⫽ 0.011) was observed in subjects with intraoperative CDEs compared with subjects without CDEs.
CONCLUSIONS: Shoulder surgery in the BCP is associated with significant reductions in cerebral oxygenation compared with values obtained in the LDP. (Anesth Analg 2010;X:●●●–●●●)
T
he beach chair position (BCP) has been used for shoulder arthroscopic procedures since the early 1980s. The advantages of the conventional BCP (45°–90° above the horizontal plane) include lack of bra-chial plexus strain, a reduced risk of direct neurovascular trauma compared with the lateral decubitus approach, excellent intraarticular visualization, and ease of conver-sion to an open approach if needed.1,2In the United States, approximately two-thirds of arthroscopic and open shoul-der procedures are performed with the patient in the sitting position.3
Although the safety of orthopedic surgery in this position has been well established,4
rare catastrophic neu-rologic events have been reported. Pohl and Cullen5
re-ported 4 cases of ischemic brain and spinal cord injury occurring after surgery in the BCP. In an additional report,
visual loss and ophthalmoplegia were described after shoulder surgery in a sitting position.6Eight intraoperative
cerebrovascular events were reported in a survey of the American Shoulder and Elbow Surgeons Society; all events occurred during surgery in the BCP.3
The etiology of central nervous system injury after shoul-der surgery in the BCP has not been established definitively. Several authors have hypothesized that cerebral ischemia may occur when anesthetized patients are placed in a 45° to 90° sitting position.5,7In awake volunteers, sympathetic
ner-vous system activation occurs when assuming a sitting posi-tion; systemic vascular resistance and heart rate (HR) are increased to maintain mean arterial blood pressure (MAP) and cardiac output.8 –10In anesthetized patients, however, the
response of the autonomic nervous system is attenuated by the vasodilating effects of IV and volatile anesthetics. Signifi-cant decreases in cardiac output, MAP, and cerebral perfusion pressure (CPP) have been observed in neurosurgical patients when position was changed from supine to sitting.11,12
Pro-longed reductions in systemic pressures and CPP that exceed critical thresholds (severity and time) may result in perma-nent neurologic injury.
Near-infrared spectroscopy (NIRS) is a noninvasive tech-nology that provides continuous monitoring of regional cere-bral tissue oxygen saturation (Scto2). NIRS technology allows
for the immediate recognition and treatment of cerebral desaturation events (CDEs) that would otherwise be undetec-ted with conventional intraoperative monitoring. NIRS has
From the *Department of Anesthesiology, NorthShore University Health-System, University of Chicago Pritzker School of Medicine, Evanston; and †Department of Anesthesiology, Northwestern University Feinberg School of Medicine, Chicago, Illinois.
Accepted for publication March 29, 2010.
Supported by institutional and/or departmental sources (Department of Anesthesiology, NorthShore University HealthSystem). FORE-SIGHT cere-bral oximetry probes were provided to the department at cost for the project by CAS Medical Systems, Inc., Branford, CT.
Address correspondence and reprint requests to Glenn S. Murphy, MD, Department of Anesthesiology, NorthShore University HealthSystem, Uni-versity of Chicago Pritzker School of Medicine, 2650 Ridge Ave., Evanston, IL 60201. Address e-mail to dgmurphy2@yahoo.com.
Copyright © 2010 International Anesthesia Research Society
been used to assess the incidence of CDEs in patients under-going procedures at high risk for adverse neurologic outcomes (cardiac, vascular, liver transplant, and major ab-dominal surgery).13
Although orthopedic patients in the BCP are at risk for cerebral hypoperfusion, no previous clinical trials have assessed changes in Scto2in this patient
popula-tion. The aim of this prospective cohort study was to deter-mine the incidence of CDEs in the BCP and compare this cohort to subjects undergoing shoulder surgery in the lateral decubitus position (LDP). In addition, the relationship be-tween CDEs and early clinical recovery was examined.
METHODS
Patients and Anesthesia
This study was approved by the IRB of NorthShore Uni-versity HealthSystem and written informed consent was obtained from all subjects. Seventy consecutive patients scheduled to undergo elective arthroscopic shoulder sur-gery under general anesthesia in the BCP were enrolled (BCP group). During this same time period, 70 additional consecutive patients presenting for the same surgical pro-cedure in the right or left LDP were enrolled (LDP group). Exclusion criteria included preexisting cerebrovascular disease or orthostatic hypotension; age ⬍18 years; ASA physical status IV or V; or anticipated procedure under interscalene blockade with monitored anesthesia care as the primary anesthetic. Allocation into the BCP and LDP groups was determined by surgical preference, and use of interscalene blocks in each group was also primarily influ-enced by surgeon preference. Anesthesia care was admin-istered to the BCP and LDP groups by the same group of providers (15 anesthesiologists).
Cerebral oximetry values may be affected by depth of anesthesia, type of anesthetic administered, arterial carbon dioxide concentrations, inspired oxygen content, and sys-temic blood pressure management.14 –16
Therefore, anes-thetic management was carefully standardized in subjects in both cohorts. Patients received midazolam 2 mg IV before being transported to the operating room. Intraopera-tive monitoring consisted of electrocardiography, auto-matic arterial blood pressure assessment using a cuff placed on the nonoperative upper extremity, pulse oxim-etry, capnography, bispectral index monitoring (BIS威 system; Aspect Medical Systems, Newton, MA), and mea-surement of core temperature via an esophageal probe. Anesthesia was induced with propofol 2.0 to 2.5 mg/kg, fentanyl 100g, lidocaine 50 mg, and rocuronium 0.6 to 0.8 mg/kg. Maintenance of anesthesia consisted of sevoflurane 1% to 3% in an oxygen/air mixture (fraction of inspired oxygen [Fio2] of 50%). Sevoflurane concentrations were
adjusted to maintain MAP within 20% of baseline values and BIS values between 40 and 60. In addition, patients received 1 to 2g 䡠 kg⫺1䡠 h⫺1fentanyl throughout the surgical proce-dure. If required, rocuronium (10-mg boluses) was adminis-tered to maintain a train-of-four count of 2 to 3. Ventilation was controlled to maintain end-tidal carbon dioxide (Etco2)
between 30 and 34 mm Hg. Lower body forced-air warming devices (Bair Hugger威; Augustine Medical, Minneapolis, MN) were used to maintain core temperature above 35.0°C. Ondansetron 4 mg was given to all patients within 30 minutes of tracheal extubation. Neostigmine 50
g/kg and glycopyrrolate 10 g/kg were administered at a train-of-four count of at least 2 to reverse neuromus-cular blockade at the conclusion of surgical closure.
Clinicians were instructed to maintain MAP within 20% of baseline values throughout the intraoperative period, as per standard practice involving surgery in the sitting position at our institution. Baseline MAP was determined in the sedated patient in the supine position. MAPs below this threshold were treated with phenylephrine (80 g), ephedrine (5 mg), or a fluid bolus, as required clinically. Patients undergoing surgery in the LDP were treated with the same MAP protocol.
Cerebral Oxygenation Measurements and
Perioperative Data Collection
Cerebral oxygen saturation was measured continuously using the FORE-SIGHT system (CAS Medical Systems, Inc., Branford, CT). The FORE-SIGHT device is a continuous wave, spatially resolved cerebral oximeter that uses 4 discrete wavelengths of laser light to calculate the absolute value of Scto2. Four wavelengths of light allow for more
accurate determination of oxyhemoglobin and deoxyhemo-globin levels by compensating for wavelength-dependent scattering losses and reducing interference from other background light absorbers.17,18Sensors were applied
bi-laterally to each frontotemporal area after cleansing the skin area with alcohol (the medial margin at the midline of the forehead [avoiding the temporalis muscle] and the lower margin 1–1.5 cm above the eyebrow). The cerebral oximetry and BIS probes were secured in the preoperative holding area and covered with an opaque wrapping to prevent light interference.
On arrival to the operating room, MAP and HR were recorded. Simultaneously, arterial oxygen saturation (Spo2)
and Scto2values were measured in patients before
induc-tion of anesthesia while breathing a 50% air/oxygen mix-ture. These variables (Scto2, MAP, HR, and Spo2) were then
manually recorded by a research assistant every 3 minutes for the duration of the operative procedure. Intraoperative Scto2 data were also collected continuously on a USB
device. Baseline Scto2was the mean value observed over a
1-minute period after induction of anesthesia during a stable interval (MAP within 20% baseline values, BIS 40 – 60, Etco230 –34 mm Hg, and Fio250%) approximately
10 minutes after induction of anesthesia. Baseline measures for MAP, HR, Spo2, and BIS used in the analysis were also
recorded at this time. Five minutes after these initial data were collected, the patient was positioned for the surgical procedure. In the BCP group, the head was secured in a neutral position to ensure that cerebral venous drainage was not impaired. The back of the operating room table was then raised to 80° to 90° above the horizontal plane. In the LDP group, patients were placed in the LDP with the head supported with towels to maintained alignment with the thoracolumbar spine. The NIRS monitor was positioned so that Scto2data could be viewed by the research assistant
but not by clinicians providing intraoperative care. If any Scto2values below a previously defined critical threshold
(ⱖ20% decrease from baseline or absolute value ⱕ55% for ⬎15 seconds) were observed by the research assistant,
was used to increase Scto2 values. Interventions to treat
CDEs included the following: (1) increasing MAP with phenylephrine (80g), ephedrine (5 mg), or a fluid bolus, as clinically indicated; (2) increasing Etco2 by decreasing
ventilation; or (3) increasing Fio2concentrations. The
num-ber and type of interventions used to treat low Scto2values
were recorded by the research assistant. In addition, inter-ventions used by clinicians to treat MAP reductions unre-lated to Scto2 were noted. All data were collected until
tracheal extubation.
After discontinuation of sevoflurane at the end of the surgical procedure, the time required to achieve the following end points were recorded: open eyes on verbal command; squeeze hand on verbal command; tracheal extubation; and admission to postanesthesia care unit (PACU). The Aldrete score was recorded on arrival to the PACU and then assessed every 15 minutes until discharge. Hydromorphone was used for postoperative analgesia and titrated to achieve pain scores of⬍2 on a scale of 0 to 10 (0 ⫽ no pain, 10 ⫽ worst pain imaginable). Any episodes of nausea and vomiting during the PACU admission were noted, and the severity of events graded on a 3-point scale (1⫽ mild, 1 episode; 2 ⫽ moderate, 2–3 episodes; and 3 ⫽ severe, ⬎3 episodes). The need for rescue antiemetics was also assessed. The times needed to meet discharge criteria and achieve actual discharge were noted. All recovery data were collected by PACU nurses blinded to intraoperative cerebral oximetry information. However, PACU nurses and research assistants were not blinded to patient positioning.
Patient demographic data that were recorded included age, sex, height, weight, preoperative hemoglobin, ASA physical status, and preexisting medical conditions. Details of the intraoperative anesthetic management included du-ration of anesthesia, administdu-ration of crystalloids, doses of opioids and rocuronium provided intraoperatively, and core temperatures at the conclusion of the anesthetic.
Statistical Analysis
Sample size was determined based on the primary outcome variable, the incidence of CDEs. Scto2 values below a
predetermined critical threshold (ⱖ20% decrease from baseline or absolute value ⱕ55% for ⬎15 seconds) were used to define these events. In a pilot study of patients undergoing surgery in the BCP, CDEs were observed in 50% of the subjects. We hypothesized that we would observe 50% fewer CDEs in patients having surgery in the LDP. Group sample sizes of 66 in each group achieve 80% power to detect a difference of 0.25 between the null hypothesis that both group proportions are 0.50 and the alternative hypothesis that the proportion of the LDP group is 0.25 with a 2-tailed significance level (␣) of 0.05 using 2
or Fisher exact test with continuity correction.
Discrete data were compared using Fisher exact test (NCSS, Kaysville, UT). The 95% confidence intervals for the differences in percentages were calculated using the Far-rington and Manning score. Ordinal data and continuous data that were not normally distributed are presented as median and range. These data were compared between groups using the Mann-Whitney U test and within groups
intervals were calculated.
Normally distributed continuous data are presented as mean and SD. These data were compared using the un-paired t test (NCSS), except for the hemodynamic data. Mean differences and their 95% confidence intervals were calculated. Hemodynamic, Spo2, BIS, and Scto2data were
compared within and between groups using a 2-factor analysis of variance with repeated measures on 1 factor, with the Holm-Sidak method for pairwise multiple com-parisons in post hoc analysis (SigmaPlot 11.0; Systat Soft-ware, Inc., San Jose, CA).
Multiple logistic regression analysis (StatsDirect) was performed to determine predictors of nausea. Variables included in the initial analysis were those identified in univariate analyses as having a value of P ⬍ 0.10. In the final analyses, variables with high P values were removed from the model 1 at a time and were excluded from the final model if their removal either did not diminish the fit of the model or actually improved it, as determined by the correct prediction of both positive and reference responses. The sensitivity and specificity of the logistic model were calculated from the predicted reference and model-predicted positive responses (using the default threshold probability for positive classification of 0.5) and the actual reference and actual positive responses. No external vali-dation was attempted.
The criterion for rejection of the null hypothesis estab-lished a priori was a 2-tailed P⬍ 0.05.
RESULTS
One hundred forty patients were enrolled in this clinical trial. Sixteen subjects were excluded from final analysis because of the following factors: changes in patient positioning (45° beach chair) (4 in BCP group); protocol violations (3 in BCP group and 3 in LDP group); incomplete data collection (2 in BCP group and 3 in LDP group); and procedure canceled before entering the operating room (1 in LDP group). As a result, data analysis was performed on 61 patients in the BCP group and 63 patients in the LDP group. The BCP and LDP groups were similar in terms of demographic characteristics. There were no differences between groups in age, weight, height, sex, preoperative hemoglobin values, preexisting medical conditions, or ASA physical status (Table 1). Intraop-erative management data are presented in Table 2. The duration of anesthesia was longer in the LDP group. A higher percentage of patients in the LDP group received interscalene blocks (71.4%) compared with the BCP group (8.2%, P ⬍ 0.0001) and a lower dose of intraoperative fentanyl was used in the LDP group (P⬍ 0.0001).
Hemodynamic data are presented in Figures 1 and 2. The ANOVA statistics revealed that whereas HR and MAP decreased in both the LDP and BCP groups after induction of anesthesia, intraoperative HR and MAP values did not differ between groups. No differences between groups were noted in Spo2(Fig. 3), end-tidal sevoflurane
concen-tration (Fig. 4), or BIS (Fig. 5) data throughout the intraop-erative period.
Scto2data are presented in Figure 6 and Table 3. Scto2
80.4 ⫾ 5.0 vs 81.1 ⫾ 5.1) induction of anesthesia were similar between the LDP and BCP groups. The ANOVA statistics revealed that Scto2not only decreased over time
but also was lower in the BCP group than the LDP group
across time (P⬍ 0.0001). The percentage of patients devel-oping a CDE was higher in the BCP group (80.3%) com-pared with the LDP group (0%, P⬍ 0.0001). In addition, the median number of CDEs was greater in the BCP group:
Table 1. Patient Characteristics
Beach chair group Lateral group Difference (95% CI) P value
No. of patients 61 63 — —
Sex (male/female) 38 (62.3%)/23 (37.7%) 40 (63.5%)/23 (36.5%) ⫺1.2% (⫺18.0% to 15.6%) 1.000
Age (y) 49.8⫾ 13.9 47.8⫾ 14.8 1.9 (⫺3.2 to 7.1) 0.453
Weight (kg) 81.5⫾ 20.0 85.3⫾ 17.9 ⫺3.8 (⫺10.5 to 3.0) 0.268
Height (cm) 170.1⫾ 9.8 173.3⫾ 11.0 ⫺3.1 (⫺6.8 to 0.6) 0.096
ASA physical status II (I–III) II (I–III) 0 (0–0) 0.533
Hemoglobin (g/dL) 14.0⫾ 1.5a 13.9⫾ 1.4b 0.1 (⫺0.5 to 0.6) 0.796 Previous MI 2 (3.3%) 1 (1.6%) 1.7% (⫺5.5% to 9.8%) 0.616 Arrhythmias 1 (1.6%) 3 (4.8%) ⫺3.1% (⫺11.7% to 4.5%) 0.619 Hypertension 26 (42.6%) 23 (36.5%) 6.1% (⫺11.0% to 22.9%) 0.582 COPD/emphysema 0 (0%) 1 (1.6%) ⫺1.6% (⫺8.5% to 4.4%) 1.000 Asthma 9 (14.8%) 6 (9.5%) 5.2% (⫺6.7% to 17.6%) 0.419 Sleep apnea 5 (8.2%) 4 (6.4%) 1.9% (⫺8.2% to 12.4%) 0.742 Thyroid disease 3 (4.9%) 5 (7.9%) ⫺3.0% (⫺13.1% to 6.6%) 0.718 Diabetes Insulin-dependent 0 (0%) 0 (0%) — — Noninsulin-dependent 3 (4.9%) 6 (9.5%) ⫺4.6% (⫺15.1% to 5.3%) 0.492 CVA 0 (0%) 0 (0%) — — TIA 0 (0%) 0 (0%) — — Smoking history 7 (11.5%) 8 (12.7%) ⫺1.2% (⫺13.3% to 10.9%) 1.000 Drinking history 4 (6.6%) 8 (12.7%) ⫺6.1% (⫺17.5% to 4.8%) 0.364
CI⫽ confidence interval; MI ⫽ myocardial infarction; COPD ⫽ chronic obstructive pulmonary disease; CVA ⫽ cerebrovascular accident; TIA ⫽ transient ischemic attack.
Data are mean⫾ SD, median (range), or number of patients (%).
an⫽ 60. bn⫽ 52.
Table 2. Perioperative Variables
Beach chair group Lateral group Difference (95% CI) P value
No. of patients 61 63 — —
Interscalene block 5 (8.2%) 45 (71.4%) ⫺63.2% (⫺74.6% to ⫺48.5%) ⬍0.0001
Intraoperative
Total time (min) 117⫾ 31 135⫾ 46 ⫺18.0 (⫺32 to 4) 0.011
Dose fentanyl (g) 200 (50–500) 100 (0–325) 50 (25–100) ⬍0.0001
Dose rocuronium (mg) 50 (30–140) 50 (30–155) 0 (0–10) 0.054
Crystalloid (L) 1.11⫾ 0.39 1.20⫾ 0.38 ⫺0.09 (⫺0.23 to 0.05) 0.201
Final OR temperature (°C) 35.9⫾ 0.6 36.1⫾ 0.6 ⫺0.1 (⫺0.4 to 0.1) 0.224
Times to recovery landmarks (min)
Open eyes 8 (1–25) 8 (2–16) 0 (⫺1 to 1) 0.896 Squeeze hands 8 (1–26) 8 (2–22) 1 (0–3) 0.088 Tracheal extubation 10 (2–36) 9 (0–24) 0 (⫺1 to 2) 0.576 Arrive PACU 17 (5–35) 13 (5–28) 3 (1–5) ⬍0.001 PACU Aldrete scores Arrival 8 (2–10) 8 (2–10)a ⫺1 (⫺1 to 0) ⬍0.001 30 min 9 (7–10) 9 (2–10)a 0 (⫺1 to 0) 0.050 60 min 9 (8–10)b 10 (8–10)c 0 (0–0) 0.475 90 min 10 (8–10)d 10 (8–10)e 0 (0–1) 0.494 Discharge 9 (8–10)f 10 (9–10)g ⫺1 (⫺1 to 0) 0.378 Nausea 24 (39.3%) 5 (8.1%)a 31.3% (17.1%–45.1%) ⬍0.0001
Nausea severity (1–3 scale) 1.5 (1–3)h 1 (1–2)i 0 (0–1) 0.970
Vomiting 13 (21.3%) 1 (1.6%)a
19.7% (9.8%–31.8%) ⬍0.001
Vomiting severity (1–3 scale) 1 (1–2)j 1k —
Pain medication 52 (85.3%) 33 (52.4%)a
32.9% (17.0%–47.3%) 0.0001
Pain medication dose (mg hydromorphone) 1.5 (0.5–4)l 1 (0.5–4.0)m 0 (0–0.5) 0.374
PACU discharge (min)
Criteria met 80 (35–193) 83.5 (39–145)a ⫺1 (⫺13 to 10) 0.830
Actual discharge 93 (45–298) 94 (55–181)a
2 (⫺10 to 12) 0.765
CI⫽ confidence interval; OR ⫽ operating room; PACU ⫽ postanesthesia care unit. Data are mean⫾ SD, median (range), or number of patients (%).
an⫽ 62,bn⫽ 58,cn⫽ 57,dn⫽ 18,en⫽ 27,fn⫽ 9,gn⫽ 4,hn⫽ 24,in⫽ 5,jn⫽ 13,kn⫽ 1,ln⫽ 52,mn⫽ 33.
ⱖ20% decreases in Scto2 from baseline (4 [0 –38] BCP; 0
[0 – 0] LDP; P ⬍ 0.0001) and Scto2ⱕ55% (0 [0–4] BCP; 0
[0 – 0] LDP; P⫽ 0.003). Furthermore, the median number of interventions required to treat CDEs was also greater in the BCP group (2 [0 –11] BCP; 0 [0 – 0] LDP; P⬍ 0.0001). Scto2
values increased after initial treatment interventions in 61% of patients, with most responses occurring within 30 to 45 seconds. Eight patients had 12 episodes of Scto2ⱕ55% (all
in the BCP group). Nine of the episodes resolved within 1 minute of treatment. The duration of the episodes ranged from 30 seconds to 9 minutes.
Recovery data are presented in Table 2. Lower doses of opioids were used in the LDP group in the operating room
and PACU, which was likely attributable to the higher use of interscalene blocks in this group. The incidence of nausea and vomiting was also lower in this group. The time from the end of the procedure to PACU admission was shorter, and early Aldrete scores were higher, in the LDP group. All other immediate and early recovery variables were similar between groups.
Further analysis was performed to determine the impact of intraoperative CDEs on postoperative recovery (Tables 4 and 5). Data were analyzed only on subjects who did not receive interscalene blocks because use of this technique was not equally distributed between the BCP and LDP groups and interscalene blocks can beneficially influence recovery from anesthesia. Patient characteristics did not differ between subjects with and without CDEs. Perioper-ative management variables, including opioid dosing in the
presented as mean⫾ SD. The horizontal line indicates the time during which the heart rates in the patients of the 2 groups differed from their baseline heart rates (9 –90 minutes, overall P⬍ 0.05). There were no differences between the groups at any time. The number of patients in the beach chair position group decreased from 61 at baseline to 60 at 45 minutes and then progressively over time to 50 at 1 hour and to 20 at 90 minutes, whereas the number of patients in the lateral decubitus position group decreased from 63 at baseline to 61 at 48 minutes and then progressively over time to 54 at 1 hour and to 40 at 90 minutes.
Figure 2. Mean arterial pressure (mm Hg) for the patients in the beach chair position group and in the lateral decubitus position group. The data are presented as mean⫾ SD. The horizontal line indicates the time during which the blood pressures in the patients of the 2 groups differed from their baseline blood pressures (6 –90 minutes, overall P⬍ 0.05). There were no differences between the groups at any time. The number of patients in the beach chair position group decreased from 61 at baseline to 60 at 45 minutes and then progressively over time to 51 at 1 hour and to 20 at 90 minutes, whereas the number of patients in the lateral decubitus position group decreased from 63 at baseline to 61 at 48 minutes and then progressively over time to 54 at 1 hour and to 40 at 90 minutes.
group. The data are presented as mean ⫾ SD. There were no differences between the groups at any time. The number of patients in the beach chair position group decreased from 61 at baseline to 60 at 45 minutes and then progressively over time to 51 at 1 hour and to 20 at 90 minutes, whereas the number of patients in the lateral decubitus position group decreased from 63 at baseline to 61 at 48 minutes and then progressively over time to 54 at 1 hour and to 40 at 90 minutes.
Figure 4. End-tidal sevoflurane concentrations for the patients in the beach chair position group and in the lateral decubitus position group. The data are presented as mean ⫾ SD. There were no differences between the groups at any time. The number of patients in the beach chair position group decreased from 61 at 15 minutes to 60 at 45 minutes, to 58 at 60 minutes, to 45 at 75 minutes, and to 25 at 90 minutes, whereas the number of patients in the lateral decubitus position group decreased from 63 at 15 minutes to 58 at 45 minutes, to 55 at 60 minutes, to 49 at 75 minutes, and to 43 at 90 minutes.
operating room and PACU, also did not differ between groups. A significantly higher incidence of nausea (50.0% vs 6.7%, P ⫽ 0.0001) and vomiting (27.3% vs 3.3%, P ⫽ 0.011) was observed in subjects with intraoperative CDEs compared with subjects with no CDE. All other recovery landmarks (with the exception of Aldrete scores on PACU admission) did not differ between groups.
To determine whether confounding variables may be contributing to the nausea, age, sex, smoking status, hemo-globin concentration, operative position, fentanyl dose, end-tidal sevoflurane concentration, and the occurrence of cerebral desaturation were compared between patients who had not had regional anesthesia and did not become nauseated and patients who had not had regional anesthe-sia but did become nauseated. Variables identified in the univariate analyses as having a value of P ⬍ 0.10 and included in the initial multiple logistic regression analysis as predictors of nausea were hemoglobin concentration, operative position, and the occurrence of cerebral desatu-ration. The only variable included in the final multiple logistic regression model as a predictor of nausea was the occurrence of cerebral desaturation (logit P ⫽ ⫺2.639 ⫹ 2.639⫻ [0 ⫽ no desaturation, 1 ⫽ desaturation]; likelihood ratio test statistic ⫽ 17.56, df ⫽ 1, P ⬍ 0.0001). The sensitivity of the logistic model was 91.7%, whereas its specificity was 56.0%.
DISCUSSION
Patients undergoing shoulder surgery in the BCP may be at risk for cerebral hypoxia because of decreases in CPP. NIRS technology, which provides information on the balance between oxygen supply and demand in the frontal region of the brain, has not been used previously to determine changes in Scto2 in this patient population. Our results
indicate that CDEs, defined as a ⱖ20% decrease in Scto2
values from baseline measurements or an Scto2 value of
ⱕ55%, occurred frequently in patients having arthroscopic surgery in the BCP. Despite the use of a protocol designed to optimize CPP, CDEs were observed in 80.3% of subjects. In contrast, no CDEs were noted in a similar cohort of patients undergoing shoulder arthroscopy in the LDP. An association between intraoperative CDEs and postopera-tive nausea and vomiting was also observed.
Alterations in systemic hemodynamics occur when pos-tural conditions are changed from supine to sitting. Reduc-tions in cardiac output, MAP, and CPP may subsequently compromise cerebral oxygen delivery. In awake volunteers, assumption of a head-up posture results in a 10% to 15% increase in HR, a 5- to 10-second decrease in MAP and
Figure 5. Bispectral index (BIS) for the patients in the beach chair position group and in the lateral decubitus position group. The data are presented as mean⫾ SD. There were no differences between the groups at any time. The number of patients in the beach chair position group increased from 57 at baseline to 59 at 6 minutes, then decreased to 58 at 45 minutes after which it decreased progressively over time to 49 at 1 hour and to 18 at 90 minutes, whereas the number of patients in the lateral decubitus position group decreased from 63 at baseline to 61 at 48 minutes and then progressively over time to 54 at 1 hour and to 40 at 90 minutes.
Figure 6. Regional cerebral tissue oxygen saturation (SctO2) for the
patients in the beach chair position group and in the lateral decubitus position group. The data are presented as mean⫾ SD. The solid horizontal line indicates the time during which the SctO2
values in the patients of the beach chair position group differed from their baseline SctO2values (3– 0 minutes, overall P⬍ 0.05) whereas
the dotted horizontal line indicates the time during which the SctO2
values in the patients of the lateral decubitus position group differed from their baseline SctO2values (12– 0 minutes, overall P⬍ 0.05).
The dashed horizontal line indicates the times during which the SctO2
values in the patients of the beach chair position group differed from those in the lateral decubitus position group (3–90 minutes, overall
P⬍ 0.05). The number of patients in the beach chair position group
decreased from 61 at baseline to 60 at 45 minutes and then progressively over time to 51 at 1 hour and to 20 at 90 minutes, whereas the number of patients in the lateral decubitus position group decreased from 63 at baseline to 61 at 48 minutes and then progressively over time to 54 at 1 hour and to 40 at 90 minutes.
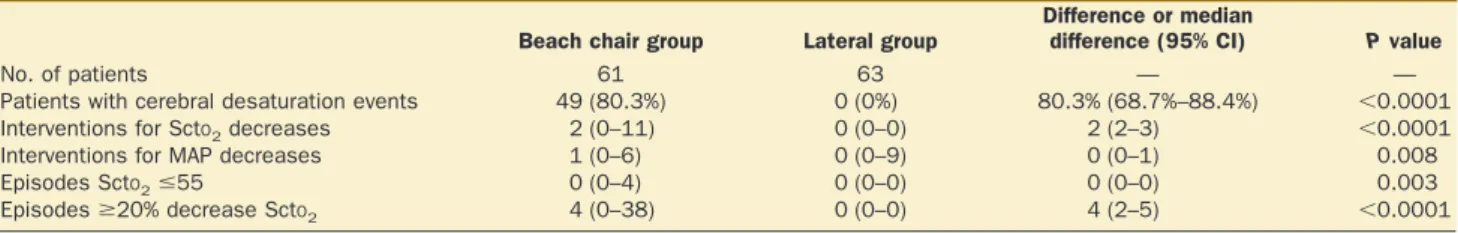
Table 3. Primary Outcome Variables
Beach chair group Lateral group
Difference or median
difference (95% CI) P value
No. of patients 61 63 — —
Patients with cerebral desaturation events 49 (80.3%) 0 (0%) 80.3% (68.7%–88.4%) ⬍0.0001
Interventions for SctO2decreases 2 (0–11) 0 (0–0) 2 (2–3) ⬍0.0001
Interventions for MAP decreases 1 (0–6) 0 (0–9) 0 (0–1) 0.008
Episodes SctO2ⱕ55 0 (0–4) 0 (0–0) 0 (0–0) 0.003
Episodesⱖ20% decrease SctO2 4 (0–38) 0 (0–0) 4 (2–5) ⬍0.0001
CI⫽ confidence interval; SctO2⫽ regional cerebral tissue oxygen saturation; MAP ⫽ mean arterial blood pressure.
Data are number of patients (%) or median (range).
desaturation events group desaturation events group Difference (95% CI) P value No. of patients 30 44 — — Sex (male/female) 18 (60.0%)/12 (40.0%) 28 (63.6%)/16 (36.4%) ⫺3.6% (⫺25.9% to 18.2%) 0.810 Age (y) 50.5⫾ 12.4 48.8⫾ 14.7 1.7 (⫺4.8 to 8.2) 0.601 Weight (kg) 85.4⫾ 20.8 81.5⫾ 20.4 3.9 (⫺5.8 to 13.6) 0.426 Height (cm) 172.9⫾ 9.7 170.5⫾ 10.5 2.4 (⫺2.4 to 7.2) 0.320
ASA physical status 2 (1–3) 2 (1–3) 0 (0–1) 0.066
Hemoglobin (g/dL) 13.8⫾ 1.4a 13.8⫾ 1.6b ⫺0.1 (⫺0.8 to 0.7) 0.847 Previous MI 2 (6.7%) 0 (0%) 6.7% (⫺1.7% to 21.3%) 0.161 Arrhythmias 1 (3.3%) 1 (2.3%) 1.1% (⫺8.9% to 14.6%) 1.000 Hypertension 11 (36.7%) 18 (40.9%) ⫺4.2% (⫺25.7% to 18.4%) 0.810 COPD/emphysema 1 (3.3%) 0 (0%) 3.3% (⫺4.9% to 16.7%) 0.405 Asthma 5 (16.7%) 6 (13.6%) 3.0% (⫺13.3% to 21.8%) 0.749 Sleep apnea 4 (13.3%) 4 (9.1%) 4.2% (⫺10.4% to 21.8%) 0.707 Thyroid disease 0 (0%) 3 (6.8%) ⫺6.8% (⫺18.2% to 4.9%) 0.267 Diabetes Insulin-dependent 0 (0%) 0 (0%) — — Noninsulin-dependent 2 (6.7%) 3 (6.8%) ⫺0.2% (⫺12.8% to 15.3%) 1.000 CVA 0 (0%) 0 (0%) —- — TIA 0 (0%) 0 (0%) — — Smoking history 4 (13.3%) 2 (4.6%) 8.8% (⫺4.3% to 25.8%) 0.215 Drinking history 5 (16.7%) 2 (4.6%) 12.1% (⫺1.6% to 29.7%) 0.112
CI⫽ confidence interval; MI ⫽ myocardial infarction; COPD ⫽ chronic obstructive pulmonary disease; CVA ⫽ cerebrovascular accident; TIA ⫽ transient ischemic attack.
Data are mean⫾ SD, median (range), or number of patients (%).
an⫽ 29. bn⫽ 43.
Table 5. Perioperative Variables
No interscalene block, no cerebral desaturation
events group
No interscalene block, cerebral desaturation
events group Difference (95% CI) P value
No. of patients 30 44 — —
Lateral position 18 (60.0%) 0 (0%) 60.0% (74.1%–90.6%) ⬍0.0001
Intraoperative
Total time (min) 130⫾ 44 120⫾ 32 10 (⫺7.8 to 27.4) 0.300
Dose fentanyl (g) 200 (200–325) 200 (100–500) 0 (⫺50 to 25) 0.717
Dose rocuronium (mg) 50 (30–100) 50 (30–140) 0 (⫺10 to 0) 0.544
Crystalloid (L) 1.25⫾ 0.46 1.13⫾ 0.41 0.13 (⫺0.07 to 0.33) 0.212
Final OR temperature (°C) 35.8⫾ 0.7 36.0⫾ 0.6 ⫺0.2 (⫺0.5 to 0.1) 0.139
Times to recovery landmarks (min)
Open eyes 7 (2–16) 8 (1–25) 0 (⫺2 to 1) 0.275 Squeeze hands 7 (2–22) 9 (1–26) ⫺1 (⫺2 to 1) 0.201 Tracheal extubation 9 (4–24) 10 (2–36) ⫺1 (⫺3 to 1) 0.114 Arrive PACU 16 (8–35) 18 (5–35) ⫺2 (⫺4 to 1) 0.09 PACU Aldrete scores Arrival 8 (7–10) 8 (2–10) 0 (0–1) 0.041 30 min 9 (8–10) 9 (7–10) 0 (0–1) 0.054 60 min 10 (8–10)a 9 (8–10)b 0 (0–1) 0.242 90 min 9 (9–10)c 10 (8–10)d 0 (⫺1 to 0) 0.609 Discharge 9.5 (9–10)e 9 (8–10)f 0.5 (0–1) 0.495 Nausea 2 (6.7%) 22 (50.0%) ⫺43.3% (⫺59.1% to ⫺24.0%) 0.0001
Nausea severity (1–3 scale) 1g 1.5 (1–3)h — —
Vomiting 1 (3.3%) 12 (27.3%) ⫺23.9% (⫺39.3% to ⫺7.8%) 0.011
Vomiting severity (1–3 scale) 1i 1 (1–2)j — —
Pain medication 28 (93.3%) 39 (88.6%) 4.7% (⫺11.3% to 18.6%) 0.694
Pain medication dose (mg hydromorphone)
1.5 (0.5–4.0)k 1.5 (0.5–4.0)l 0 (0–0.5) 0.299
PACU discharge (min)
Criteria met 88 (45–145) 86.5 (35–193) 2.5 (⫺12 to 17) 0.704
Actual discharge 114 (65–180) 99.5 (50–298) 2.5 (⫺12 to 22) 0.700
CI⫽ confidence interval; OR ⫽ operating room; PACU ⫽ postanesthesia care unit. Data are mean⫾ SD, median (range), or number of patients (%).
systemic vascular resistance followed by a rapid rebound and overshoot (15%– 40%), and a sustained reduction in thoracic blood volume and cardiac output (15%–30%).8 –10
Compensatory increases in sympathetic nervous system activation and systemic vascular resistance to maintain systemic perfusion pressures are attenuated under general anesthesia. Raising anesthetized neurosurgical patients from the supine to the sitting position resulted in signifi-cant reductions in cardiac output, MAP, and CPP, which persisted for up to 30 minutes after positioning.11,12
The influence of alterations in positioning on cerebral oxygenation in anesthetized surgical patients has been examined in only 1 previous trial. In these 12 subjects, no changes in Scto2 values were observed in the LDP, but a
small (6%), statistically significant decrease in Scto2
oc-curred after assuming the sitting position.19
However, cerebral oximetry data were only collected for 5 minutes after each change in position. In the present investigation, clinically significant reductions in Scto2values were absent
when position was altered from supine to right or left lateral decubitus; Scto2 remained near baseline measures
throughout the operative procedure. No episodes of CDEs were recorded in any of the 63 LDP subjects, and no interventions to treat low Scto2were required. In contrast,
pronounced reductions in Scto2were observed in the BCP
group. Scto2 decreased from a baseline mean of 80% to
mean values of ⬍70% by 9 minutes, and the mean re-mained between 66% and 70% throughout the operative procedure. The median number of CDEs was significantly higher in the BCP group, despite the use of a similar protocol to maintain MAP. In addition, more interventions to treat reductions in Scto2were required in the BCP group.
These findings suggest that CDEs (as defined in this investigation) occur frequently during sitting position sur-gery and that cerebral oxygenation in the frontal cortices may potentially be compromised in these patients under-going general anesthesia.
Hemodynamic and systemic oxygenation variables (HR, MAP, Spo2) were not different between the BCP and LDP
groups throughout the intraoperative period. HR and MAP decreased from initial values in both groups over time, but were within 20% of baseline measures. MAP is a primary determinant of CPP and oxygenation, and reductions in MAP are associated with comparable decreases in Scto2.
15,20
MAP values, measured at the brachial artery, did not differ between the 2 groups of patients. It is possible, however, that MAP measured at the brachial artery may overestimate the actual pressure at the level of the brain when the sitting position is assumed. According to the “open model” or “waterfall” theory, as blood flows verti-cally from the heart, there is a reduction in arterial pressure directly related to the weight of the column of blood.5,21
When the sitting position is used, an arithmetic correction of MAPs obtained from other sites is required to determine blood pressure at the level of the brain (1 mm Hg for each 1.35 cm).5,21
If the average vertical distance between the brachial artery measurement site and cerebral oximeter probe was 38 cm (measured in 10 sitting patients), and the average MAP intraoperatively was 80 mm Hg, a “cor-rected” MAP value of 51.8 mm Hg at the level of the frontal
cortex is derived. This “corrected” pressure might repre-sent an inadequate CPP in some subjects. Although the lower limit of cerebral autoregulation is generally accepted to be a MAP of approximately 50 mm Hg, some studies have demonstrated that this lower threshold may be as high as 70 to 80 mm Hg in awake, normotensive subjects.22
Consequently, if the “waterfall” theory is correct, mainte-nance of a MAP of 80 mm Hg using a manual blood pressure cuff might have represented suboptimal blood pressure management and accounted for the lower Scto2
values in the BCP group.
Despite the frequent occurrence of CDEs in patients undergoing surgery in the sitting position, no obvious neurologic deficits were observed in this study cohort. This finding is not unexpected because major adverse cerebro-vascular events after orthopedic procedures in the BCP have been rarely described in the literature. Only 13 cases of stroke, coma, or blindness have been reported in this patient population.3,5,6
At the present time, the incidence of permanent neurologic events after BCP surgery has not been assessed in a prospective or retrospective investiga-tion. However, a survey of the membership of the Ameri-can Shoulder and Elbow Surgeons yielded an estimated rate of stroke of 0.00382% to 0.00461% during shoulder surgery, with all events occurring in the BCP.3
The low incidence of adverse neurologic outcomes is likely related to the relatively limited duration of the surgical procedure. Severity and duration of ischemia are critical determinants of tissue damage, and viability-time thresholds must be exceeded to produce stroke. In a pig model, low Scto2
values that persisted for⬍2 hours did not result in neuro-logic injury.23An analysis of NIRS data from 265 coronary
artery bypass graft patients revealed a desaturation-time threshold of 50 minutes that was associated with cognitive decline and longer hospital length of stay.24
In the present investigation, the duration of CDEs was limited, with no CDEs exceeding previously defined viability-time thresh-olds. However, the degree and duration of cerebral isch-emia required to produce overt neurologic symptoms in a relatively healthy patient population is unknown at the present time. The use of a protocol designed to detect, treat, and reduce the duration of CDEs (as used in this study) would likely minimize the risk of obvious neurologic deficits.
A number of recovery variables were assessed in the PACU to determine whether CDEs in the operating room were associated with impaired early recovery from anes-thesia and surgery. A larger number of patients in the LDP group received interscalene blocks, per surgeon preference. The use of regional anesthesia may facilitate recovery from anesthesia and surgery; therefore, we performed an analy-sis only on subjects not administered regional anesthesia. The times required to achieve immediate recovery land-marks (time to open eyes, squeeze hand, tracheal extuba-tion, and arrive in the PACU) and meet PACU recovery criteria did not differ between patients with and without CDEs. However, an approximately 7-fold higher incidence of both nausea and vomiting was observed in subjects with CDEs. Some authors have suggested that an important perioperative cause of nausea and vomiting is anesthetic-induced systemic hypotension, which produces a reduction
in decreases in CPP and oxygenation, and an association between intraoperative CDEs and nausea at the end of surgery was observed.26 Our findings provide further
support for an association between CDEs in the operating room and nausea and vomiting during early recovery.
A CDE was defined in this investigation as a ⱖ20% decrease in Scto2values from baseline measures or an Scto2
of ⱕ55%. At the present time, there is not a universally accepted threshold used to identify pathological cerebral saturation. The threshold for identifying cerebral ischemia may be influenced by a number of patient-specific (pres-ence of cerebrovascular disease, incomplete circle of Willis) or technology-dependent variables. Because of wide patient-to-patient variability in baseline Scto2values, some
authors recommend monitoring changes from baseline measurements; a reduction of 15% to 20% from baseline has been used as a critical threshold in many investigations. In awake patients undergoing carotid endarterectomy, a 20% decrease in Scto2was associated with symptoms of cerebral
ischemia.27
In another group of carotid endarterectomy patients, a 15% to 20% decrease in Scto2 was associated
with a 20-fold increase in the odds for developing cerebral ischemia on electroencephalography.28
In addition, 15% to 25% decreases in Scto2 have been significantly correlated
with cognitive dysfunction after cardiac surgery,29
longer PACU and hospital admissions after abdominal surgery,30
and greater release of biochemical markers of brain injury after liver transplantation.31
Preclinical studies suggest that when quantitative NIRS technology is used, absolute Scto2
values of ⱕ55% represent cerebral ischemia.18,32 Recent
studies have demonstrated that FORE-SIGHT– derived val-ues below this threshold were associated with adverse outcomes after cardiac and aortic surgery.29,33
There are several limitations to the present investigation. First, NIRS devices measure saturation in an uncertain mix of arterial, venous, and capillary compartments. In the supine position, the venous contribution to cerebral oxim-etry predominates, with 70% to 84% of Scto2values
deter-mined by venous blood.34,35Changes in body position may
alter venous and arterial blood pressure and affect the ratio of the compartments in the cerebral circulation.36
There-fore, reductions in Scto2may not only reflect decreases in
oxygen supply but also changes in cerebral blood volumes/compartments. Second, baseline Scto2 values
used to define a clinically significant reduction in cerebral oxygenation were measured after induction of anesthesia, because we were interested in assessing position-related changes in Scto2 under identical anesthetic conditions
(similar Fio2, MAP, Etco2, and BIS values). At the present
time, there is no consensus on the setting under which baseline measures should be obtained; previous investiga-tors have collected these data before24,30 and after37,38
induction of anesthesia. We believe that assessing baseline and subsequent Scto2measures under very different
physi-ologic conditions (awake versus anesthetized) would make the determination of changes in Scto2due to alterations in
patient positioning extremely difficult. Third, neurocogni-tive testing to assess the presence or absence of subtle neurologic dysfunction potentially related to CDEs was not
related to alterations in position, was not used intraopera-tively. Fourth, arterial carbon dioxide levels were not measured (ventilation was determined on the basis of Etco2
values). Large inter- and intraindividual variations in arte-rial to Etco2gradients have been reported, and the degree
of this variability may be influenced by patient position-ing.39 Finally, cerebral oxygenation data were recorded
using the FORE-SIGHT cerebral oximeter. Another Food and Drug Administration–approved NIRS device (INVOS; Somanetics Corp., Troy, MI) has been used in the majority of previous perioperative studies, and there are fewer data supporting a beneficial effect of the FORE-SIGHT cerebral oximeter on clinical outcomes. However, a recent volunteer study has demonstrated that the FORE-SIGHT monitor has greater precision with respect to measuring absolute Scto2
than the INVOS monitor.32
In conclusion, our findings demonstrate that significant reductions in Scto2 occur when position is changed from
supine to sitting in patients undergoing general anesthesia. These changes occurred despite the use of a protocol designed to maintain systemic MAP within 20% of baseline values. Furthermore, intraoperative CDEs were associated with a higher incidence of nausea and vomiting in the PACU. Future larger-scale investigations are required to define the degree and duration of reduction in Scto2
associated with permanent neurologic injury.
AUTHOR CONTRIBUTIONS
GSM helped design and conduct the study, analyze the data, and write the manuscript. This author has seen the original study data, reviewed the analysis of the data, approved the final manuscript, and is the author respon-sible for archiving the study files. JWS helped design and conduct the study and write the manuscript. This author approved the final manuscript. JHM helped design and conduct the study. This author approved the final manu-script. SBG helped conduct the study. This author ap-proved the final manuscript. MJA helped design the study, analyze the data, and write the manuscript. This author has seen the original study data, reviewed the analysis of the data, and approved the final manuscript. JSV helped design the study. This author approved the final manuscript. JV helped conduct the study. This author approved the final manuscript. MN helped conduct the study. This author has seen the original study data and approved the final manuscript.
DISCLOSURE
GSM received honoraria from CASMED. All other authors report no conflicts of interest.
REFERENCES
1. Gelber PE, Reina F, Caceres E, Monllau JC. A comparison of risk between the lateral decubitus and the beach-chair position when establishing an anteroinferior shoulder portal: a cadav-eric study. Arthroscopy 2007;23:522– 8
2. Skyhar MJ, Altchek DW, Warren RF, Wickiewicz TL, O’Brien SJ. Shoulder arthroscopy with the patient in the beach-chair position. Arthroscopy 1988;4:256 –9
3. Friedman DJ, Parnes NZ, Zimmer Z, Higgins LD, Warner JJ. Prevalence of cerebrovascular events during shoulder sur-gery and association with patient position. Orthopedics 2009;32:256
4. Weber SC, Abrams JS, Nottage WM. Complications associated with arthroscopic shoulder surgery. Arthroscopy 2002;18:88–95 5. Pohl A, Cullen DJ. Cerebral ischemia during shoulder surgery
in the upright position: a case series. J Clin Anesth 2005;17:463–9
6. Bhatti MT, Enneking FK. Visual loss and ophthalmoplegia after shoulder surgery. Anesth Analg 2003;96:899 –902 7. Papadonikolakis A, Wiesler ER, Olympio MA, Poehling GG.
Avoiding catastrophic complications of stroke and death re-lated to shoulder surgery in the sitting position. Arthroscopy 2008;24:481–2
8. Smith JJ, Porth CM, Erickson M. Hemodynamic response to the upright posture. J Clin Pharmacol 1994;34:375– 86
9. Frey MA, Tomaselli CM, Hoffler WG. Cardiovascular re-sponses to postural changes: differences with age for women and men. J Clin Pharmacol 1994;34:394 – 402
10. Van Lieshout JJ, Wieling W, Karemaker JM, Secher NH. Syncope, cerebral perfusion, and oxygenation. J Appl Physiol 2003;94:833– 48
11. Smelt WL, de Lange JJ, Booij LH. Cardiorespiratory effects of the sitting position in neurosurgery. Acta Anaesthesiol Belg 1988;39:223–31
12. Dalrymple DG, MacGowan SW, MacLeod GF. Cardiorespira-tory effects of the sitting position in neurosurgery. Br J Anaesth 1979;51:1079 – 82
13. Casati A, Spreafico E, Putzu M, Fanelli G. New technology for noninvasive brain monitoring: continuous cerebral oximetry. Minerva Anestesiol 2006;72:605–25
14. Fassoulaki A, Kaliontzi H, Petropoulos G, Tsaroucha A. The effect of desflurane and sevoflurane on cerebral oximetry under steady-state conditions. Anesth Analg 2006;102: 1830 –5
15. Chu LC, Hsu YW, Lee TC, Lin YC, Huang CJ, Chen CC, Hung YC. Changes of regional cerebral oxygen saturation during spinal anesthesia. Acta Anaesthesiol Taiwan 2007;45:155– 62 16. Lovell AT, Owen-Reece H, Elwell CE, Smith M, Goldstone JC.
Continuous measurement of cerebral oxygenation by near infrared spectroscopy during induction of anesthesia. Anesth Analg 1999;88:554 – 8
17. Strangman G, Boas DA, Sutton JP. Non-invasive neuroimaging using near-infrared light. Biol Psychiatry 2002;52:679 –93 18. Fischer GW. Recent advances in application of cerebral
oxim-etry in adult cardiovascular surgery. Semin Cardiothorac Vasc Anesth 2008;12:60 –9
19. Fuchs G, Schwarz G, Kulier A, Litscher G. The influence of positioning on spectroscopic measurements of brain oxygen-ation. J Neurosurg Anesthesiol 2000;12:75– 80
20. Dunham CM, Sosnowski C, Porter JM, Siegal J, Kohli C. Correlation of noninvasive cerebral oximetry with cerebral perfusion in the severe head injured patient: a pilot study. J Trauma 2002;52:40 – 6
21. Drummond JC, Hargens AR, Patel PM. Hydrostatic gradient is important: blood pressure should be corrected. APSF Newslett 2009;24:6
22. Drummond JC. The lower limit of autoregulation: time to revise our thinking? Anesthesiology 1997;86:1431–3
23. Kurth CD, McCann JC, Wu J, Miles L, Loepke AW. Cerebral oxygen saturation-time threshold for hypoxic-ischemic injury in piglets. Anesth Analg 2009;108:1268 –77
24. Slater JP, Guarino T, Stack J, Vinod K, Bustami RT, Brown JM III, Rodriguez AL, Magovern CJ, Zaubler T, Freundlich K, Parr GV. Cerebral oxygen desaturation predicts cognitive decline and longer hospital stay after cardiac surgery. Ann Thorac Surg 2009;87:36–44
25. Borgeat A, Ekatodramis G, Schenker CA. Postoperative nausea and vomiting in regional anesthesia: a review. Anesthesiology 2003;98:530 – 47
26. Atallah MM, Hoeft A, El-Ghorouri MA, Hammouda GE, Saied MM. Does spinal anesthesia affect cerebral oxygenation during transurethral prostatectomy? Reg Anesth Pain Med 1998; 23:119 –25
27. Samra SK, Dy EA, Welch K, Dorje P, Zelenock GB, Stanley JC. Evaluation of a cerebral oximeter as a monitor of cerebral ischemia during carotid endarterectomy. Anesthesiology 2000;93:964 –70
28. Rigamonti A, Scandroglio M, Minicucci F, Magrin S, Carozzo A, Casati A. A clinical evaluation of near-infrared cerebral oximetry in the awake patient to monitor cerebral perfusion during carotid endarterectomy. J Clin Anesth 2005;17:426 –30 29. MacLeod D, White W, Ikeda K, Newman M, Mathew J.
Decreased forebrain cerebral tissue oxygen saturation is asso-ciated with cognitive decline after cardiac surgery. Anesth Analg 2009;108(SCA Suppl):SCA 8
30. Casati A, Fanelli G, Pietropaoli P, Proietti R, Tufano R, Danelli G, Fierro G, De Cosmo G, Servillo G. Continuous monitoring of cerebral oxygen saturation in elderly patients undergoing major abdominal surgery minimizes brain exposure to poten-tial hypoxia. Anesth Analg 2005;101:740 –7
31. Plachky J, Hofer S, Volkmann M, Martin E, Bardenheuer HJ, Weigand MA. Regional cerebral oxygen saturation is a sensi-tive marker of cerebral hypoperfusion during orthotopic liver transplantation. Anesth Analg 2004;99:344 –9
32. MacLeod D, Ikeda K, Vacchiano C. Simultaneous comparison of FORE-SIGHT and INVOS cerebral oximeters to jugular bulb and arterial co-oximetry measurements in healthy volunteers. Anesth Analg 2009;108(SCA Suppl):SCA 56
33. Fischer G, Lin H, DiLuozzo G, Griepp R, Reich D. Decreased cerebral tissue oxygen saturation during aortic surgery in-creases risk of postoperative complications. Anesth Analg 2009;108(SCA Suppl):SCA 54
34. Kurth CD, Steven JM, Benaron D, Chance B. Near-infrared monitoring of the cerebral circulation. J Clin Monit 1993;9:163–70 35. Watzman HM, Kurth CD, Montenegro LM, Rome J, Steven JM, Nicolson SC. Arterial and venous contributions to near-infrared cerebral oximetry. Anesthesiology 2000;93:947–53 36. Pollard V, Prough DS, DeMelo AE, Deyo DJ, Uchida T,
Widman R. The influence of carbon dioxide and body position on near-infrared spectroscopic assessment of cerebral hemo-globin oxygen saturation. Anesth Analg 1996;82:278 – 87 37. Reents W, Muellges W, Franke D, Babin-Ebell J, Elert O.
Cerebral oxygen saturation assessed by near-infrared spectros-copy during coronary artery bypass grafting and early post-operative cognitive function. Ann Thorac Surg 2002;74:109 –14 38. Kussman BD, Wypij D, DiNardo JA, Newburger JW, Mayer JE Jr, del Nido PJ, Bacha EA, Pigula F, McGrath E, Laussen PC. Cerebral oximetry during infant cardiac surgery: evaluation and relationship to early postoperative outcome. Anesth Analg 2009;108:1122–31
39. Grenier B, Verche`re E, Mesli A, Dubreuil M, Siao D, Vanden-driessche M, Cale`s J, Maurette P. Capnography monitoring during neurosurgery: reliability in relation to various intraop-erative positions. Anesth Analg 1999;88:43– 8