HAL Id: hal-02359246
https://hal.archives-ouvertes.fr/hal-02359246
Submitted on 12 Nov 2019
HAL is a multi-disciplinary open access
archive for the deposit and dissemination of
sci-entific research documents, whether they are
pub-lished or not. The documents may come from
teaching and research institutions in France or
abroad, or from public or private research centers.
L’archive ouverte pluridisciplinaire HAL, est
destinée au dépôt et à la diffusion de documents
scientifiques de niveau recherche, publiés ou non,
émanant des établissements d’enseignement et de
recherche français ou étrangers, des laboratoires
publics ou privés.
Yasmine Hajar, Laureline Treps, Carine Michel, Elena Baranova, Stephan
Steinmann
To cite this version:
Yasmine Hajar, Laureline Treps, Carine Michel, Elena Baranova, Stephan Steinmann.
Theoreti-cal insight into the origin of the electrochemiTheoreti-cal promotion of ethylene oxidation on ruthenium
oxide. Catalysis Science & Technology, Royal Society of Chemistry, 2019, 9 (21), pp.5915-5926.
�10.1039/C9CY01421G�. �hal-02359246�
Journal Name
ARTICLE
Received 00th January 20xx, Accepted 00th January 20xx DOI: 10.1039/x0xx00000x
Theoretical Insight into Origin of Electrochemical Promotion of
Ethylene oxidation on Ruthenium Oxide
Yasmine M. Hajar,
aLaureline Treps,
bCarine Michel,
bElena A. Baranova,
a†Stephan N. Steinmann,
b*
In electrochemical promotion of catalysis (EPOC), the adsorption energies of reactants and products, and subsequently the overall reaction catalytic rate are modified by applying an electrochemical potential to the catalyst. In this paper, the oxidation of ethylene on ruthenium oxide was studied by experiments and theoretical modeling in order to elucidate the atomistic origin of EPOC. The experimental results have shown an increase in the reaction rate under negative and positive polarization. Density functional theory (DFT) based surface free energies demonstrated that there is an increase in oxygen coverage on the ruthenium surface as a function of the potential, conforming with the backspillover model of EPOC. Furthermore, DFT results demonstrated that the positive polarization and the associated electric field, which increases the work function, results in enhanced adsorption and facilitated cleavage of the C-C bond of ethylene. Under negative polarization, on the other hand, it is the oxygen activation that is facilitated. Together, these two pieces of the puzzle explain the experimental increase of the ethylene oxidation rate as a function of positive and negative potential, proving the effect of an electric field on the adsorption rate and activation energy of ethylene oxidation.1. Introduction
Metal-support interaction (MSI) and alkali metal doping are two methods that tune a catalyst performance through the modification of the surface’s electronic structure, and concomitantly, the binding energy of the chemisorbed species
1,2. Alternatively, based on the work of Wagner 3, Vayenas and
co-workers progressed in working on the effect of an electrochemical supply or removal of ions to or from a catalyst deposited on solid ionically-conducting electrolytes, e.g., Y2O3
-doped ZrO2 (YSZ, O2- conductor), BaZr0.8Y0.2O3−δ (BZY , H+
conductor), β”-Al2O3 (K+ conductor), etc. 4–7. They demonstrated
a reversible alteration of catalytic activity and in some cases selectivity when an electric current or potential is applied 8–10.
This phenomenon, called Electrochemical Promotion of Catalysis (EPOC), or Non-Faradaic Electrochemical Modification of Catalysis (NEMCA), has been shown to be functionally equivalent to MSI effect between a dispersed catalyst phase and conducting supports (TiO2, CeO2, ZrO2, etc.) but is operationally
more controlled, as it allows an in-operando modification of the electronic properties of catalysts 8. Our recent paper has
demonstrated the functional equivalency between EPOC and MSI as we have compared the promotive effect of supporting
nanoparticles on metal oxides to electrochemically promoting the nanoparticles. The rates increase due to EPOC and supporting the catalysts on active metal oxides were similar in the case of platinum and ruthenium catalysts 11. Furthermore,
many highly dispersed electrochemically promoted systems have been established, rendering the practical application of EPOC more attractive 11,12,21–24,13–20. Experimentally, the origin
of EPOC is mostly explained by the electrochemically induced promoters (see Figure 1), which have been substantiated by many in-situ and ex-situ techniques: x-ray photoelectron spectroscopy (XPS) 25,26, in-situ XPS 27,
temperature-programmed desorption (TPD) 28,29, scanning tunneling
microscopy (STM), photoemission spectroscopy (PES) 30, in-situ
AC impedance spectroscopy 31,32, and isotopic exchange 33.
When applying an electrochemical potential across a solid electrolyte on which a metallic catalyst is adsorbed, ions originating from the solid electrolyte, Oδ- in case of YSZ, are
(partially) discharged at the three-phase boundary and migrate to the gas exposed catalyst surface to formally form a double layer Oδ- - δ+ (δ+ is themirror charge in the conductor for
preserving the neutrality). Figure 1 demonstrates the oxygen migration in the case of a continuous catalyst film similar to what has been used in previous papers 34–36. It has been
determined that in the presence of oxygen ions there is a one-to-one correlation between the applied potential (UWR) and the
change in work function (ΔΦ) at the metal-gas interface in a wide range of temperatures 6,37 (Eq. 1):
eΔUWR = ΔΦ Eq. 1
Therefore, the density of this double layer and subsequently the work function of the catalyst are in-operando controlled by an electrochemical potential application. The change of work function leads to catalytic rate and selectivity alternation due to a.Department of Chemical and Biological Engineering, Centre for Catalysis Research
and Innovation (CCRI), University of Ottawa, 161 Louis-Pasteur, Ottawa, ON K1N 6N5, Canada.
b.Univ Lyon, ENS de Lyon, CNRS, Université Lyon 1, Laboratoire de Chimie UMR 5182, F-69342, Lyon, France.
† elena.baranova@uottawa.ca; Tel: 16135625800 (x 6302); Fax: 16135625172. * Corresponding author: stephan.steinmann@ens-lyon.fr;Tel: +33472728847;Fax: +33472728080.
Electronic Supplementary Information (ESI) available: [details of any supplementary information available should be included here]. See DOI: 10.1039/x0xx00000x
the change in the adsorption properties of reactants and/or intermediates. Since the coverage effect is experimentally detectable, most of EPOC is rationalized in terms of an increased/decreased availability of the promoter on the surface, suggesting a direct implication of the promoter.
However, these experiments do not directly observe the reactive surface species and the promoter might just generate an electrostatic field, which itself impacts the kinetics of the reaction 38,39. Therefore, computational mechanistic studies are
complementary to the experimental characterizations.
Figure 1: A schematic representation of ruthenium electrode deposited on O2- conducting YSZ solid electrolyte, showing the locations of the metal/electrolyte double layer [Oᵟ- δ+]
and the effective double layer created at the metal/gas interface. All electrodes are under the same gaseous conditions. The potential-controlled ion migration (backspillover) and charge transfer affect the adsorption strength of electropositive ethylene and electronegative oxygen gas species (shown on the right).
Early theoretical modeling of EPOC was performed using clusters of metallic atoms to model the Cl adsorption on Cu and O adsorption on Pt surface 40,41. In the case of co-adsorption of
Cl and benzene on the surface of Cu, Pacchioni et al. showed that Cl induces an increase in the Cu work function and therefore an increase in the adsorption energy of the benzene product resulting in an inhibition of the acetylene trimerization reaction 40. In the case of O adsorption on Pt, the authors drew
a correlation between the increase in the catalyst-electrode potential and corresponding work function and the decrease in the experimental peak temperature of adsorbed oxygen 41.
However, they showed subsequently that the oxygen desorption temperature is not directly correlated to the oxygen desorption energy, concluding that the effect of the change in work function on the bonding of adsorbed molecules (reactants and products) depends on the nature of the surface’s chemical bond 40. Later, Leiva et al., have investigated the effect of the
positive charge of Na on the work function of the Pt surface and compared it to when oxygen was jointly present 42.
In more recent theoretical modeling studies, the effect of external and internal electric field on the activity of catalysts was investigated with correspondence to solid oxide fuel and electrolysis cells 38,39,42–46. A cluster model and hybrid density
functional theory (DFT) calculations were used by González et
al. to simulate the electric field effect on the adsorption of CO
on Cu, Rh and their bimetallics 44. They concluded that the CO
bond increases in strength with a positive electric field. Chen et
al. used a dipole layer to model the electric field effect on the
Ni/YSZ interface 43. They found that a positive potential
increases the activation energy of oxygen vacancy formation, therefore reducing the deactivation mechanism of the catalyst-electrode at the three-phase boundary. In another work, the activation energy of C-H dissociation in methane was found to increase as a function of the field strength resulting in a decrease of the methane steam reforming reaction 38.
Herein, we rely on the model reaction of ethylene oxidation
31,32,34–36,47–50 to demonstrate, using ab-initio computations, the
effect of electrochemical potential on the surface reactivity. We will elucidate on the one hand the impact of the electrochemical potential on the surface state compared to thermal catalysis and on the other hand, the impact of the potential generated electric field on the reactivity of ethylene and oxygen activation. To be more precise, the most stable surface oxygen termination is determined as a function of the electrochemical potential. For a given surface state, the adsorption and dissociation energies of gaseous ethylene and oxygen are dependent on the potential-generated electric field, which is modeled through modification of the total surface charge.
2. Theory and Computational Method
2.1. Slab model and computational details
Plane wave DFT calculations were performed using projector augmented wave pseudopotentials provided in VASP (Vienna Ab-initio Simulation Package) 51,52. The energy evaluation
exploited the generalized gradient approximation (GGA) with a Perdew-Burke-Ernzerhof (PBE) exchange-correlation functional together with the density-dependent dispersion correction dDsC 53,54. Additional computations at the
Heyd-Scuseria-Ernzerhof (HSE) level of theory of the work function of the three main surfaces of RuO2 show that the PBE work function is in
excellent agreement with experimental values (5.8 to 6.6 V) 55,
while the HSE results are 0.5 V higher compared to PBE and reach 7.1 V for the most oxygenated surface (Figure S17). Nevertheless, even the 0.5 V difference between HSE and PBE is small enough to ensure that the qualitative mechanistic insight gained in this study does not significantly depend on the level of theory.
In the bulk rutile structure of RuO2,the Ru atoms are six-fold
coordinated to oxygen atoms, while O atoms are coordinated to three Ru atoms in a planar sp2 hybridization 56. The surface
energies of the bulk-truncated, bridging-oxygen- terminated RuO2 (110), RuO2 (100), and RuO2 (101) surfaces were
determined by previous DFT calculations and the (110) facet shown to be the most stable one and thus prevailing for polycrystalline RuO2 57. On the RuO2 (110) surface, a weakly
bound oxygen species can be found to adsorb on-top (Oot) of
the otherwise five-fold coordinatively unsaturated Ru (5f-cus-Ru), while stronger bridging oxygen (Obr) atoms are found on
the six-fold coordinatively saturated Ru sites (6f-cus-Ru) 58.
The slab used to model RuO2 (110) rutile 59 film is made out
of three layers of Ru with intermediate O resulting in a ~10 Å thick slab. The intermediate layer is fixed, but all other atoms are allowed to relax during the computation until the forces are less than 0.03 eV/Å. A vacuum spacing of 15 Å was included to reduce the periodic interaction in the surface normal direction. The effect of vacuum spacing is shown in Figure S 9. In terms of unit size, a 6.2058 x 6.2897 x 25.1387 Å3 cell with a
corresponding 6 x 6 x 1 Monkhorst-Pack k-point mesh is used. The highest frequency of the plane wave basis set corresponds to a cut-off energy of 550 eV (Figure S 10) and the electronic energy is converged to reach a threshold of 10-6 eV. Isolated
molecules are optimized using the same parameters at the gamma point using a cubic box of (8000 Å)3.
The electrochemical promotion effect on the catalyst slab was modeled by adding the linearized Poisson-Boltzmann equation
60,61 to the Kohn-Sham equations using the VASPsol module 62.
This method, also known as surface charging 63 or
grand-canonical DFT 64–67, has been validated for the adsorption of
pyridine on Au (111) by Steinmann et al. 68. The implicit
solvation model places a quantum-mechanical solute in a cavity surrounded by a continuum dielectric description of the solvent and counter-charge distribution, allowing to mimic the effective electrochemical double layer 69,70. Such a surface polarization by
modifying the surface charge also introduces an electric field as analyzed by us in a previous work 71. The use of symmetric slabs
together with the linearized Poisson-Boltzmann equation allows to unambiguously reference the Fermi-level to the potential far away from the surface, assumed to correspond to vacuum. The effect of the addition of charges on the electrochemical potential (i.e., work function) for different systems is shown in Figure S 11. The diffuse counter-charge added through the linearized Poisson-Boltzmann equation to neutralize the system is a proxy to model the effect of smoothly varying oxygen coverages, in analogy to our previous work on the indirect effects of bases in heterogeneous catalysis 71,72. In EPOC there
is no solvent present, just an effective double layer generated, in our case, by the varying amount of oxygen species. Hence, we have carefully assessed the influence of the relative permittivity of the “solvent” and the cavity size (Figure S 12 and S13). Both have been found to have a negligible effect on the surface free energies of the three main surface terminations (2Obr/2Oot, 2Obr/2Ru, and 2Ru/2Ru). We conclude, therefore,
that the obtained results do not significantly depend on the choice of technical parameters that have no clear meaning in EPOC and that the surface charging in combination with the linearized Poisson-Boltzmann equation is a convenient and efficient computational model to investigate EPOC.
To find the minimum energy pathway between adsorption of ethylene and its consecutive dissociation, transition state computation was performed using the Nudged Elastic Band method in combination with Dimer method and Quasi-Newton optimization. The obtained structure was verified to yield a single imaginary frequency consistent with the reaction path under study using vibrational frequency analysis.
2.2. Ab-initio atomistic thermodynamics including the electrochemical potential
Thermodynamic stability of a surface can be derived by comparing a multitude of surface structures and their corresponding surface free energy (SFE) 𝛾"𝑇, 𝑃&'( (Eq. 2). The
surface with the lowest SFE is the most stable structure. Following the work of Reuter et al.73, two main variables that
are required for the calculation of RuO2 (110) surface free
energy are temperature (T) and oxygen partial pressure (𝑃&').
𝛾"𝑇, 𝑃&', 𝑁,-, 𝑁&( = 1 2𝑆2 𝐸,-&' 4567 ( 𝑁 ,-, 𝑁&) − 𝑁,- 𝐸,-&' 7-5: +(2 𝑁,-− 𝑁&) 1 2 <𝜇&' > "𝑇, 𝑃 &' >( + 𝑅𝑇𝑙𝑛𝑃&' 𝑃 >B C Eq. 2
Where 2S serves to normalize 𝛾 by the two surfaces S of the symmetrical unit cell. The Gibb’s energy of the bulk is taken equal to the electronic energy computed for the primitive cell of the bulk 𝐸,-&'
7-5: , while the free energy of the surface is
approximated by the electronic energy 𝐸,-&'
4567 . N
Ru and NO are
the numbers of Ru and O atoms in the supercell, while 𝑃 > is the
standard pressure. The determination of the standard chemical potential of oxygen 𝜇&'
> and the detailed derivations are given
in section 4 of the ESI.
In equation 2, the oxygen supply is gaseous, whereas, in EPOC conditions, the oxygen is supplied in its ionic form from the oxygen-conducting electrolyte material as follows:
𝑂 EF(𝑌𝑆𝑍) + 𝑅𝑢𝑂E→ 𝑂@𝑅𝑢𝑂E+ 2𝑒F Eq. 3
It has been established that the equilibrium potential of SOE with respect to vacuum is 5.14 V 74, whereas that of SHE is 4.44
V 75. Therefore the equilibrium potential of SHE with respect to
SOE is equal to -0.7 V.
As shown in the ESI, the chemical potential of oxygen anions 𝜇&'M is linked with the chemical potential of oxygen from the
gas phase and the applied potential, so that the surface free energy becomes:
𝛾"𝑇, 𝑃&', 𝑁,-, 𝑁&, 𝑈6O>PQ/STU(
= 𝟏 𝟐𝑺 ⎩ ⎪ ⎪ ⎨ ⎪ ⎪ ⎧𝑬𝑹𝒖𝑶𝟐 𝒔𝒍𝒂𝒃 "𝑵𝑹𝒖, 𝑵𝑶,𝑼𝒂𝒏𝒐𝒅𝒆/𝑺𝑯𝑬(− 𝑵𝑹𝒖 𝑬𝑹𝒖𝑶𝟐 𝒃𝒖𝒍𝒌 +(𝟐 𝑵𝑹𝒖− 𝑵𝑶) m 𝟏 𝟐n𝝁𝑶𝒐𝟐"𝑻,𝑷𝑶𝒐𝟐( + 𝑹𝑻𝒍𝒏 𝑷𝑶𝟐 𝑷𝑶𝒐𝟐r +𝟐𝒆"𝑼𝒂𝒏𝒐𝒅𝒆/𝑺𝑯𝑬− 𝟎. 𝟕 𝑽( w ⎭ ⎪ ⎪ ⎬ ⎪ ⎪ ⎫ Eq. 4
2.3. Adsorption energy calculation including electrochemical potential
The adsorption energy on a symmetrical RuO2 surface adsorbing
one C2H4 from each side is expressed by:
𝑬𝒂𝒅𝒔=
𝟏
𝟐{𝑬𝟐𝑪𝟐𝑯𝟒/𝒔𝒖𝒓𝒇− "𝟐 × 𝑬𝑪𝟐𝑯𝟒+ 𝑬𝒔𝒖𝒓𝒇(• Eq. 5
Where 𝐸E‚'Tƒ/4-„… is the energy of the state containing two
symmetrically adsorbed C2H4, 𝐸4-„… is the energy of the bare
surface, and 𝐸‚'Tƒis the energy of an isolated C2H4 molecule in
the gas phase. From the equation above, a more negative value for the adsorption energy indicates a more stable adsorbed C2H4
on the RuO2 (110) surface. The adsorption is performed
symmetrically on both surfaces to avoid spurious dipole interactions. The C2H4 coverage corresponded to 25 % of the Ru
density on the surface.
The presence of an electrochemical potential is likely to affect the electronic energy of the surface and of the ethylene adsorbed on the surface, resulting in a change of the adsorption energy of molecule as follows:
𝑬𝒂𝒅𝒔(𝑼𝒂𝒏𝒐𝒅𝒆/𝑺𝑯𝑬) =𝟏 𝟐† 𝑬𝟐𝑪𝟐𝑯𝟒/𝒔𝒖𝒓𝒇"𝑼𝒂𝒏𝒐𝒅𝒆/𝑺𝑯𝑬( − ‡𝟐 × 𝑬𝑪𝟐𝑯𝟒 (𝒈)+ 𝑬𝒔𝒖𝒓𝒇(𝑼𝒂𝒏𝒐𝒅𝒆/𝑺𝑯𝑬)‰ Š Eq. 6
As explained in section 2.1, the VASPsol module allows the modification of the surface charge (and thus the work function, i.e., the electrochemical potential) of the slab and thus mimicking the effect of the effective double layer. Performing geometry optimisations at various charges, we can fit the relation between the electronic energy and the electrochemical potential for the bare slab, 𝑬𝒔𝒖𝒓𝒇, and for the one containing
two symmetrically adsorbed C2H4, 𝑬𝟐𝑪𝟐𝑯𝟒/𝒔𝒖𝒓𝒇. Then, the
dependence of the adsorption energy upon the electrochemical potential is trivially derived. The procedure is illustrated in Figure S15 and is analogously applied for all adsorbed species, including transition states, as illustrated in Figure S16.
3. Experimental
3.1. Synthesis of RuO2 nanoparticles
Ruthenium oxide (RuOx) nanoparticles were synthesized using
the polyol synthesis method 76. In short: 0.105 g of Ruthenium
(III) chloride (Sigma AldrichÒ) precursor salt was dissolved in 15
mL of ethylene glycol (Fisher ScientificÒ) containing 0.25 M
tetra-methyl ammonia hydroxide (TMAH) (Sigma AldrichÒ). The
solution was pre-mixed for an hour in a round-bottom flask then heated up to 160°C under reflux and cooled down directly after the temperature was reached. The initial pH of the synthesis solution was 12 and dropped to 7 after the reflux indicating nanoparticles formation 76.
3.2. Physiochemical characterization
The Scanning Transmission Electron Microscopy (STEM) micrographs of ruthenium oxide nanoparticles were performed using FEI Titan3 80 - 300 microscope operated at 300 kV and equipped with an energy dispersive X-ray (EDX) spectrometer. Annular Dark Field (ADF) images were taken using a Fishione
detector to provide a contrast between the nanoparticles and the support at convergence and collection angles of 17 and 60 mrad, respectively. The RuO2 colloidal solution was diluted and
sonicated in ethanol then deposited dropwise on a 200 mesh copper grid coated with a lacy carbon support film (Ted Pella). ImageJÒ software was used to find the distribution of the
ruthenium oxides RuOx nanoparticles size. Figure 2a shows a
representative STEM of the free-standing nanoparticles of ruthenium oxide. The ADF image represents the nanoparticles as bright spots on the darker background. The particle size distribution is shown in the histogram in Figure 2b and the average particle size was calculated to be 0.9 nm.
Figure 2: (a) STEM of ruthenium colloid and (b) corresponding particle size distribution. Scale bar is 10 nm.
3.3. Electrochemical cell and reactor
Colloidal solution of ruthenium oxide nanoparticles was deposited 10 µL at a time over the yttria-stabilized zirconia (YSZ) solid electrolyte (1.9 cm2), with intermittent drying at 100 oC.
The final metal loading was 0.1 mg of RuOx covering 1 cm2
surface area of the YSZ electrolyte. On the other side of the electrolyte, the catalytically inert gold counter electrode (CE) and reference electrode (RE) were deposited using commercial gold paste (Gwent group) prior to the deposition of RuOx
catalyst. The surface area of CE and RE was 1 and 0.2 cm2,
respectively. Catalytic measurements were carried out at atmospheric pressure in the single-chamber capsule described in our previous work such as all electrodes are under the same gaseous conditions 77,78. The working electrode side of the
electrolyte was pressed against a gold mesh (1 cm2) that served
as a current collector, while the counter and reference electrodes were pressed directly against gold wires 79. Two type
electrochemical cell, one for temperature control and one for data acquisition. A schematic of the system is shown in Figure S1 and S2. The reaction gases were ethylene (Linde, 0.5% C2H4
in He), oxygen (Linde, 20% O2 in He), and helium (Linde, 99.999%
He) as a carrier gas. The total flow rate was constant at 100 mL min-1. Gas composition was varied using MKS, 1259-C and
1261-C series flow meters and detected using a non-dispersive infrared (NDIR) CO2 gas analyzer (Horiba, VA-3000). A
potentiostat-galvanostat (Arbin InstrumentsÒ, MSTAT) was
connected to the electrodes to apply constant electric current or potential on the electrochemical cell (Figure S2).
4. Results and discussion
4.1. Electrochemical promotion of RuOx for complete ethylene oxidation reaction
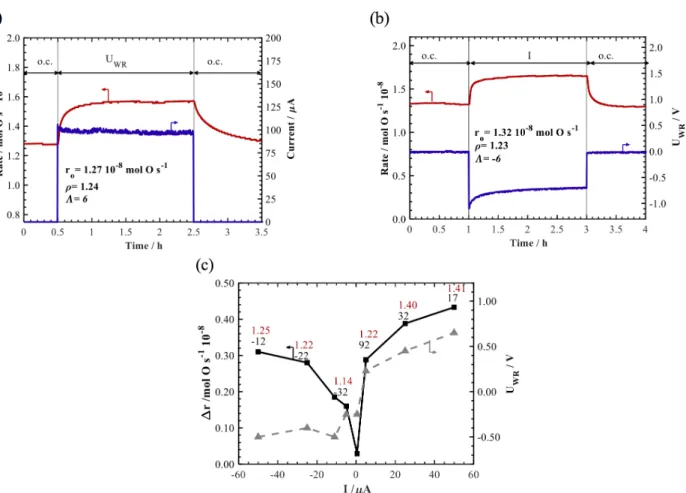
Figure 3a shows the evolution of the reaction rate of the RuO2
catalyst during a potentiostatic step of 0.5 V. At t=0.5 h, the constant potential was applied and resulted in a 30% increase in the reaction rate, reaching a new constant value over a duration of two hours. At potential interruption (t=2.5h), the reaction rate decreased to its initial steady-state value within an hour. The ratio of the closed-circuit rate r over the open-circuit rate ro is denoted as the rate enhancement ratio, 𝜌 (Eq. 7).
𝝆 = 𝒓 𝒓𝒐
Eq. 7
Another determining parameter of the EPOC effect is the apparent Faradaic efficiency Λ:
𝜦 = 𝜟𝒓
𝑰/𝒏𝑭 Eq. 8
Where Δr is the difference between the closed and open circuit reaction rate (Δr = r – ro), I is the applied current, n is the
number of electrons transferred (2 for O2-), F is the Faraday
constant. The ρ and Λ values in Figure 3a are 1.23 and 6, respectively.
Figure 3b shows the reaction rate change under a negative galvanostatic step of -100 µA. The reaction rate of ethylene oxidation showed an enhancement in its value under the cathodic polarization as well reaching a 30% increase in the catalytic rate with Λ of -6. This increase in the rate under negative polarization was not detected previously except under fuel-rich conditions 34. Therefore, this could
be related to the contamination of previous catalysts with Na which inhibited any promotional effect at the cathodic counterpart 11 or
due to the morphology obtained in the current sodium-free catalyst which has an average particle size below 1 nm.
Figure 3: Transient rate response of RuO2 NPs to a step change of (a) an applied potential UWR = 1 V, (b) an applied constant current I=-100µA and (c) a summary of rate increase as
a function of multiple galvanostatic applications. o.c.: open-circuit. Conditions: T = 350 oC, PC2H4 = 0.012 kPa, PO2=3 kPa. Total flow rate =100 ccm. The corresponding Faradaic
efficiency (in black) and enhancement ratio (in red) on top of each current value are also shown in part (c).
Finally, multiple step-change galvanostatic tests were carried
potential. The increase in the rate under cathodic and anodic polarization shows that the change in the work function in both directions result in an enhancement of the catalytic rate. However, anodic polarization had a stronger effect on the rate than cathodic polarization. A maximum L factor of 92 at an applied current of 0.5 µA was reached and the highest increase of the catalytic rate by 41% was found at +50 µA.
4.2. DFT modeling of RuO2 (110) rutile structure and ethylene adsorption
4.2.1 RuO2 (110) rutile structure
In the RuO2 rutile bulk 73,80 every metal atom is coordinated with
six oxygens and every oxygen links to three metal neighbors. The oxygen bonds to Ru are not all equivalent and can be distinguished into four in-plane ones of 1.97 Å length and two orthogonal ones of 1.92 Å length. The nomenclature for the oxygen on the surface will be Oot for oxygen directly on top of
Ru and Obr for oxygen bridging between two ruthenium atoms.
Ru4,5,6f nomenclature will be used to refer to the number of
coordination such that sixfold, 6f coordination is for Ru
saturated with six bonds of oxygen, 5f is for Ru missing Oot
coordination and 4f is for Ru missing two Obr coordination. This
nomenclature is similar to Reuter et al. 73 and differs from Over
et al. 58 where 1f and 2f nomenclature was used for Ru
coordinated with Oot and Obr, respectively. As to the surface
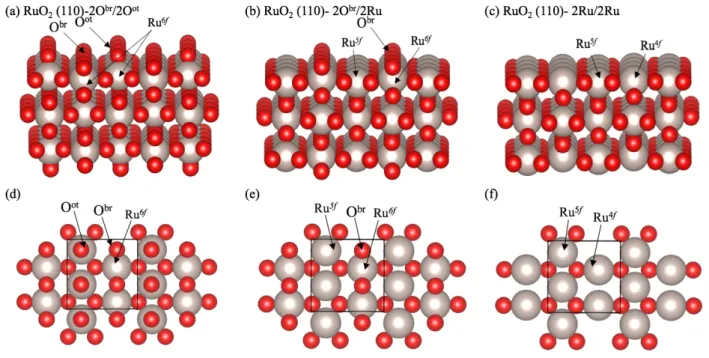
calculations, the representative unit cell used was chosen to be a nearly square p(2x2) super-cell with three layers of Ru in the z-direction. The middle layer was fixed depicting the bulk whereas the remaining ones were free to move. The coordination of Ru atoms at top and bottom open surfaces changed coordination accordingly to the three surfaces being tested. The three common surface terminations are presented in Figure 4 (side and top views) such that (a) and (d) show a termination where all Ru have their saturated six-fold coordination due to the Obr and Oot atoms, called 2Obr/2Oot; (b)
and (e) present the stoichiometric RuO2 (110) terminated with
2Obr/2Ru, and (c) and (f) show a termination that lacks oxygen
and therefore its surface ends with 2Ru/2Ru which are fourfold- and fivefold- coordinatively unsaturated.
Figure 4: Possible three terminating planes of RuO2 (110) surface; side (perspective) view of surface with a) 2Obr/2Oot, b) 2Obr/2Ru and c) 2Ru/2Ru termination; (d–f) are top view of
the three surfaces. (Ru: large light spheres, O: red small spheres). Solid lines representing the cell boundary. 4.2.2 Prediction of RuO2 (110) termination
Under open-circuit conditions, the most stable surface termination was identified using the minimal surface free energy (SFE) approach. The oxygen chemical potential 𝜇&'
effect on the SFE of RuO2 slab truncated at different oxygen
positions was compared to that found in Reuter et al. as shown in Figure S 5 and the most stable surface is presented as a function of temperature and oxygen partial pressure. It was found that the surface termination with 2Obr/2Oot was the most
stable at the considered temperatures and oxygen partial pressures. Only at P(O2) as small as 10-10 kPa, the 2Obr/2Ru
surface becomes the most stable above a temperature of 500
oC. The energy of a reduced surface (with 2Ru/2Ru termination)
was unstable in comparison, which rules it out as a stable
surface under open-circuit potential conditions. SFE calculation for RuO2 (110) that has a 2Ru/2Oot termination without Obr
atoms was compared as an alternative form of a stoichiometric surface. However, it was found to be less stable than the other surfaces under all conditions.
4.2.3 Effect of potential on surface free energy
The previous section showed that RuO2 (110) with 2Obr/2Oot
termination is the most stable structure under open-circuit conditions. In this section, we introduce the effect of the application of an electrochemical potential. The change in number of electrons along with a diffuse counter-charge layer added through the linearized Poisson-Boltzmann equation allows to mimic implicitly an intermediate effective double layer
of oxygen ions. The resulting effective double layer affects the surface free energy and the RuO2 surface termination (Eq. 4). At
a partial pressure of oxygen equal to 1 kPa (used as a lower limit for experimental conditions, see Figure S7 for partial pressure effect), the effect of temperature and electrode potential on the most stable surface structure is depicted in Figure 5.
At the experimental temperature of 350 oC, it can be seen
that structure B (2Obr/2Oot) is the most stable surface
termination in the electrode potential range of -0.5 to +0.15 V vs SOE. At the cathodic side, as the temperature increases, the oxygen chemical potential decreases, which results in stabilizing the surface with less oxygen. At 350 oC, the stable surface
termination transitions from structure C (2Obr/1OotRu) to
structure D (2Obr/2Ru) as the potential decreases. At the
extreme cathodic polarization (under -1.2 V vs SOE), which is outside the experimental range of +/- 0. 8 V vs SOE (-0.1 – 1.5 V vs SHE) (see Figure 3), the 2Ru/2Ru surface termination becomes the most stable. At the positive side of the potential range, SFE calculations demonstrated that an additional
structure with an extra oxygen on the Oot atom is more stable
than 2Obr/2Oot. At 350 °C, above a potential of 0.15 V vs SOE
(0.85 V vs SHE), structure A (2Obr/4Oot) became the most stable.
Calculation for an intermediate structure 2Obr/3Oot showed that
it was not more stable compared to 2Obr/4Oot in the given
potential range. These findings illustrate that as the potential value increased, the surface which is covered with a higher number of oxygen atoms becomes more stable, as shown in the surface phase diagram (Figure 5). This increase of oxygen concentration on the surface with increased potential conforms with the oxygen backspillover process that was discussed extensively in previous experimental and theoretical papers. Compared to the temperature and O2 pressure dependence
discussed above, the surface state is more strongly dependent on the applied electrochemical potential. In general, this explains part of the EPOC effect, since tuning the electrochemical potential provides an efficient means to control the catalyst surface state, which in turn modifies the reactivity of the catalyst.
Figure 5: Surface phase diagram of stable structure of RuO2 as a function of potential and temperature. P(O2)=1 kPa. Structures A to E are illustrated on the right with top and side
view.
4.2.4 Adsorption of ethylene on the surface
Non-EPOC related DFT modeling of ethylene oxidation on ruthenium surface has been studied previously: In Lopez et al., adsorption of π-C2H4 directly on a free Ru atom was studied and
its migration to form oxametallacycle (OMME) intermediate was shown. However, when the RuO2 surface has full coverage
of oxygen, ethylene adsorption transitions from epoxide to the more stable O-C2H4-O form 81. Only the C-H bond dissociation
was studied in Liang et al., showing the facilitation of the C-H cleavage on a fully oxidized surface compared to a stoichiometric one 82.
Here, ethylene adsorption is studied on RuO2 (110) with the
most stable 2Oot/2Obr surface termination prior to polarization.
σ-C2H4 molecule adsorption energy was calculated for three
positions of C2H4: on the 2Oot, 2Obr, and OotObr. The adsorption
energy under open-circuit potential (ocp) condition was the lowest when ethylene adsorbed on 2Oot in σ form (-2.9 eV), and
the highest when adsorbed in π-form on Oot (-1.6 eV). σ-bond
on 2Obr and diagonally on OotObr yields intermediate adsorption
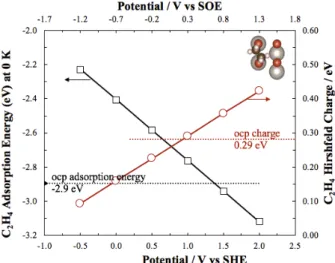
energies of -2.0 and -2.8 eV, respectively (shown in Figure S 17). Figure 6 shows the effect of the electrode potential on the stability of σ-C2H4 adsorption energy. It can be seen that the
increase in the electrode potential (proportional to the surface work function) results in increasing (in absolute value) the heat of adsorption of σ-C2H4 rendering ethylene adsorption more
stable than at ocp beyond a potential of 1.3 V vs SHE. This trend is paralleled by the increasing positive partial charge of the molecule (determined from Hirshfeld charge) as a function of potential (right axis of Figure 6). Thus, this figure confirms the EPOC mechanism 8 that the increase in the work function results
in an increase in the heat of adsorption (produced thus negative) of ethylene and its electropositive behavior.
Figure 6: C2H4 adsorption energy and its total charge as a function of potential on RuO2
(110) surface with 2Obr/2Oot termination. Dotted line corresponds to ocp values.
The effect of the potential was similar on the dissociation intermediates (dissociated C-H and dissociated C-C) (Figure 7), i.e., the adsorption energy of these intermediates is strengthened as a function of increasing potential.
Figure 7: C2H4 and consecutive intermediates’ adsorption energy as a function of
potential on RuO2 (110) surface with 2Obr/2Oot termination. Dotted line corresponds to
ocp adsorption value, while the solid line corresponds to adsorption energy variation as a function of potential value.
4.2.5 DFT prediction of ethylene dissociation on 2Obr/2Oot
surface termination
Figure 8 shows the energy diagram computed using DFT for the C-C bond dissociation on the 2Obr/2Oot RuO2 (110) surface
termination. Our results (Figure 8b) demonstrate that the energy barrier for C-C bond dissociation decreases as a function of increasing applied potential and becomes smaller than under ocp conditions beyond a potential of 0.3 V vs SHE or -0.4 V vs SOE. The activation energy continues to decrease beyond this potential value, which demonstrates the advantageous effect of potential on the facilitation of the C-C bond dissociation step.
Similarly, the reaction energy decreased as a function of the electrode potential rendering the reaction more exothermic as a function of increasing potential.
Figure 8: (a) Energy diagram and (b) corresponding activation and reaction energies as a function of potential for C-C bond dissociation over 2Obr/2Oot surface termination of
RuO2 (110).
The corresponding transition state is shown more clearly in Figure 9 where the stretching of the C-C bonds occurs at the intermediate step. The distance between the two carbons stretched from an initial length of 1.5 Å to a final value of 2.6 Å, passing by 2.1 Å at the transition state.
At ocp, the C-H bond dissociation has an activation energy barrier of 0.58 eV (Figure S 19) compared to the C-C bond dissociation, which is at 0.53 eV. The C-H bond dissociation activation energy also decreased as a function of potential, accelerating it for potentials beyond 0.6 V vs SHE compared to ocp conditions. When comparing the potential effect on C-H vs C-C bond rupture, it can be seen that the potential effect on the C-C bond dissociation is more pronounced than on the C-H bond, which makes the prior the preferred dissociation step.
The increase in the adsorption energy of ethylene as a function of potential as well as the decrease of the activation energy for C-C (and C-H) bond dissociation explains the
enhancement in the experimental catalytic rate observed under the application of an anodic potential. In summary, the removal of electron charges off the surface results in an increase of the electrode potential and a subsequent increase in the heat of adsorption of σ-C2H4 and a decrease in the activation energy of
C-C bond dissociation.
Figure 9: Structure of the initial, transition and final state of (C-C) bond dissociation on 2Obr/2Oot RuO2 (110) surface.
4.2.6 DFT prediction of oxygen adsorption and dissociation on the 2Obr/2Ru surface termination
The enhancement in the reaction rate of ethylene oxidation was also found to experimentally occur under negative potential as demonstrated in Figure 3. Since the surface state strongly depends on the electrochemical potential (Figure 5), we have hypothesized that under negative polarization it is the activation of O2 that is accelerated. Therefore, further
computation was performed to investigate the effect of potential on the filling of the 2Oot vacancies by adsorbing
gaseous O2. Note, that there are two sources of oxygen: The
electrochemical one that determines the surface state and is source for the electron charges, and the gas-phase oxygen, which is the one for which we have computed the activation and adsorption energy. Since the electrochemical potential and the O2 gas-flow are fixed independently, the chemical potentials of
these two oxygen sources are not equalized, i.e., the system is not in equilibrium. The oxygen required for the non-Faradaic C2H4 oxidation is taken from the gas phase. Therefore, it is a key
point that EPOC has a non-equilibrium nature such that the reactivity of oxygen stemming from YSZ (Faradaic reaction) is different than the one from gas-phase (non-Faradaic reaction).
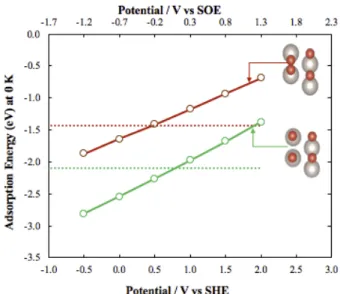
It can be seen in Figure 10 that the adsorption of a bonded oxygen molecule at ocp (dotted red line) is -1.43 eV and decreases to -2.1 eV when the O-O bond breaks (dotted green line). The adsorption energy of intact and dissociated dioxygen decreases with negative potential (decreasing work function) which forms an opposite trend compared to the adsorption energy of the electropositive ethylene. This is in agreement with empirical EPOC rules which state that a decrease in the work function results in an increase in the chemisorptive bond of electron acceptors, e.g., O2 and CO28. The effect of potential on
the adsorption of oxygen and ethylene is directly compared in Figure 1 to highlight the difference between an electron donor and an electron acceptor. The addition of electrons results in a decrease of the electrode potential (and proportionally a decrease of the work function). With this trend, the adsorption of oxygen can be seen to increase (in absolute value) compared to under ocp condition, becoming more stable below a potential value of 0.5 V vs SHE for “intact” O2 and 0.7 V vs SHE for
dissociated O2 (Figure 10).
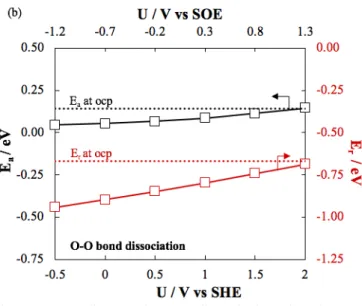
Figure 10: Energy diagram and corresponding activation and reaction energy as a function of energy for O-O bond dissociation over 2Obr/2Ru surface termination of RuO2
(110).
Figure 11 shows the effect of applied potential on the binding energy of oxygen. Not only the adsorption energy but also the activation and reaction energies for oxygen dissociation decrease as a function of decreasing electrochemical potential. Thus, the dissociation of an oxygen molecule is facilitated when applying a negative potential. This decrease in the activation energy is in good agreement with the experimental cathodic reaction rate that showed a higher rate compared to under ocp condition.
The geometries for oxygen dissociation are given in Figure S 21, which shows the oxygen bond dissociation and its transition state. The distance between the two oxygen increased from an initial length of 1.4 Å to a final value of 3.1 Å, passing by 1.7 Å at the transition state.
Figure 11: Energy diagram and corresponding activation and reaction energy as a function of potential for O-O bond dissociation over 2Obr/2Ru surface termination of
RuO2 (110).
4.3. Experimental and DFT results comparison
In conclusion, the increase in the experimental catalytic rate as a function of positive potential can be explained by the facilitation of the C-C bond dissociation, whereas the increase in the catalytic rate as a function of negative polarization is due to the ease in the oxygen bond rupture. Those two potential effects can be correlated to the experimental data of Figure 3c, Furthermore, it should be noticed that the slope of the decreasing activation energy of C-C bond dissociation as a function of increasing potential is higher than that of the O-O bond dissociation as a function of decreasing potential value. This higher change in the activation energy at the positive potential is in agreement with the higher experimental increase in the catalytic rate under anodic potential application compared to the cathodic one. Interestingly enough, if overlaying Figure 7 and Figure 10, it can be seen that the adsorption energy of dissociated ethylene as a function of potential becomes smaller than that at ocp, above 0.7 V vs SHE while the adsorption energy of dissociated oxygen is smaller than that at ocp at potentials below 0.7 vs SHE. In summary, the atomistic origin of the EPOC effect on the ethylene oxidation rate on the surface of ruthenium oxide has therefore been identified to be due to the potential-dependent electric field at the catalyst surface, paralleling results of the effect of the addition of a base for formic acid decomposition 71. This electric
field complements the tuning of the surface state due to the backspillover.
5. Conclusions
For the first time, experimental results for the electrochemical promotion of ethylene oxidation on the surface of RuO2 (110)
have been rationalized using Density Functional Theory (DFT) modeling, explicitly taking into account the effect of the applied electrochemical potential. Experimentally, we obtained an increase in the catalytic rate under anodic and cathodic
potential for the ethylene oxidation over RuO2 nanoparticles. In
order to elucidate the experimental findings, we have studied the adsorption and dissociation of σ-C2H4 on the 2Obr/2Oot
surface termination of RuO2 (110) surface. We found that C2H4
preferably adsorbs on the two Oot atoms via a σ-bonded
structure and that the heat of adsorption produced increases with increasing potential. Concomitantly, the activation energy of the C-C bond dissociation was found to decrease as a function of potential. While under negative potential, the adsorption of oxygen is facilitated and the activation energy of the O-O dissociation decreased. The facilitation of the C-C bond dissociation under positive potential and of the O-O bond dissociation under negative potential, explain the experimentally observed catalytic rate increase under both anodic and cathodic polarization, respectively. Furthermore, these findings are supported by the fact that surface free energy calculation showed that the surface with higher coverage of oxygen became more stable as a function of increasing potential. This is in excellent agreement with the mechanism of oxygen ion back-spillover and the rules of electrochemical promotion of catalysis.
Conflicts of interest
There are no conflicts to declare.
Acknowledgements
The authors thank University of Ottawa, CNRS, and ENS Lyon for support of research conducted within the context of the International Associated Laboratory ‘Fundamental catalysis for green chemistry: From well defined active sites to mechanistic explorations – FUNCAT.’ and Natural Sciences and Engineering Research Council of Canada (NSERC) for financial support. The authors acknowledge Dr M. Couillard from National Research Council (NRC), Canada for STEM measurements. The authors thank the SYSPROD project and AXELERA Pôle de Compétitivité for financial support (PSMN Data Center). The first author thanks NSERC for the Vanier Canada Graduate scholarship support.
References
1 M. Boudart and G. Djega-Mariadassou, Kinetics of
heterogeneous catalytic reactions, Princeton, NJ, 1984.
2 I. M. Campbell, Catalysis at Surfaces, Chapman and Hall, New York, 1988.
3 C. Wagner, Adv. Catal., 1970, 21, 323–381.
4 M. Stoukides and C. G. Vayenas, J. Catal., 1981, 70, 137– 146.
5 C. G. Vayenas, S. Bebelis and S. Neophytides, J. Phys.
Chem., 1988, 92, 5083–5085.
6 C. G. Vayenas, S. Bebelis and S. Ladas, Nature, 1990, 343, 625–627.
7 A. Wieckowski, E. R. Savinova and C. G. Vayenas, Catalysis
and Electrocatalysis at Nanoparticle Surfaces, CRC/ Taylor
& Francis, New York, 2003.
8 C. G. Vayenas, S. Bebelis, C. Pliangos, S. Brosda and D. Tsiplakides, Electrochemical Activation of Catalysis:
Promotion, Electrochemical Promotion, and Metal-Support Interactions, Springer, New York, 2001.
9 C. G. Vayenas, Catal. Letters, 2013, 143, 1085–1097. 10 P. Vernoux, L. Lizarraga, M. N. Tsampas, F. M. Sapountzi, A.
De Lucas-Consuegra, J. L. Valverde, S. Souentie, C. G. Vayenas, D. Tsiplakides, S. Balomenou and E. A. Baranova,
Chem. Rev., 2013, 113, 8192–8260.
11 Y. M. Hajar, K. D. Patel, U. Tariq and E. A. Baranova, J.
Catal., 2017, 352, 42–51.
12 Y. M. Hajar, V. Di Palma, V. Kyriakou, M. A. Verheijen, E. A. Baranova, P. Vernoux, W. M. M. Kessels, M. Creatore, M. C. M. Van De Sanden and M. Tsampas, Electrochem.
commun., 2017, 84, 40–44.
13 Y. M. Hajar, B. Venkatesh and E. A. Baranova, Catalysts, 2018, 9, 48.
14 F. Matei, C. Jimenez-Borja, J. Canales-Vazquez, S. Brosda, F. Dorado, J. L. Valverde and D. Ciuparu, Appl. Catal. B
Environ., 2013, 132–133, 80–89.
15 F. Matei, D. Ciuparu, C. Jiménez-Borja, F. Dorado, J. L. Valverde and S. Brosda, Appl. Catal. B Environ., 2012, 127, 18–27.
16 E. A. Baranova, A. Thursfield, S. Brosda, G. Fóti, C. Comninellis and C. G. Vayenas, J. Electrochem. Soc., 2005,
152, E40–E49.
17 I. Kalaitzidou, T. Cavoué, A. Boreave, L. Burel, F. Gaillard, L. Retailleau-mevel, E. A. Baranova, M. Rieu, J. P. Viricelle, D. Horwat and P. Vernoux, Catal. Commun., 2018, 104, 28–31. 18 I. Kalaitzidou, A. Katsaounis, T. Norby and C. G. Vayenas, J.
Catal., 2015, 331, 98–109.
19 D. Theleritis, S. Souentie, A. Siokou, A. Katsaounis and C. G. Vayenas, ACS Catal., 2012, 2, 770–780.
20 H. A. E. Dole and E. A. Baranova, in Handbook of
Nanoelectrochemistry, eds. M. Aliofkhazraei and H. A. S.
Makhlouf, Springer International Publishing, Cham, 2015, pp. 1–26.
21 A. Katsaounis, J. Appl. Electrochem., 2010, 40, 885–902. 22 I. V. Yentekakis, P. Vernoux, G. Goula and A. Caravaca,
Catalysts, 2019, 9, 157.
23 P. Vernoux, Recent advances in electrochemical promotion
of catalysis, 2017, vol. 29.
24 J. González-Cobos and A. de Lucas-Consuegra, Catalysts, 2016, 6, 15.
25 S. Ladas, S. Kennou, S. Bebelis and C. G. Vayenas, J. Phys.
Chem., 1993, 97, 8845–8848.
26 B. Luerßen, S. Günther, H. Marbach, M. Kiskinova, J. Janek and R. Imbihl, Chem. Phys. Lett., 2000, 316, 331–335. 27 A. Katsaounis, D. Teschner and S. Zafeiratos, Top. Catal.,
2018, 61, 2142–2151.
28 S. G. Neophytides and C. G. Vayenas, J. Phys. Chem., 1995,
99, 17063–17067.
29 M. N. Tsampas, F. M. Sapountzi, A. Boréave and P. Vernoux, Solid State Ionics, 2014, 262, 257–261. 30 J. Poppe, A. Schaak, J. Janek and R. Imbihl, Berichte der
Bunsengesellschaft, 1998, 102, 1019.
31 S. Brosda, T. Badas and C. G. Vayenas, Top. Catal., 2011,
54, 708–717.
32 A. D. Frantzis, S. Bebelis and C. G. Vayenas, Solid State
Ionics, 2000, 136–137, 863–872.
33 M. N. Tsampas, F. M. Sapountzi, A. Boréave and P. Vernoux, Electrochem. commun., 2013, 26, 13–16. 34 I. Constantinou, I. Bolzonella, C. Pliangos, C. Comninellis
and C. G. Vayenas, Catal. Letters, 2005, 100, 125–133. 35 S. Wodiunig, F. Bokeloh, J. Nicole and C. Comninellis,
Electrochem. Solid-State Lett., 1999, 2, 281–283.
36 S. Wodiunig, V. Patsis and C. Comninellis, Solid State Ionics, 2000, 137, 813–817.
37 S. Brosda, C. G. Vayenas and J. Wei, Appl. Catal. B Environ., 2006, 68, 109–124.
38 F. Che, J. T. Gray, S. Ha and J. S. McEwen, ACS Catal., 2017,
7, 551–562.
39 F. Che, J. T. Gray, S. Ha, N. Kruse, S. L. Scott and J. S. McEwen, ACS Catal., 2018, 8, 5153–5174.
40 G. Pacchioni, J. R. Lomas and F. Illas, J. Mol. Catal. A Chem., 1997, 119, 263–273.
41 G. Pacchioni, F. Illas, S. Neophytides and C. G. Vayenas, J.
Phys. Chem., 1996, 100, 16653–16661.
42 E. P. M. Leiva, C. Vázquez, M. I. Rojas and M. M. Mariscal, J.
Appl. Electrochem., 2008, 38, 1065–1073.
43 F. Che, S. Ha and J.-S. McEwen, J. Phys. Chem. C, 2016, 120, 14608–14620.
44 S. González, C. Sousa and F. Illas, Surf. Sci., 2004, 548, 209– 219.
45 J. K. Nørskov, J. Rossmeisl, A. Logadottir, L. Lindqvist, J. R. Kitchin, T. Bligaard and H. Jónsson, J. Phys. Chem. B, 2004,
108, 17886–17892.
46 E. P. M. Leiva and C. G. Sánchez, J. Solid State Electrochem., 2003, 7, 588–592.
47 P. Beatrice, C. Pliangos, W. Worrell and C. Vayenas, Solid
State Ionics, 2000, 136–137, 833–837.
48 E. I. Papaioannou, S. Souentie, F. M. Sapountzi, A. Hammad, D. Labou, S. Brosda and C. G. Vayenas, J. Appl.
Electrochem., 2010, 40, 1859–1865.
49 C. Koutsodontis, A. Hammad, M. Lepage, Y. Sakamoto, G. Fóti and C. G. Vayenas, Top. Catal., 2008, 50, 192–199. 50 J. Nicole and C. H. Comninellis, J. Appl. Electrochem., 1998,
28, 223–226.
51 M. Setvin, C. Franchini, X. Hao, M. Schmid, M. Kaltak, C. G. Van De Walle, G. Kresse and U. Diebold, Phys. Rev. Lett., 2014, 113, 086402.
52 G. Kresse and J. Furthmiiller, Comput. Mater. Sci., 1996, 6, 15–50.
53 S. N. Steinmann and C. Corminboeuf, J. Chem. Theory
Comput., 2011, 7, 3567–3577.
54 S. Gautier, S. N. Steinmann, C. Michel, P. Fleurat-lessard and P. Sautet, Phys. Chem. Chem. Phys., 2015, 17, 28921– 28930.
55 A. Böttcher and H. Niehus, Phys. Rev. B - Condens. Matter
Mater. Phys., 1999, 60, 14396–14404.
56 S. Wendt, A. P. Seitsonen, K. Y. D, M. Knapp, H. Driss and H. Over, Surf. Sci., 2002, 505, 137–152.
57 Y. D. Kim, S. Schwegmann, A. P. Seitsonen and H. Over, J.
Phys. Chem. B, 2001, 105, 2205–2211.
58 H. Over and M. Muhler, Prog. Surf. Sci., 2003, 72, 3–17. 59 P. I. Sorantin and K. Schwarz, Inorg. Chem., 1992, 31, 567–
576.
60 C. W. Outhwaite and L. B. Bhuiyan, J. Chem. Soc. Faraday
Trans. 2 Mol. Chem. Phys., 1983, 79, 707–718.
61 L. B. Bhuiyan, C. W. Outhwaite and D. Henderson, J. Chem.
Phys., 2005, 123, 034704.
62 VASPsol,
https://github.com/henniggroup/VASPsol/blob/master/do cs/USAGE.md.
63 S. N. Steinmann, P. Sautet and C. Michel, Phys. Chem.
Chem. Phys., 2016, 18, 31850–31861.
64 N. G. Hörmann, O. Andreussi and N. Marzari, J. Chem.
Phys., , DOI:10.1063/1.5054580.
65 M. M. Melander, M. J. Kuisma, T. E. K. Christensen and K. Honkala, J. Chem. Phys., , DOI:10.1063/1.5047829. 66 H. Zhang, W. A. Goddard, Q. Lu and M. J. Cheng, Phys.
Chem. Chem. Phys., 2018, 20, 2549.
67 R. Sundararaman, W. A. Goddard and T. A. Arias, J. Chem.
Phys., , DOI:10.1063/1.4978411.
68 S. N. Steinmann and P. Sautet, J. Phys. Chem. C, 2016, 120, 5619–5623.
69 K. Mathew, R. Sundararaman, K. Letchworth-Weaver, T. A. Arias and R. G. Hennig, J. Chem. Phys., 2015, 140, 084106. 70 K. Mathew and R. G. Hennig, arXiv, 2016, 1–6.
71 P. Wang, S. N. Steinmann, G. Fu, C. Michel and P. Sautet,
ACS Catal., 2017, 7, 1955–1959.
72 Q. Gu, P. Sautet and C. Michel, ACS Catal., 2018, 8, 11716– 11721.
73 K. Reuter and M. Scheffler, Phys. Rev. B, 2001, 65, 035406. 74 D. Tsiplakides and C. G. Vayenas, J. Electrochem. Soc.,
2001, 148, E189–E202.
75 S. Trasatti, Pure Appl. Chem., 1986, 58, 955–966.
76 E. A. Baranova, C. Bock, D. Ilin, D. Wang and B. MacDougall,
Surf. Sci., 2006, 600, 3502–3511.
77 Y. M. Hajar, H. A. Dole, M. Couillard and E. A. Baranova,
ECS Trans., 2016, 72, 161–172.
78 H. A. E. Dole, A. Costa, M. Couillard and E. A. Baranova, J.
Catal., 2016, 333, 40–50.
79 Y. M. Hajar, M. S. Houache, U. Tariq, P. Vernoux and E. A. Baranova, Electrochem. Soc., 2017, 77, 51–66.
80 K. Reuter and M. Scheffler, Phys. Rev. B, 2003, 68, 1–11. 81 N. Lopez and G. Novell-Leruth, Phys. Chem. Chem. Phys.,
2010, 12, 12217–12222.
82 Z. Liang, M. Kim, T. Li, R. Rai, A. Asthagiri and J. F. Weaver,
![Figure 1: A schematic representation of ruthenium electrode deposited on O 2- conducting YSZ solid electrolyte, showing the locations of the metal/electrolyte double layer [Oᵟ - δ+]](https://thumb-eu.123doks.com/thumbv2/123doknet/14655569.738488/3.892.118.807.228.414/schematic-representation-ruthenium-electrode-deposited-conducting-electrolyte-electrolyte.webp)