HAL Id: tel-00905316
https://tel.archives-ouvertes.fr/tel-00905316
Submitted on 18 Nov 2013
HAL is a multi-disciplinary open access archive for the deposit and dissemination of sci-entific research documents, whether they are pub-lished or not. The documents may come from teaching and research institutions in France or abroad, or from public or private research centers.
L’archive ouverte pluridisciplinaire HAL, est destinée au dépôt et à la diffusion de documents scientifiques de niveau recherche, publiés ou non, émanant des établissements d’enseignement et de recherche français ou étrangers, des laboratoires publics ou privés.
stimulation using electroencephalographic measurements
in patients suffering from mood disorders
Agata Wozniak-Kwasniewska
To cite this version:
Agata Wozniak-Kwasniewska. Optimisation of repetitive transcranial magnetic stimulation using electroencephalographic measurements in patients suffering from mood disorders. Human health and pathology. Université de Grenoble, 2013. English. �NNT : 2013GRENS015�. �tel-00905316�
Université Joseph Fourier / Université Pierre Mendès France / Université Stendhal / Université de Savoie / Grenoble INP
THÈSE
Pour obtenir le grade de
DOCTEUR DE L’UNIVERSITÉ DE GRENOBLE
Spécialité : Biotechnologie, instrumentation, signal et imagerie pour la biologie, la médecine et l'environnementArrêté ministériel : 7 août 2006
Présentée par
Agata WOŹNIAK-KWAŚNIEWSKA
Thèse dirigée par Olivier DAVIDpréparée au sein du Grenoble Institut des Neurosciences dans l'École Doctorale Ingénierie pour la Santé, la Cognition et l'Environnement
Evaluation de l’excitabilité corticale par
électroencéphalographie pour l'optimisation de
la
stimulation
magn
étique transcrânienne
r
épétée chez les patients souffrant de troubles
de l'humeur
Thèse soutenue publiquement le 7 Octobre 2013, devant le jury composé de :
Mme, Mireille BONNARD
Directeur de recherches, Institut de Neurosciences des Systèmes INS-
INSERM UMR 1106, Aix-Marseille Université Faculté de Médecine, Marseille (Rapporteur)
M., Jean DAUNIZEAU
Chargé de recherches, Institut du Cerveau et de la Moelle épinière, Paris (Rapporteur)
M., Olivier DAVID
Chargé de recherches, Grenoble Institut des Neurosciences (Directeur de thèse)
M., Emmanuel POULET
Service de Psychiatrie des Urgences et Addictologie, Lyon (Examinateur)
M., Thierry BOUGEROL
Profeseur, Faculté de Médecine, Université Joseph Fourier, Grenoble (Examinateur)
M., David SZEKELY
Chef service adjoint,Service de psychiatrie, Centre Hospitalier Princesse Grace, Principauté de Monaco (Invité)
Grenoble Institut des Neurosciences, Bâtiment Edmond J. Safra,
Chemin Fortuné Ferrini, 38700 La Tronche, France
PhD thesis of the Joseph Fourier University, Grenoble
Defended by
Agata
Woźniak-Kwaśniewska
Evaluation of cortical excitability with electroencephalography
recordings for optimizing the repetitive transcranial magnetic
stimulation in patients with mood disorders.
Thesis supervisor: Olivier David
prepared in Grenoble Institute of Neuroscience
defended on
7
thof October 2013
Jury:
Mireille BONNARD
Institut de Neurosciences des Systèmes INS- INSERM UMR 1106, Aix-Marseille Université Faculté de Médecine, Marseille (Reviewer)
Jean DAUNIZEAU
Institut du Cerveau et de la Moelle épinière, Paris (Reviewer)
Olivier DAVID
Grenoble Institut des Neurosciences (Supervisor)
Emmanuel POULET
Service de Psychiatrie des Urgences et Addictologie, Lyon (Examinator)
Thierry BOUGEROL
Faculté de Médecine, Université Joseph Fourier, Grenoble (Examinator)
David SZEKELY
Contents
Acknowledgments ix Abstract x Introduction xiv 1 Depression 2 1.1 Introduction . . . 2 1.2 Neurobiology of depression . . . 3 1.2.1 Dopaminergic pathways . . . 4 1.2.2 Norepinephrine pathways . . . 6 1.2.3 Serotonin pathways . . . 7 1.2.4 Glutamate pathways . . . 91.2.5 Gamma-aminobutyric acid pathways . . . 10
1.3 Neurocognitive models of depression . . . 11
1.3.1 Neural mechanisms of biased attention for emotional stimuli . 11 1.3.2 Neural mechanisms of biased processing of emotional stimuli 12 1.3.3 Integrated neurocognitive model . . . 14
2 Electroencephalography 16 2.1 Introduction . . . 16 2.2 Neural activity . . . 17 2.2.1 Cortical cytoarchitecture . . . 18 2.3 EEG Generation . . . 19 2.3.1 EEG . . . 19 2.3.2 Brain waves . . . 22 2.4 Source localisation . . . 24 2.4.1 Forward problem . . . 25 2.4.2 Inverse problem . . . 27
3 Transcranial Magnetic Stimulation 31
3.1 Introduction . . . 31
3.2 Principles of magnetic stimulation . . . 32
3.3 Targeting rTMS and neuronavigation . . . 36
3.4 Physiology of TMS-induced changes . . . 37
3.4.1 Synaptic plasticity . . . 38
3.4.2 LTD and LTP . . . 39
3.5 rTMS protocols . . . 40
3.5.1 1 Hz rTMS . . . 42
3.5.2 10 Hz rTMS . . . 44
3.5.3 Theta burst stimulation . . . 45
3.6 Functional connectivity and cortical excitability . . . 47
3.7 TMS in the treatment . . . 48
3.7.1 TMS in the treatment of MDD . . . 48
3.7.2 TMS in the treatment of BP depression . . . 53
3.8 Conclusions . . . 54
4 rTMS, EEG and depression 57 4.1 Introduction . . . 57
4.2 Challenges of EEG-rTMS co-registration . . . 58
4.3 EEG changes correlated with mood disorders . . . 59
4.3.1 Quantitative electroencephalography . . . 59
4.3.2 Depressed vs. healthy brain . . . 61
4.3.3 EEG as the predictor of depression treatment . . . 63
4.4 Conclusions . . . 65
5 General methods 67 5.1 Participants, instrumentation and methodology . . . 67
5.1.1 Participants . . . 67
5.1.2 rTMS methodology . . . 70
5.1.3 Self-evaluation of mood changes . . . 72
Contents iii
5.1.5 EEG spectral analysis at the scalp and cortex levels . . . 74 5.1.6 Statistical analyses . . . 76
6 Results 80
6.1 Introduction . . . 80 6.2 Paper I . . . 80 6.3 Paper II . . . 92
7 Conclusions and future works 103
7.1 Conclusions . . . 103 7.2 Future works . . . 107
1.1 Dopaminergic pathways . . . 6
1.2 Noradrenergic pathways . . . 7
1.3 Serotonergic pathways . . . 8
1.4 Cognitive neurobiological model of biased processing . . . 13
1.5 Summary of an integrated cognitive neurobiological model of depression 14 2.1 Diagram of a typical myelinated neuron . . . 17
2.2 Neocortex . . . 20
2.3 Micro current sources . . . 21
2.4 EEG 10-20 system . . . 22
2.5 Head models . . . 27
2.6 Forward and inverse problem . . . 27
3.1 Current flows in TMS coil . . . 33
3.2 Types of coils . . . 33
3.3 H-coil . . . 34
3.4 Iron core coil . . . 34
3.5 TMS-induced electric fields . . . 35
3.6 Neuronavigation . . . 37
3.7 TMS protocols . . . 42
3.8 Increase of rCBF after 20 Hz TMS . . . 50
3.9 Decrease of rCBF after 1-Hz TMS . . . 51
3.10 rTMS effects on brain function . . . 53
5.1 Description of rTMS protocols . . . 71
Acronyms
5-HT serotonin
ACC dorsal anterior cingulate cortex
AMPA α-amino-3-hydroxy-5-methylisoxazole-4-propionic acid
AMT active motor threshold
AP action potential
APB abductor pollicis brevis
BA Brodman area
BEM boundary element method
BOLD blood oxygen level-dependent
BP bipolar
CNS central nervous system
CSF cerebrospinal fluid
cTBS continuous theta burst stimulation
DA dopamine
DC direct current
DCM dynamic causal modeling
DIS distributed inverse solutions
DLPFC dorsolateral prefrontal cortex
ECT electroconvulsive therapy
EPSP excitatory postsynaptic potential
ERPs event-related potentials
FDM finite difference method
FEM finite-element method
fMRI functional magnetic resonance imaging
GABA gamma-aminobutyric acid
HDRS Hamilton depression rating scale
HFS high frequency stimulation
ICA independent component analysis
ICF intracortical facilitation
IPSP inhibitory postsynaptic potential
ISIs inter-stimulus intervals
iTBS intermittent theta burst stimulation
LAURA local autoregressive average
LC locus coeruleus
LORETA low resolution electrical tomography
LTD long-term depression
LTP long-term potentiation
MDD major depressive disorder
MEG magnetoencephalography
MEP motor evoked potential
Acronyms vii
MRI magneting resonanse imaging
MSP multiple sparse priors
MT motor threshold
NAc nucleus accumbens
NE norepinephrine
NMDA N-methyl-D-aspartate
NREM non-REM
PET positron emission tomography
PFC prefrontal cortex
PSP postsynaptic potential
qEEG quantitative electroencephalography
rACC rostral anterior cingulate cortex
rCBF regional cerebral blood flow
REM rapid eye movement
RMT resting motor threshold
rTMS repetitive transcranial magnetic stimulation
SICI short intracortical inhibition
sLORETA standardized low resolution brain electromagnetic tomography
SPC superior parietal cortex
SSRI serotonin reuptake inhibitor
STDP spike timing-dependent plasticity
TCAs tricyclic antidepressants
TMS transcranial magnetic stimulation
VAS visual analogue scale
VLPFC ventrolateral prefrontal cortex
Acknowledgments
I would not be able to write this thesis without the help and support of many people during these three years.
First of all, I would like to thank Oliver David – my supervisor, who gave me the opportunity to take up this PhD project. He dedicated a significant amount of his time to guide me sharing his impressive knowledge and experience.
I sincerely thank David Szekely, for guiding me through TMS and neuronaviga-tion techniques. And for all necessary lessons and explananeuronaviga-tions about depression.
I would also like to thank the staff of Psychiatry Department of CHU for their friendly and useful help during EEG-TMS recordings with patients.
This work could not have been done without TMS hardware provided by Pr. Christian Marendaz. Thank you Christian for charing with us all the equipment.
I would also like to thank Sylvain Harquel, the engineer who helped me a lot during EEG sessions with patients. Sylvain, without you it would last twice longer. Additionally, many thanks to participants, especially healthy once. Without you it would not be possible at all. And thank you for your time!
I am deeply thankful to my dear friend, C`eline Tisseyre, for translating abstracts from English to French. C`eline, you were very helpful.
I would like to thank my family who helped and supported me from the very beginning of this project. Without them it would be much more difficult. I am deeply grateful to my mother, who always supported me and believed in me, making me the person I am now.
Finally, I would like to express my gratitude to my beloved husband, Pawel, for his understanding, courage and support. Especially for his help with programming and our fruitful discussions about my project. And of course, my daughter Zuzanna, whose bright smile overcomes all fatigue. And for her intriguing questions about the brain anatomy.
Transcranial magnetic stimulation (TMS) is a non-invasive technique for stim-ulating the brain. A brief electric current passing through a magnetic coil produces a brief, high-intensity magnetic field which stimulates the brain. Repetitive TMS, application of many magnetic pulses, is able to induce relatively long-lasting ex-citability changes and nowadays is being developed for various therapeutic and sci-entific purposes. The after-effects of rTMS over motor cortex are well documented in healthy individuals, however less is known about the stimulation of dorso-lateral prefrontal cortex (DLPFC).
The aim of this PhD thesis was to compare different rTMS protocols in healthy subjects and to find neurophysiological EEG biomarkers characteristic for response or not to rTMS therapy in major and bipolar depression. The main originality of presented method is within-subject comparison of between-protocols effects. Addi-tionally, source localisation was performed in both analyses.
Here, we studied in 20 healthy subjects how cortical oscillations are modulated by four different active rTMS protocols (1 Hz, 10 Hz, cTBS and iTBS) of the left DLPFC, and by a sham-1Hz protocol used as a control condition, by comparing the spectral power of pre- and post-rTMS electroencephalographic (EEG) recordings of 15 minutes duration. EEG spectrum was estimated with the Fast Fourier transform (FFT) and partitioned using the common physiological frequency.
We found for every active protocol a significant decrease of delta and theta power on left prefrontal electrodes, mainly localised in the left DLPFC. In higher frequency bands (beta and gamma), the decrease of power in the DLPFC was also observed additionally in the contralateral DLFPC and depended on the stimulation protocol. Because large delta and theta activity is usually associated with cortical inhibition, these results suggest that rTMS of DLPFC transiently decreases local cortical inhibition. Furthermore, fast EEG oscillations are associated to cortical
xi
excitability and it can be concluded that observed decreases in fast activity, unspe-cific to protocol, localised in the DLPFC also suggest reduced cortical excitability, which accompanies a decrease in cortical inhibition.
In the second experiment we worked on two subgroups of patients, with major depressive disorder (MDD) and bipolar disorder (BP). In this open study we aimed to examine whether there are EEG differences in resting brain activity between BP and MADD patients, and between responders and non-responders to 10 Hz repeti-tive transcranial magnetic stimulation (rTMS) by studying EEG biomarkers.Eight MDD (6 females) and 10 BP patients (6 females) were included. The 10 Hz rTMS protocol was the same for MDD and BP. The different patterns of EEG activity in both depressive disorders were studied, by comparing spectral power of pre- and post-rTMS EEG recordings throughout the therapeutic sessions in responders and non-responders.
The most important finding is that it is possible to distinguish responders from non-responders to the rTMS treatment. Responders showed significantly higher power of low frequencies. Therefore, an increase of alpha power was observed in ventral cingulate cortex in both groups. The comparison of MDD and BP disorders revealed significantly higher activity in theta and beta bands power in BP patients, mainly localised in prefrontal cortex.
The results of multiple regression analysis revealed that alpha band power on the left fronto-temporal regions was significantly and negatively correlated with ∆MADRS. Additionally, we found positive correlation of ∆MADRS and theta band power in the posterior midline areas. We can suggest that both EEG features could be used as biomarkers to predict rTMS outcome.
Keywords:
La stimulation magn´etique transcranienne (SMT) est une technique non inva-sive qui permet de stimuler le cerveau. Les SMT r´ep´etitives (SMTr), c’est-`a-dire l’application de nombreuses impulsions magn´etiques, sont capable d’induire des modifications de longue dur´ee de l’excitabilit´e neuronale. La SMT s’est d´evelopp´ee dans un but th´erapeutique et scientifique. Les effets apr`es la SMTr sur le cortex moteur sont bien document´es chez les individus sains, mais on en sait moins sur la stimulation du cortex pr´efrontal dorso-lat´eral (DLPFC).
L’objectif de cette th`ese ´etait de comparer diff´erents protocoles SMTr sur des sujets sains et de trouver des marqueurs ´electroenc´ephalograpiques (EEG) de la r´eponse ou pas `a la th´erapie SMTr dans la d´epression majeure et bipolaire. La principale originalit´e de la m´ethode pr´esent´ee est la comparaison intra-sujet d’effets entre-protocoles et le d´eveloppement de techniques de localisation de sources.
Nous avons ´etudi´e chez 20 sujets sains comment les oscillations corticales sont modul´ees suite `a quatre protocoles SMTr actifs diff´erents, et `a un protocole sham utilis´e comme contrˆole, du DLPFC gauche et en comparant la puissance spectrale d’EEG avant et apr`es SMTr de dur´ee de 15 minutes. Le spectre EEG a ´et´e estim´e grˆace `a la transform´ee de Fourier rapide (FFT) et partitionn´e en bandes de fr´equence selon la classification commune.
Nous avons trouv´e pour chaque protocole actif une diminution significative de puissance delta et theta sur les ´electrodes pr´efrontales gauches, principalement lo-calis´ees dans le DLPFC gauche. Dans des bandes de fr´equences plus hautes, la diminution de puissance dans le DLPFC a ´et´e de plus observ´ee dans le DLFPC controlat´eral et d´epend du protocole de stimulation. Parce que les activit´es delta et theta sont g´en´eralement associ´ees `a l’inhibition corticale, ces r´esultats sugg`erent que la SMTr du DLPFC diminue transitoirement l’inhibition corticale locale. Aussi, les oscillations d’EEG rapides sont associ´ees `a l’excitabilit´e corticale et on peut con-clure que des diminutions observ´ees non sp´ecifiques dans l’activit´e rapide localis´ee dans le DLPFC sugg`erent ´egalement une r´eduction de l’excitabilit´e corticale.
xiii
Dans la deuxi`eme exp´erience, nous avons travaill´e sur groupe de patients, souf-frant de trouble d´epressif majeur (MDD) et de trouble bipolaire (BP). Dans cette ´etude ouverte, nous avons cherch´e `a d´eterminer s’il existe des diff´erences d’EEG de repos dans l’activit´e c´er´ebrale entre patients BP et MDD, et entre les r´epondeurs et non-r´epondeurs `a la SMTr `a 10 Hz en ´etudiant des biomarqueurs d’EEG. Le protocole SMTr `a 10 Hz ´etaient le mˆeme entre patients MDD et BP. Les pro-pri´et´es EEG dans les deux troubles d´epressifs ont ´et´e ´etudi´ees, en comparant la puissance spectrale des enregistrements pr´e- et post-SMTr EEG au cours des ses-sions th´erapeutiques chez les patients r´epondeurs et non-r´epondeurs.
La conclusion est qu’il est possible de distinguer les r´epondeurs des non-r´epondeurs au traitement SMTr. Les r´epondeurs avaient une puissance en basse fr´equence plus importante. Une augmentation de puissance alpha a aussi ´et´e observ´ee au niveau du cortex cingulaire ventral dans les deux groupes. La comparaison des MDD et BP a r´ev´el´e une activit´e significativement plus ´elev´ee dans la puissance des bandes thˆeta et bˆeta chez les patients BP, principalement localis´ee dans le cortex pr´efrontal. Les r´esultats de l’analyse de r´egression ont r´ev´el´e que la puissance de la bande al-pha sur les r´egions fronto-temporales gauches ´etait significativement et n´egativement corr´el´ee avec le score clinique de d´epression (MADRS). En outre, nous avons trouv´e une corr´elation positive du score MADRS et de la puissance de la bande thˆeta dans les zones m´edianes post´erieures. Nous pouvons sugg´erer que les deux car-act´eristiques EEG pourraient ˆetre utilis´es comme marqueurs pour pr´edire les r´esultats SMTr.
Les mots cl´es:
Nowadays, transcranial magnetic stimulation (TMS) is a very popular tool widely used to stimulate the brain non-invasively. The application of many pulses (repetitive TMS, rTMS) can modulate brain’s activity during peri-ods that outlast the stimulation time and additionally has a therapeutic po-tential in treating neurological and psychiatric disorders such as depression [Dell’Osso 2009, George 2010, Richieri 2011], schizophrenia with auditory halluci-nations [Hasan 2013, Homan 2012], migraines [Brigo 2012, Magis 2012] or stroke [Hummel 2008, Jung 2012, Hummel 2012]. Depending on the stimulation param-eters, it has different influence on the brain. The main stimulation parame-ters are the frequency of stimulation and the temporal structure of the pulses, i.e. whether the series of pulses are applied continuously or not [Classen 2008]. The easiest way to estimate the influence of the TMS on the neuronal activ-ity is to stimulate over the motor cortex. Then, it is possible to record the response as motor evoked potentials (MEPs) on peripheral muscles. Numerous studies of electromyographic (EMG) recordings showed that in most cases low-frequency stimulation (≤ 1 Hz) produces lasting decrease in motor cortex ex-citability, whereas high-frequency stimulation (≥ 5 Hz) induces facilitatory effects [Romero 2002, Hayashi 2004, Houdayer 2008, Di Lazzaro 2011, Noh 2012]. Regard-ing theta burst stimulation (TBS, burst of three 50 Hz pulses repeated every 200 ms), it is also possible to obtain two opposite results, where the after-effects depend on bursts application. If stimulation is delivered continuously (cTBS) it has an in-hibitory effect, whereas when delivered as an intermittent TBS (iTBS) the effect is excitatory [Huang 2005, Hoogendam 2010].
Although the rTMS-effects over the motor cortex are well documented, less is known about the stimulation over the dorso-lateral prefrontal cortex (DLPFC). In this case, the rTMS pulses do not spread through the cortico-spinal pathways
xv
and must be measured with other technique, electroencephalography (EEG). Using EEG, it is possible to measure directly from the scalp the rTMS after-effects and to investigate how rTMS pulses propagate in the brain network. Additionally, EEG brought important information about depression and various studies have found that typically 20% to 40% of depressed patients have EEG abnormalities, with several characteristics and controversial patterns [Coburn 2006]. Moreover, up to 80% of psychiatric patients present various quantitative EEG (qEEG) abnormalities on contrary to only 10% of healthy subjects [Begic 2011, Coburn 2006].
Generally, there are two main types of depression, major depressive disorder (MDD) and bipolar disorder (BP). Although a physiopathology of these two types of depression is due to distinct neuropathologies, the clinical symptoms are some-times difficult to distinguish between depressive symptoms. In this perspective, the possibility to predict treatment response in mental health disorders with biomark-ers became very important clinical issue. Different pre-treatment EEG parametbiomark-ers were tested as possible biomarkers, and alpha and theta bands were reported as the most valuable indices to differentiate responders from non-responders.
There are two main aspects of this work. First, concurrent EEG-rTMS were recorded on healthy subjects maintained at rest and awake, and the aim was to investigate how cortical oscillations are modulated by four different active rTMS protocols (1 Hz, 10 Hz, cTBS and iTBS) of the left DLPFC, and by a sham protocol used as a control condition. Spectral power of pre- and post-rTMS EEG recordings was compared on the scalp and cortical sources levels.
The second part is devoted to research on patients. Here, the aim was to examine whether it is possible to distinguish BP from MDD patients, and responders from non-responders to 10 Hz repetitive transcranial magnetic stimulation by studying EEG biomarkers of resting state brain activity. This was also done at both scalp and cortical sources levels.
The thesis is organized as follows:
– The first chapter introduces the general informations about depression. Clas-sification of depression and its neurobiological basis with neurotransmitters’ pathways are described.
– Second chapter gives a detailed description of EEG technique. The neural activity and cortical cytoarchitecture are briefly discussed. Next, EEG brain waves and source localisation method which are used in this thesis are ad-dressed.
– The main technique used in this study, repetitive transcranial magnetic stim-ulation, is described in the third chapter. There is a description of physical principles of magnetic stimulation and of physiology of elicited brain activity changes, followed by long-term depression and potentiation definitions. Next, rTMS protocols which has been used in this work are discussed. Functional connectivity and cortical excitability with neuronavigation technique are ad-ditionally described. Also, an overview of current use of rTMS in the clinical applications is presented.
– The fourth chapter brings together the EEG-rTMS co-registration. The chal-lenges of EEG-rTMS co-registration and the overview of EEG changes cor-related with mood disorders are presented. There is also a comparison of differences in brain oscillations between healthy and depressed individuals. Finally, EEG is presented as a plausible predictor of depression treatment. – Chapter five describes the experimental design and the data processing used
in this thesis.
– The results are presented in chapter six. There are short introductions and manuscripts of two articles submitted to NeuroImage. The first paper is in re-vision and the second one is about to be submitted. Presented papers describe results for EEG-rTMS co-registration on healthy and depressed patients, sep-arately.
– The last chapter, the seventh one, includes a discussion of presented results and gives an introduction to the next steps of this project.
R´
esum´
e du Chapitre 1
Dans le chapitre suivant, je pr´esenterai la classification de la d´epression ainsi que l’un de ses mod`eles. Je d´ecrirai ´egalement la neurobiologie de la d´epression ainsi que le rˆole de certains neurotransmetteurs tels que la dopamine, la nor´epin´ephrine, la s´erotonine, le glutamate et l’acide gamma-aminobutyrique. Je terminerai en pr´esentant le lien entre l’absence ou le dysfonctionnement de certains neurotrans-metteurs et les symptˆomes caract´eristiques de la d´epression.
Depression
Contents 1.1 Introduction . . . 2 1.2 Neurobiology of depression . . . 3 1.2.1 Dopaminergic pathways . . . 4 1.2.2 Norepinephrine pathways . . . 6 1.2.3 Serotonin pathways . . . 7 1.2.4 Glutamate pathways . . . 9 1.2.5 Gamma-aminobutyric acid pathways . . . 10 1.3 Neurocognitive models of depression . . . 11 1.3.1 Neural mechanisms of biased attention for emotional stimuli . 11 1.3.2 Neural mechanisms of biased processing of emotional stimuli 12 1.3.3 Integrated neurocognitive model . . . 141.1
Introduction
Brain disorders, including depression and bipolar disorder, are among the lead-ing causes of disability worldwide. Underlylead-ing pathophysiological mechanisms are still largely unknown and they are among the most mysterious of brain diseases.
One of these affective disorders is depression. Depression is defined as a state of sadness, low mood accompanied by low self-esteem, loss of interest in activities that once were pleasurable and reduced capabilities to concentrate or decide. It is also characterised by altered emotional and cognitive functioning [APA 2000]. Depressed mood is not necessarily a psychiatric disorder. It is related to a normal reaction to certain life events, a symptom of some medical conditions, and a side effect of some
1.2. Neurobiology of depression 3
medical treatments. But, depressed mood is also a primary or associated feature of certain psychiatric syndromes such as clinical depression. Classic severe states of depression, however, often have no dramatic external causes.
Depression classification includes:
– major depressive disorder (MDD), also referred to as major depression, unipolar depression or clinical depression. In this case a person has one or more major depressive episodes.
– bipolar (BP) depression, also known as “maniac depression”, is described by alternating periods of depression and mania. Depending on how rapidly the mood changes occur, the episodes of bipolar disorder can also be classified as rapid cycling, mixed or with psychotic symptoms. This type of disorder has been subdivided into:
– Bipolar I requires the presence or history of at least one manic episode with or without major depressive episodes.
– Bipolar II consists alternating episodes of major depression and hypoma-nia. In this type of disorder, the “manic” moods never reach full mahypoma-nia. The less-intense elevated moods in bipolar II disorder are called hypomanic episodes, or hypomania.
– Cyclothymia is a mild-form of bipolar disorder, consisting of less severe mood swings. Episodes alternate between hypomania and mild depression, but no full manic episodes or full major depressive episodes.
– Mixed episode is the simultaneous presence of elements of the manic line and clinical elements of depressive line during a single episode.
1.2
Neurobiology of depression
The pathophysiology of depression has not been clearly understood, but so-cial, psychological, and biological factors all play an important role in depression [Goldman 1999]. Previous studies point out evidences that there is an association of specific symptoms and features of depression and dysfunction or deficit of cer-tain neurotransmitters [Nutt 2008]. One of the oldest hypothesis, the monoamine
hypothesis, suggests disturbances in serotonin (5-HT), norepinephrine (NE), and dopamine (DA) neurotransmission in the central nervous system [Belmaker 2008, Krishnan 2008]. Hence, reduced NE neurotransmission is associated with low en-ergy, decreased alertness, problems with concentration and cognitive ability. Lack-off 5-HT is related to anxiety, obsessions and compulsions, while increased 5-HT activity can be associated with certain symptoms such as fatigue [Marin 2005]. Dys-functional DA activity is linked with problems of motivation, reward, psychomo-tor speed, concentration and the ability to experience pleasure and interest in life [Cowen 2008]. The role of NE [Delgado 2000, Nutt 2008] and DA [Dunlop 2007, Montgomery 2008] has been less extensively studied, than 5-HT role.
This suggests that specific antidepressant drugs can target symptom-specific neurotransmitters, because specific symptoms of depression could be assigned to specific neurochemical mechanisms. Nowadays, all available antidepressants act on one or more of the following mechanisms: antagonism of inhibitory presynaptic 5-HT or NE receptors, or inhibition of monoamine oxidase, or inhibition of reuptake of DA and 5-HT or NE. All of these mechanisms result in an enhanced neuro-transmission of 5-HT and/or NE. However, most antidepressant treatments do not directly enhance DA neurotransmission.
Abnormal metabolism in limbic and paralimbic structures of the prefrontal cor-tex is associated with major depression. Patients with MDD have different symp-toms of depression, which implies that they may all have different malfunctioning circuits. According to Stahl [Stahl 2003b, Stahl 2003a, Stahl 2003c, Stahl 2004], it is interesting to look at the brain neuroanatomy in terms of specific functional centers. The “emotional” and “somatic” networks receive input from both, NE and 5-HT, as well as DA systems. On the other hand, the “cognitive” centers receive in-formation only from NE, DA and histaminergic pathways, but not 5-HT projections (Table 1.1).
1.2.1 Dopaminergic pathways
In the brain, dopamine plays an important role in the regulation of reward and movement. Dopaminergic neurons are organized into four major DA pathways
1.2. Neurobiology of depression 5
Table 1.1: Neurological projections of DA, NE and 5-HT to different brain regions [Drevets 2002].
Emotional systems
NE projections from the locus coeruleus to the hypothalamus
NE projections from the locus coeruleus to the amygdala and prefrontal cortex 5-HT projections from the midbrain raphe to the hypothalamus
5-HT projections from the midbrain raphe to the amygdala and prefrontal cortex DA projections from the ventral tegmentum to the nucleus accumbens
Somatic systems
NE projections from the locus coeruleus to the hypothalamus NE projections from the locus coeruleus to the cerebellum NE projections from the locus coeruleus to the spinal cord 5-HT projections from the midbrain raphe to the hypothalamus 5-HT projections from the midbrain raphe to the striatum 5-HT projections from the midbrain raphe to the spinal cord DA projections from the substantia nigra to the striatum Cognitive systems
NE projections from the locus coeruleus to the dorsolateral prefrontal cortex DA projections from the ventral tegmentum to the dorsolateral prefrontal cortex Histamine projections from the hypothalamus to the dorsolateral prefrontal cortex
depicted in Figure 1.1 [Dunlop 2007, Schatzberg 2004]:
1. The nigrostriatal system, which is linked with regulation of movement, origi-nates in substantia nigra pars compacta and projects to the dorsal striatum (putamen and caudate).
2. The mesocortical system is important for concentration and executive func-tions such as working memory. This DA pathway originates in the VTA and its fibers arise to the frontal and temporal cortices, particularly the entorhinal, prefrontal and anterior cingulate cortices.
experi-ence of pleasure and reward. It also arises in VTA, but release dopamine into the ventral striatum, nucleus accumbens, bed nucleus of the stria terminalis, hippocampus, amygdala and septum.
4. The tuberoinfundibular system regulates the secretion of prolactin from the anterior pituitary. It originates in the arcuate nucleus of the mediobasal hypothalamus that projects to the median eminence.
Figure 1.1: Major dopaminergic pathways in the human brain [Dunlop 2007, Schatzberg 2004]
1.2.2 Norepinephrine pathways
The recent studies [Cowen 2008, Moret 2011] on depression and neuronal path-ways indicated the specific role of the norepinephrine in the depressive disorders. Norepinephrine (NE) implicates the regularization of emotions and regulates such executive function as cognition, motivation, and intellect, which are fundamen-tal in social relationships. Norepinephrine is produced in the cell bodies of the
1.2. Neurobiology of depression 7
locus coeruleus (LC) and reaches to a variety of different structures, such as cere-bral cortex, thalamus, cerebellar cortex, hippocampus, hypothalamus and amygdala [Moret 2011]. Components of the limbic system (hippocampus, hypothalamus and amygdala) are affected in a number of functions which are modified in depression such as emotion and cognition, response to pain, level of pleasure, appetite, sex-ual satisfaction and aggressive behaviour [Drevets 2002]. Figure 1.2 illustrates the noradrenergic projections throughout the brain.
Figure 1.2: The noradrenergic pathways in the human brain [Moret 2011, Schatzberg 2004]
1.2.3 Serotonin pathways
Serotonin (5-HT) is a neurotransmitter derived enzymatically from tryptophan and produced in neurons of the rostral and caudal raphe nuclei. Projections aris-ing from the raphe nuclei are widespread and stimulate many of forebrain struc-tures including the hypothalamus, amygdala, basal ganglia, thalamus,
hippocam-pus, cingulate cortex and prefrontal cortex. The serotoninergic system controls numerous physiological and behavioural functions. It also modulates mood, emo-tions, sleep, appetite, memory and learning, temperature regulation and some so-cial behaviors. The 5-HT hypothesis of depression proposes that decreased sero-toninergic neurotransmission plays a key role in the pathophysiology of depres-sion. The concentration of synaptic serotonin is controlled directly by its reuptake into the pre-synaptic terminal and, thus, drugs blocking serotonin transport have been successfully used for the treatment of depression [Coppen 1967, Cowen 2008, Schatzberg 2004, Schloss 1998]. Figure 1.3 illustrates the major serotonin-producing structures.
1.2. Neurobiology of depression 9
1.2.4 Glutamate pathways
The most popular monoamine theory of the pathophysiology of major depres-sion and bipolar illness has involved abnormalities in NE and 5-HT and contributed greatly to our understanding of mood disorders and their treatment. Neverthe-less, this theory does not fully explain the fact that >40% patients fail to achieve full remission following treatment with conventional antidepressants, raising the possibility that other neurotransmitter systems may also contribute to the patho-physiology of mood disorders and the mechanism of antidepressant action. Recent studies have provided strong evidence that glutamate and other amino acid neuro-transmitters are involved in the pathophysiology and treatment of mood disorders [Kugaya 2005].
The end of this section reviews studies suggesting that the glutamatergic and gamma-aminobutyric acid (GABA)-ergic systems are altered in mood disorders and contribute to the mechanism of antidepressant action for several treatment modalities.
Glutamate is the major excitatory neurotransmitter which plays a key role in synaptic plasticity, learning and memory. Effects of action are mediated by a large variety of glutamate receptor subtypes which include three major groups of excita-tory ionotropic receptors: N-methyl-D-aspartate (NMDA) receptor, the α-amino--3-hydroxy-5-methylisoxazole-4-propionic acid (AMPA) receptor, and the kainate receptor.
Alterations of the glutamatergic system in mood regulation has been investi-gated for several years. Early studies measuring plasma or serum glutamate lev-els in depressed patients yielded interesting but inconsistent results. Increased serum glutamate concentrations in medicated patients was first reported in the research of Kim and colleagues [Kim 1982]. Then, Altamura obtained the same results, but this group was later unable to replicate this finding in unmedicated pa-tients [Altamura 1993]. Next, Maes and colleagues [Maes 1998] also showed elevated plasma and platelet glutamate levels in depressed subjects. However, in contrast to the previous studies, they found no baseline abnormality in serum glutamate
levels, but did report that glutamate levels were reduced after antidepressant treat-ment. Other studies revealed no significant difference in frontal cortex glutamate levels of antemortem glutamate in neurosurgical samples from depressed subjects [Francis 1989].
A recent study by Sanacora and colleagues [Sanacora 2004] showed glutamate levels in the occipital cortex to be significantly elevated, in medication-free pa-tients with MDD, as compared with healthy controls. Another interesting point of this study is that the glutamate levels were significantly increased in patients with melancholic depression subtype than those with no subtype as compared with con-trols. However, patients with atypical depression did not have significantly different glutamate levels than controls. The glutamate levels were inversely correlated with GABA levels in studied occipital cortex.
1.2.5 Gamma-aminobutyric acid pathways
Gamma-aminobutyric acid (GABA) is the major inhibitory neurotransmitter in the central nervous system (CNS). In recent decades alteration of GABAergic neurotransmission in mood disorders has been widely studied.
In 1980 Gold et al. [Gold 1980] revealed that GABA concentrations in lumbar cerebrospinal fluid (CSF) in depressed patients were significantly decreased compar-ing to nondepressed control group, and since then the results have been replicated in several studies. Petty and coworkers [Petty 1981, Petty 1984] showed that GABA plasma concentrations were reduced in depressed patients as well. Moreover, Honig et al. [Honig 1988] reported that GABA concentrations in brain tissue from pa-tients undergoing cingulotomy for intractable depression were inversely correlated with severity of depression.
More recent studies employing magnetic resonance spectroscopy also suggest that unipolar, but not bipolar, depression is associated with reductions in cortical GABA levels. Sanacora and colleagues [Sanacora 1999, Sanacora 2004], addition-ally, found reduction in cortical GABA levels in patients with melancholic subtype of depression, with the ratio of glutamate to GABA significantly higher in the pa-tients than the controls. This finding suggests a potential alteration in the common
1.3. Neurocognitive models of depression 11
metabolic pathway that couples the two systems of glutamate and GABA.
1.3
Neurocognitive models of depression
In the following sections I will describe recent studies on the functional and structural neurobiological mechanisms associated with depression.
1.3.1 Neural mechanisms of biased attention for emotional stimuli
The main point of the cognitive model of depression is the inability to allocate attention to appropriate emotional cues [Disner 2011]. Attention towards positive and negative stimuli is different between healthy and depressed subjects. On con-trary to healthy individuals whose attention is generally biased towards positive stimuli, depressed patients show an attentional bias for negative thoughts.
The intraparietal sulcus, precentral sulcus, superior temporal sulcus, prefrontal cortex (PFC) and areas which control shifts in gaze are associated with attention in healthy individuals. These areas help to select competing visual stimuli represented in the visual cortex and healthy subjects are able to switch attention from one to another stimuli. As functional magnetic resonance imaging (fMRI) studies revealed the act of attentional disengagement requires top-down connection from high-order cortical structures such as dorsolateral prefrontal cortex (DLPFC) (related to exec-utive functions), ventrolateral prefrontal cortex (VLPFC) (related to control over stimulus selection) and superior parietal cortex (SPC) (associated with shifts in gaze) [Fales 2008, Passarotti 2009, Beevers 2010]. Increased attention for negative stimuli in people with depression may stem from an impaired ability to inhibit at-tention for negative stimuli, which is related to decreased activity in right VLPFC, DLPFC and SPC. Functional MRI results indicated that inhibitory processing is associated with activity in the rostral anterior cingulate cortex (rACC) [Bush 2000, Shafritz 2006]. Healthy subjects showed higher rACC activity inhibiting attention to positive stimuli, whereas depressed patients showed greater activation inhibiting negative thoughts [Disner 2011, Elliott 2002, Eugene 2010, Mitterschiffthaler 2008].
1.3.2 Neural mechanisms of biased processing of emotional stimuli
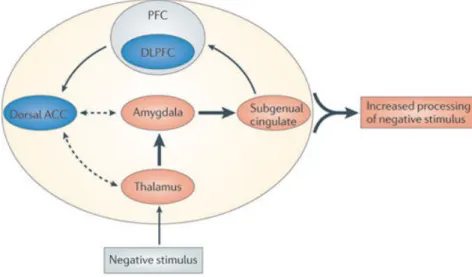
The amygdala is known to be involved in the processing of emotions and in the interpretation of the emotional aspect of stimuli. According to Davidson and Drevets [Davidson 2000, Drevets 2001] it is controlled partially by indirect inhibitory connection from the left DLPFC (Figure 1.4). In depressed patients hyperactivity of left amygdala and putamen is associated with faster processing of negative stimuli. This reactivity creates a bottom-up connection which distorts stimulus processing in higher cortical areas.
Recent neuroimaging studies identified functional abnormalities also in the DLPFC. Compared with nondepressed human being, patients with depression have decreased left prefrontal gray matter volume [Li 2010, Lopez-Larson 2002, Adler 2005], lower resting-state activity and reduced reactivity for positive and negative stimuli [Gotlib 2008]. Moreover, altered function in the DLPFC is cor-related with decreased cognitive control [Disner 2011, Gotlib 2008, Hooley 2005, Schaefer 2006, Siegle 2002]. Abnormalities in negative emotional information pro-cessing are caused, in addition, by abnormalities in the thalamocortical pathway, which is responsible for processing and organizing external stimuli [LeDoux 1996, Greicius 2007]. This pathway is composed of the thalamus, involved in transmit-ting the afferent signals [Guillery 1995, Sherman 2002], the dorsal anterior cingu-late cortex (ACC), an area that sends top-down cognitive control to the DLPFC [Ochsner 2005], and the subgenual cingulate cortex, a region that integrates emo-tional feedback from the limbic system and projects to higher-order cognitive struc-tures (Figure 1.4) [Greicius 2007].
Discussed researches indicated that people with depression experience a positive blockage, which means that the capacity to process positive thoughts is decreased, whereas it is increased for negative ones. Moreover, it was shown in previous stud-ies [Arco 2008, Kim 2007, Wager 2008] that in healthy individuals the PFC regu-lates the activity of the nucleus accumbens (NAc) and amygdala, and in particular the release of dopamine in this area of the brain. In depressed patients, reduced NAc responses to rewards are associated with diminished volume and activity in
1.3. Neurocognitive models of depression 13
the caudate nucleus. This suggests that rewarding properties associated with a stimulus may not be accurately classified [Disner 2011, Epstein 2006, Heller 2009, Pizzagalli 2009]. As a result, positive stimuli may fail to activate reinforcement mechanisms, which could reduce the ability of depressed patients to pursue re-warding behaviours [Disner 2011]. Based on this evidence, Disner and colleagues [Disner 2011] suggested, that the inability of depressed human being to adaptively alter reward-seeking behaviour is associated with reduced reward sensitivity of the NAc due to decreased PFC activity.
To conclude, there are several mechanisms which increase the projection of nega-tive thoughts and decrease the posinega-tive or rewarding stimuli (Figure 1.4). They are: amygdala hyperactivity, hypoactivity in the DLPFC and attenuated NAc response.
Figure 1.4: Hypothetical cognitive neurobiological model of biased processing of negative stimuli in depressed human beings. Negative input stimulus induce hyperactivity (orange) in the thalamus, from the thalamus to the amygdala and onto the subgenual cingulate cortex, which transmits limbic activity to higher cortical regions such as the PFC. Concurrently, hypoactivity (blue) in the DLPFC is associated with attenuated cognitive control, which impairs the ability of the dACC to adaptively regulate the lower regions. As result, awareness and conscious processing of negative stimuli in the environment is increased. Solid arrows (which show intact associations) and dashed arrows (which show attenuated associations) are intended to represent functional connections, not necessarily direct anatomical connections. Thicker arrows show increased information flow. [Disner 2011]
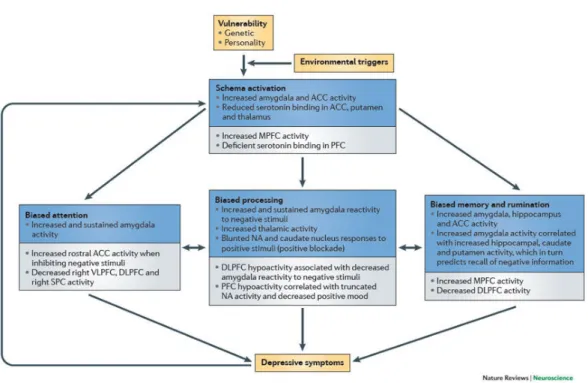
Figure 1.5: Summary of an integrated cognitive neurobiological model of depression. (ACC -anterior cingulate cortex; DLPFC - dorsolateral prefrontal cortex; MPFC - medial prefrontal cortex; NAc - nucleus accumbens; PFC - prefrontal cortex; SPC - superior parietal cortex) [Disner 2011].
1.3.3 Integrated neurocognitive model
Neurobiological processes that initiate cognitive bias and attenuated cognitive control, also underly cognitive biases in depression. Figure 1.5 presents the flowchart of the sequence of events that are proposed to be involved in the development of depression, beginning with depression vulnerability factors and environmental stres-sors, and resulting in depressive symptoms. Figure 1.5 outlines the neurobiological events that are associated with each step of the cognitive model: schema activa-tion, biased attenactiva-tion, biased processing, and biased memory and rumination. The brain regions in this flowchart are divided into two groups: regions associated with bottom-up, limbic system influences (shown by the blue boxes), and regions that maintain bottom-up influences through altered top-down cognitive control (shown by the grey boxes). Note that all elements contribute directly to depressive symp-toms, and that depressive symptoms also feed back into the system, thus exacer-bating schema activation [Disner 2011].
R´
esum´
e du Chapitre 2
Le chapitre suivant repr´esente une introduction `a l’´electroenc´ephalographie, c’est-`a-dire `a une description g´en´erale de l’activit´e neuronale, de la g´en´eration des signaux ´electriques dans le cerveau ainsi que de la mesure des signaux EEG. Je d´efinirai ´egalement les diff´erentes ondes c´er´ebrales, qui sont un concept important de l’analyse EEG. Enfin, des m´ethodes plus avanc´ees telles que l’EEG quantita-tive et la localisation de la source ainsi qu’une description g´en´erale des probl`emes forward et inverse seront pr´esent´ees.
Electroencephalography
Contents 2.1 Introduction . . . 16 2.2 Neural activity . . . 17 2.2.1 Cortical cytoarchitecture . . . 18 2.3 EEG Generation . . . 19 2.3.1 EEG . . . 19 2.3.2 Brain waves . . . 22 2.4 Source localisation . . . 24 2.4.1 Forward problem . . . 25 2.4.2 Inverse problem . . . 272.1
Introduction
In 1875, Richard Caton discovered brain electrical activity in the animals, but the history of human electroencephalography (EEG) began only in the late 1920s, when the first EEG recordings from the human scalp were obtained by the German psychiatrist Hans Berger [Berger 1929]. Berger recorded mostly from his children, showing that human brain normally produces near-sinusoidal voltage oscillations (alpha rhythms) in awake, relaxed subjects with eyes closed. Strong reduction in alpha amplitude during eyes opening or performing mental calculation has been verified by modern studies. Unfortunately, Berger’s research waited more than 10 years to be accepted by the scientific community as validated brain signals. By the 1950s, EEG technology was viewed as a genuine technique, with important applications in neurosurgery, neurology, and cognitive science.
2.2. Neural activity 17
2.2
Neural activity
The electrical signals generated by the brain represent a part of its physiologi-cal activities. The neural activity of the human brain starts around the 17th and 23rd week of prenatal development [Sanei 2007]. Understanding of neurophysiolog-ical properties of the brain with mechanisms underlying the generation of electrneurophysiolog-ical signals and their recording is crucial for signal detection. The CNS contains a net-work of specialized cells called neurons that coordinate the actions of a subject and transmit signals between different parts of its body. A typical neuron is composed of an axon, dendrites and synapses. Its morphology is presented in Figure 2.1.
Figure 2.1: Diagram of a typical myelinated neuron [Wikipedia 2012].
To fully understand what EEG measures, I will explain some general definitions: – A synapse is a structure that permits a neuron to pass an electrical or chemical
signal to another neuron.
– Neurotransmitters are chemical molecules that transmit signals from the presy-naptic neuron to a postsypresy-naptic target cell across a synapse.
– Postsynaptic neuron is the target neuron of the opposite side of the synapse. – An action potential (AP) is a discharge of the neuron that is associated with fast (around millisecond) opening and closing of Na+ and K+ ion channels in the neuronal membrane of the axon. The discharge takes place if depolar-ization of the membrane reaches a firing threshold. The action potential is considered as the simplest event of information processing in neuronal net-works associated with transfer of information from one neuron to others. – Postsynaptic potential (PSP) is a change in the membrane potential of the
postsynaptic neuron induced by a presynaptic AP. When the opening of ion channel causes a positive charge across the membrane, the membrane is said to be depolarized, as the potential comes closer to zero. This is an excitatory postsynaptic potential (EPSP), as it brings the neuron’s potential closer to its firing threshold, about -50 mV. On the other hand, if the opening of the ion channel builds negative charge, this moves the potential further from zero and is referred to as hyperpolarization. This is an inhibitory postsynaptic potential (IPSP), as it changes the charge across the membrane to be further from the firing threshold.
2.2.1 Cortical cytoarchitecture
The neocortex is described as a six-layer structure [DeFelipe 2002]. Smooth and spiny neurons (pyramidal cells and spiny stellate cells) are the two major groups of cortical neurons. The pyramidal cells are the majority of cortical neurons that can be found in layers II and VI. Most spiny stellate cells are interneurons that are localized in the middle cortical layers. Smooth neurons are substantially GABAergic interneurons allocated in all layers. In general, it is believed that neocortical neurons are organized into multiple, small repeating microcircuits, based around pyramidal cells and their input-output connections. Despite of the cortical heterogeneity, a common basic microcircuit has evolved. The pyramidal cells form its skeleton. They receive excitatory inputs originate from extrinsic afferent systems and spiny cells. Inhibitory inputs originate mostly from GABAergic interneurons. These micro-anatomical characteristics have been found in all cortical areas and can be
2.3. EEG Generation 19
considered as the fundamental aspects of cortical organisation [DeFelipe 2002].
2.3
EEG Generation
The EEG signal is a sum of the collective electrical behaviour of vertically ori-ented pyramidal neurons located mainly in cortical layers III, V, and VI (Figure 2.2). Layers of cortical neurons are the main source of the EEG. Differences of electrical potentials are caused by summed postsynaptic graded potentials from pyramidal cells that create electrical dipoles between the soma (body of a neuron) and apical dendrites, which branch from neurons (Figure 2.3). The dipoles are induced by local currents that are associated with excitatory and inhibitory post-synaptic potentials. Generally, EEG can be modelled as being generated by small current dipoles, located in the grey matter [Friston 2007].
2.3.1 EEG
EEG is a very important clinical tool to study brain activity, in normal or patho-logical conditions like: mental diseases and retardation, epilepsy, brain tumors, strokes, infectious diseases, severe head injury, drug overdose, sleep and metabolic disorders, and ultimately brain death.
EEG measures the electrical activity along the scalp, that is voltage fluctuations resulting from ionic current flows within the neurons of the brain. Scalp electrodes are more sensitive to the activation of cortical sources, close to scalp electrodes, while the activation of deep sources is attenuated by layers including the scalp, skull, brain and many other thin layers in between. Furthermore, the waveforms that are recorded from the scalp represent summed activity from large populations of neurons. This is because the electric field of each active source of the brain spreads in all directions and is registered in every electrode. Thus, EEG has lim-ited anatomical specificity (spatial resolution) when compared with other functional brain imaging techniques such as fMRI. However, EEG is still a very good tool to explore brain activity. First of all, time resolution is much higher than in other methods, such as fMRI or positron emission tomography (PET), and reaches
mil-Figure 2.2: Organization of the neocortex in 6 layers [Pernet 2012].
liseconds. Additionally, EEG is one of the few methods (with magnetoencephalog-raphy (MEG) or voltage-sensitive dye imaging (VSDI)) able to measure the electric activity of the brain. Other methods for exploring functions in the brain rely on blood flow, blood volume or metabolism which may be decoupled from the brain electric activity. Some researches combine EEG or MEG with fMRI or PET to get high temporal and spatial resolution. Another huge advantage of EEG is its low price.
The recordings can be varied so that the potential difference is measured either between pairs of electrodes (bipolar derivation) or between individual electrodes and a common reference point (referential montage). Because the amplitude of electrical signal of the brain is very weak (up to 100 µV), the signal must be amplified before being displayed. The scheme of electrodes position in the International 10-20 System
2.3. EEG Generation 21
Figure 2.3: Micro current sources due to synaptic and action potentials [Nunez 2006].
is depicted in Figure 2.4. The more detailed technical and practical aspects of EEG techniques are beyond the scope of this work. It can be found in numerous literature [Nunez 2006, Sanei 2007, Tatum 2008].
A lot of brain dysfunctions are diagnosed by visual inspection of EEG signals. In healthy adults, the frequencies and amplitudes of brain waves change from one state to another, such as wakefulness and sleep. Moreover, it can slightly differ between two human beings in the same state of mind. Moreover, the characteristics of brain oscillations also change with the age. Nevertheless, brain oscillations have been divided into five major brain waves distinguished by their different frequency range, as follows: delta (δ, 0.5-4 Hz), theta (θ, 4-7 Hz), alpha (α, 8-13 Hz), beta (β, 13-30 Hz) and gamma (γ, above 30 Hz). The alpha and beta waves were introduced by Berger in 1929 [Berger 1929]. In 1938 Jasper and Andrews used for the first time the “gamma” to refer to the waves above 30 Hz [Jasper 1958]. Walter introduced delta range in 1936 to describe all frequencies below alpha rhythm [Walter 1964]. The notion of a theta wave was introduced by Wolter and Dovey in 1944 [Sterman 1974].
Figure 2.4: Typical scalp EEG electrodes’ placement in the 10-20 system [Augustyniak 2001].
2.3.2 Brain waves Delta waves
Delta waves (0.5-4 Hz) can be presented in the awake state, but they are pri-marily associated with deep sleep. It is very easy to confuse the genuine delta with artefact signals caused by large groups of muscles of the neck and jaw, or by eye-movement. However, by applying signal analysis (such as independent component analysis (ICA)), it is possible to distinguish the origin of the signal [Sanei 2007].
Theta waves
Theta waves (4-7 Hz) were first presumed to have a thalamic origin and the term “theta” might refer to it. Theta oscillations appear when wakefulness slips towards drowsiness and is also related to the level of arousal. Moreover, these waves are associated with states of rapid eye movement (REM) sleep, hypnosis,
2.3. EEG Generation 23
lucid dreaming, creative inspiration and deep meditation. Cortical theta is observed frequently in young children. In older children and adults, large contingents of theta waves in awake and during the deepest stages of sleep are caused by several brain pathologies [Sanei 2007].
Alpha waves
Alpha waves (8-13 Hz) can be detected bilaterally in all posterior lobes. It is usually found over the occipital part of the brain, where the amplitude is higher than in other regions and is normally less than 50 µV. Alpha waves indicate wake-ful relaxation with closed eyes, but they are suppressed by eye opening, visual stimuli and visual scanning, drowsiness and sleep. This type of alpha oscillations normally appears at age 4 months, initially with 4 waves per second. With the brain development alpha reaches 10 Hz, and is established around age 3 years [Kolev 1994, Niedermeyer 1997]. There are also other alpha variants, like: fast-alpha or fast-alpha-delta (slow-wave, SWS) state spreading across the brain in an anterior-posterior gradient [Pivik 1995].
Interestingly, according to a recent study, alpha oscillations are enhanced during internal tasks, such as mental calculation and working memory [Palva 2007]. Recent research of alpha-amplitude and phase dynamic suggested a direct and active role for alpha-frequency band rhythmicity in the mechanisms of attention and consciousness [Palva 2007].
Mu waves
Mu waves (encompassed in the alpha range 8-12 Hz) can be found in primary sensory or motor cortical areas when they are not processing sensory information or producing motor output. It is strongly suppressed during the execution of contra-lateral motor acts, the thought of a movement, or tactile stimulation [Cochin 1998, Pfurtscheller 2006]. Mu rhythm is thought to be produced by interactions between the thalamus and the cortex. Additionally, mu wave is most often asymmetric and asynchronous between the 2 sides and may be also unilateral [McFarland 2000]. It
has low to medium amplitude and comparable to that of the alpha rhythm. In contrary to alpha wave, it does not react to eye opening and closing.
Beta waves
Beta waves (13-30 Hz) are detected mostly over the frontal and central regions of the brain in normal adults. It appears during waking state and is associated with active thinking and attention, concentration or solving certain problem. Im-portantly, a central beta rhythm is related to the rolandic mu wave and can be blocked by motor activity or tactile stimulation. The amplitude of beta rhythm is normally under 30 µV. Interestingly, the beta wave may be enhanced around tumoural regions [Sanei 2007].
Gamma waves
Theoretical and experimental work suggests that gamma waves (30-100 Hz) are related with sensory processing [Jensen 2007]. They also have an important role in attention and both working and long-term memory. In recent years, intracranial and high-density EEG and MEG recordings allowed to study gamma band synchroniza-tion during various cognitive funcsynchroniza-tions in humans [Kaiser 2003, Herrmann 2004] and in relation to psychiatric and neurological dysfunctions [Quyen 2006, Uhlhaas 2006]. The gamma oscillations, which have a crucial role in synaptic plasticity and neuronal communication, allow to develop models of the neuronal processing in local and dis-tributed cortical networks engaged in complex cognitive functions [Jensen 2007].
2.4
Source localisation
For many years, researchers have been interested in the source reconstruction of M/EEG recordings. In this section I will focus on forward models which relate electrical measurements M to neural activity J.
2.4. Source localisation 25
2.4.1 Forward problem
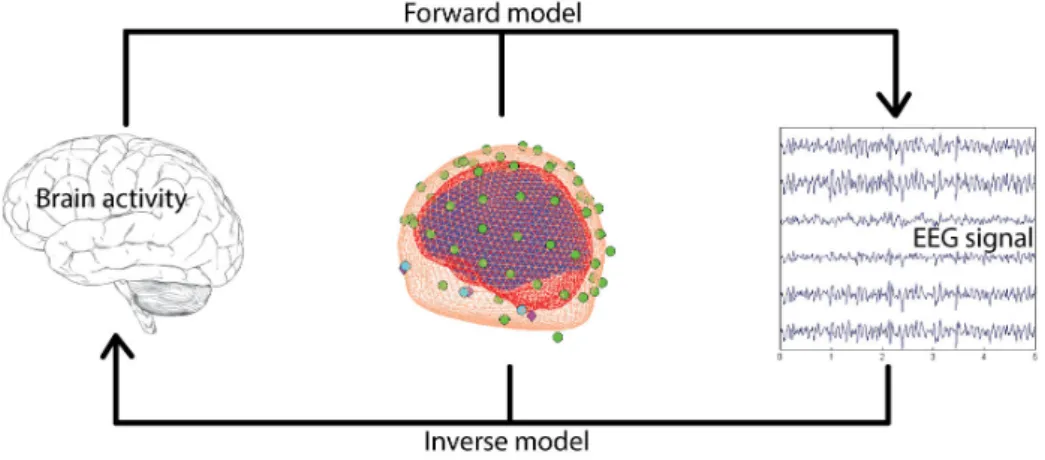
The first step of source localisation entails modelling of the brain electrical activity (in case of EEG signal) and head volume conduction. This step is called Forward Problem and its output is called the gain matrix. Each column of the gain matrix represents a surface potential, linking the scalp recordings with the cortical source corresponding to the column. To be able to do that, it is necessary to model the conductivity and the geometry of the head, which is further explained in section 2.4.1.1. The main assumption of the source model is that the neighbouring pyramidal cells (current sources) which are parallel to each other and perpendicular to the cortical surface, are the EEG generators [David 2002].
Given the three spatial coordinates (x,y,z), orientation angles (θ, φ) and strength (d) of N sources, T time samples of EEG data measured with S electrodes the model for distributed sources is described by the following linear equation:
M = GJ + E (2.1)
where M is a S × T matrix of measured EEG signal, G is a S × N gain matrix representing a scalp potential, J is a N × T matrix representing an activity of cortical sources, and E is a S × T matrix representing noise [David 2002].
To solve the forward model, first, it is necessary to understand the nature of neuronal activity and cerebral anatomy, and that lead to the head model. The generation of neural activity has already been described in section 2.3, so further I will focus on the head models.
2.4.1.1 Head models
The forward problem is to solve Maxwell’s equations describing the electromag-netic field produced by neural activity. The difficulty of forward model computation lies in modelling the volume conductor, a human head, and the sources, the neuronal activity of the brain. The structure of the head and the brain is very complicated. The brain is surrounded by meninges and the CSF. The head comprises various organs and tissues (skull, scalp, eyes, vessels, nerves, CSF, etc.). The brain
tis-sues have highly anisotropic electrical conductivity. For example the conductivity of white matter is 10 times greater along an axon fibre than in the transverse di-rection [Malmivuo 1995], whereas skull’s conductivity is 15 times lower than skin’s or cortex’ [Oostendorp 2000]. [Haueisen 1995] studied the influence of volume cur-rents on the magnetic field and found that “the computed magnetic field of radial sources varied significantly with the conductivities of the surrounding tissues where the dipole was located”. For this reason, the complications are generally ignored and the head model often assumes that the head consists of concentric homogeneous shells: the brain (comprising the white and grey matter), the CSF, the skull and the scalp.
The standard spherical model was the first and simplest model used in forward model computations. The head is modelled as a set of concentric homogeneous and spherical volume conductors: the brain, skull and scalp. Sphere-shaped models are very fast in forward model estimation. They can be expressed in simple analytic form, however it is a crude approximation of real geometry.
Boundary element method (BEM), finite-element method (FEM) and finite dif-ference method (FDM) algorithms allowed for more detailed and accurate for-ward models. These algorithms reconstruct the realistic geometry of the head and the brain, with all anatomical structures, using individual or standarized MRI scans. The boundary element method BEM estimates the surface potential gen-erated by current sources located in homogeneous tissues [Meijs 1987, Meijs 1989, Hallez 2007]. The shape of the different compartments of a volume conductor is modeled by closed triangle meshes [Fuchs 2007]. In comparison to standard spheri-cal models, the volume currents are more precisely taken into account [Vatta 2010]. Although, it uses only isotropic conductivities and lacks the capacity to accurately represent the cortical structures (such as sulci and gyri) it remains to be widely used because of its low computational needs [Hallez 2007]. Even better accuracy is pos-sible when FDM or five or eleven tissue-type FEM models are used [Ramon 2006]. The summary of different head models is presented on Figure 2.5. However I will not focus on mathematical differences between all models, because it is beyond the scope of this thesis.
2.4. Source localisation 27
Figure 2.5: Summary of different head models. (A) The standard spherical model. (B) Real-istic model with homogeneous layers computed with boundary element method (BEM). (C) Non homogeneous realistic model estimated with finite elements methods (FEM) or finite differences methods (FDM).
Once the forward problem is solved the inverse problem can be estimated from acquired EEG signals. The Inverse Problem describes the opposite situation: having the electric field at the scalp and the gain matrix, the aim is to estimate the time course of the sources. Figure 2.6 depicts a schematic representation of forward and inverse problems.
Figure 2.6: Schematic representation of forward and inverse problems.
2.4.2 Inverse problem
The inverse problem is an estimation ˆJ of sources J that generate the measured EEG (or MEG) data M. This model can be described by the following equation:
ˆ
where J is a matrix of estimated current density obtained from measured data M and G is the gain matrix. In other words, the aim is to reconstruct the under-lying current distribution in the cortex using potential differences which are mea-sured non-invasively from the head surface [Wolters 2004]. Unfortunately, EEG source localisation is an ill-posed inverse problem, because the number of esti-mated sources (>>1000) is higher than the number of electrodes (<300), and in the absence of constraints, the solution is non-unique and unstable. Although the number of parameters can be reduced, if some constraints are placed on the sources [Phillips 2001, Friston 2007, Grech 2008]. Many different sources configurations can still generate the same distribution of potentials (or magnetic fields in MEG) on the scalp [Helmholtz 1853, Fender 1987].
Over the years, a number of various techniques have been developed to solve the inverse model for EEG source localisation. These approaches can be divided into two categories: parametric and non parametric. Non parametric methods are also named as Distributed Source Models, distributed inverse solutions (DIS) or imaging methods.
The parametric technique estimates the dipole parameters of an a priori de-termined number of dipoles, whereas in the non parametric several dipole sources with fixed locations and possibly fixed orientations are distributed in the brain vol-ume or cortical surface [Grech 2008]. As it must be assvol-umed that cortical pyrami-dal neurons are normally oriented to the cortical surface, fixed orientation dipoles are set to be perpendicularly aligned. Then, the amplitudes of current sources are estimated. Since the dipole location is not assessed, these methods present a linear problem which can be solved by various methods, including: minimum norm estimator (MNE) [H¨am¨al¨ainen 1994], low resolution electrical tomography (LORETA) [Pascual-Marqui 1994], standardized low resolution brain electromag-netic tomography (sLORETA) [Pascual-Marqui 2002], multiple sparse priors (MSP) [Friston 2008], local autoregressive average (LAURA) [Menendez 2004] and many others [Grech 2008]. However, the aim of this project was not to describe all pos-sible source localisation methods, so in next paragraphs I will focus only on MNE used in this work.
2.4. Source localisation 29
Minimum Norm Estimates
According to H¨am¨al¨ainen and Ilmoniemi [H¨am¨al¨ainen 1994], minimum norm estimators (MNE) are the best estimates for the currents in the absence of any a priori information. MN estimates are generally based on the assumption that the current distribution should have minimum overall power (the smallest L2-norm). The estimate ˆJM of J can be then written as [Dale 1993, H¨am¨al¨ainen 1994, Pascual-Marqui 1999, Michel 2004]:
ˆ
JM = GT(GGT + λI)−1M (2.3)
where I is the identity matrix. The relative weight of the prior term are modu-lated by the positive hyperparameter λ. On the one hand, this method gives unique solution, where only one combination of current sources can exactly fit the data and have the lowest overall intensity. But on the other, it is considered to produce quite poor estimation of the true source locations [Michel 2004, Grech 2008]. However it remains the most used approach.
In the following section 5.1.5 the independent and identically distributed (IID) model (corresponds to the MNE) from SPM8 toolbox was used to solve the inverse problem.
Dans ce chapitre, je pr´esenterai la stimulation magn´etique transcranienne. Dans la premi`ere partie, je d´ecrirai les principes de la stimulation magn´etique, l’instrumentation de la TMS ainsi que la technique de neuronavigation. Ensuite, je d´ecrirai la plasticit´e synaptique dans le cas de LTD et LTP, et les m´ecanismes des changements induits par la TMS. Ce chapitre se conclura par la d´efinition et la de-scription de diff´erents protocoles utilis´es dans cette th`ese. De plus, je pr´esenterai une rapide introduction `a d’autres applications de la rTMS, telles que l’´etude fonction-nelle de la connectivit´e et de l’excitabilit´e corticale, ou le traitement de la d´epression.
![Figure 1.1: Major dopaminergic pathways in the human brain [Dunlop 2007, Schatzberg 2004]](https://thumb-eu.123doks.com/thumbv2/123doknet/14594630.730401/27.892.215.673.379.823/figure-major-dopaminergic-pathways-human-brain-dunlop-schatzberg.webp)
![Figure 1.2: The noradrenergic pathways in the human brain [Moret 2011, Schatzberg 2004]](https://thumb-eu.123doks.com/thumbv2/123doknet/14594630.730401/28.892.212.676.398.857/figure-noradrenergic-pathways-human-brain-moret-schatzberg.webp)
![Figure 1.3: The serotonergic pathways in the human brain [Schatzberg 2004]](https://thumb-eu.123doks.com/thumbv2/123doknet/14594630.730401/29.892.218.681.552.1001/figure-serotonergic-pathways-human-brain-schatzberg.webp)
![Figure 2.1: Diagram of a typical myelinated neuron [Wikipedia 2012].](https://thumb-eu.123doks.com/thumbv2/123doknet/14594630.730401/38.892.154.743.462.899/figure-diagram-typical-myelinated-neuron-wikipedia.webp)
![Figure 2.2: Organization of the neocortex in 6 layers [Pernet 2012].](https://thumb-eu.123doks.com/thumbv2/123doknet/14594630.730401/41.892.158.740.137.674/figure-organization-neocortex-layers-pernet.webp)
![Figure 2.3: Micro current sources due to synaptic and action potentials [Nunez 2006].](https://thumb-eu.123doks.com/thumbv2/123doknet/14594630.730401/42.892.309.584.172.432/figure-micro-current-sources-synaptic-action-potentials-nunez.webp)
![Figure 2.4: Typical scalp EEG electrodes’ placement in the 10-20 system [Augustyniak 2001].](https://thumb-eu.123doks.com/thumbv2/123doknet/14594630.730401/43.892.237.651.172.614/figure-typical-scalp-eeg-electrodes-placement-augustyniak.webp)