Publisher’s version / Version de l'éditeur:
Vous avez des questions? Nous pouvons vous aider. Pour communiquer directement avec un auteur, consultez la première page de la revue dans laquelle son article a été publié afin de trouver ses coordonnées. Si vous n’arrivez Questions? Contact the NRC Publications Archive team at
[email protected]. If you wish to email the authors directly, please see the first page of the publication for their contact information.
https://publications-cnrc.canada.ca/fra/droits
L’accès à ce site Web et l’utilisation de son contenu sont assujettis aux conditions présentées dans le site LISEZ CES CONDITIONS ATTENTIVEMENT AVANT D’UTILISER CE SITE WEB.
Internal Report (National Research Council of Canada. Institute for Research in
Construction), 2004-07-01
READ THESE TERMS AND CONDITIONS CAREFULLY BEFORE USING THIS WEBSITE. https://nrc-publications.canada.ca/eng/copyright
NRC Publications Archive Record / Notice des Archives des publications du CNRC : https://nrc-publications.canada.ca/eng/view/object/?id=825b27c0-870a-4504-a8ef-269543f99f8e https://publications-cnrc.canada.ca/fra/voir/objet/?id=825b27c0-870a-4504-a8ef-269543f99f8e
NRC Publications Archive
Archives des publications du CNRC
For the publisher’s version, please access the DOI link below./ Pour consulter la version de l’éditeur, utilisez le lien DOI ci-dessous.
https://doi.org/10.4224/20377802
Access and use of this website and the material on it are subject to the Terms and Conditions set forth at
Experimental assessment of water penetration and entry into
siding-clad wall specimen
Experimental Assessment of Water
Penetration and Entry into Siding-Clad
Wall Specimen
by A. N. Sahal and M. A. Lacasse
Internal Report No. 862
Date of issue: July 2004
This internal report, while not intended for general distribution, may be cited or referenced in other publications.
T
ABLE OFC
ONTENTS TABLE OF CONTENTS………..……….iii LIST OF FIGURES………...……….v LIST OF TABLES……….vii ACKNOWLEDGEMENTS………..……viii SUMMARY………...………ix Chapter 1 – Introduction 1.1 BACKGROUND ... 1 1.2 OBJECTIVES ... 5 1.3 APPROACH... 5Chapter 2 – Wood stud wall with hardboard siding cladding: description of the test specimen 2.1 INTRODUCTION ... 7
2.2 DESCRIPTION OF THE TEST SPECIMEN... 7
2.2.1 Primary test specimen assembly components ... 7
2.2.2 Types of components and interface details ... 7
2.2.3 Types of deficiencies and related interface details ... 10
2.2.4 Location of water collection troughs... 14
2.2.5 Location of pressure taps... 14
2.2.6 Location of air leakage openings ... 14
Chapter 3 – Test protocol - water penetration and entry assessment of wall assembly 3.1 INTRODUCTION ... 17
3.2 DESCRIPTION OF THE TEST PROTOCOL ... 17
Stage 1 – Air leakage characteristics... 17
Stage 2 – Pressure response characteristics ... 19
T
ABLE OFC
ONTENTSChapter 4 –
Description of the
Dynamic Wind and Wall Test Facility (DWTF)Chapter 5 – Experimental results
5.1 INTRODUCTION ... 24
5.2 AIR LEAKAGE CHARACTERIZATION ... 24
5.2.1 DWTF system air leakage... 24
5.2.2 Test specimen air leakage ... 25
5.3 CHARACTERIZATION OF PRESSURE RESPONSE ... 26
5.3.1 Static pressure response across the width of the wall at the electrical outlet ... 26
5.3.2 Static pressure response across the width of the wall at the vent duct ... 30
5.3.3 Static pressure response across the width of the wall at the window... 30
5.4 WATER ENTRY ASSESSMENT... 35
5.4.1 Water entry through specified deficiency at electrical outlet... 36
5.4.2 Water entry through specified deficiency at ventilation duct... 41
5.4.3 Water entry through specified deficiency at window... 45
5.4.4 Summary... 47
5.5 WATER ENTRY FUNCTION... 49
5.5.1 Derivation of a water entry function ... 49
5.5.2 Estimating water entry ... 51
5.5.3 An example - estimating water entry for a Wilmington “wet” year ... 53
LIST OF FIGURES
Figure 2.1 Composition of hardboard siding wall specimen
Figure 2.2 Location of through-wall components in hardboard specimen (elevation) Figure 2.3 Configuration of the window installed in the test specimen
Figure 2.4 Wall/window interface for the specimen - vertical section Figure 2.5 Wall/ventilation duct interface for the specimen - vertical section Figure 2.6 Wall/electrical outlet interface for the specimen - vertical section
Figure 2.7 Location of deficiencies (water entry points) above the electrical outlet (left) and ventilation duct (right)
Figure 2.8 Location of water collection troughs
Figure 2.9 Location of air leakage holes and pressure taps Figure 4.1 Inside view of apparatus showing test specimen
Figure 4.2 Inside view of apparatus showing piston and water spray racks. Figure 4.3 Rear view of apparatus showing piston and hydraulic gear. Figure 4.4 Front view of apparatus
Figure 5.1 Base air leakage, pressure difference vs. air leakage
Figure 5.2 Specimen air leakage, static pressure difference vs. air leakage
Figure 5.3 Wall electrical outlet interface for the specimen and the location of the pressure taps - vertical section
Figure 5.4 Static pressure response across the cavities at the electrical outlet, ABSL 0.3 L/s-m2 Figure 5.5 Static pressure response across the cavities at the electrical outlet, ABSL 0.4 L/s-m2 Figure 5.6 Static pressure response across the cavities at the electrical outlet, ABSL 0.6 L/s-m2 Figure 5.7 Wall ventilation duct interface for the specimen and the location of the pressure taps
- vertical section
Figure 5.8 Static pressure response across the cavities at the vent duct, ABSL 0.3 L/s- m2 Figure 5.9 Wall window interface for the specimen and the location of the pressure taps -
vertical section
Figure 5.10 Static pressure response across the cavities, ABSL 0.3 L/s-m2 Figure 5.11 Static pressure response across the cavities, ABSL 0.4 L/s-m2 Figure 5.12 Static pressure response across the cavities, ABSL 0.6 L/s-m2 Figure 5.13 Water entry rate at trough D at static pressure difference of 0 Pa
Figure 5.14 Water entry rates through the deficiency above the electrical outlet that was collected at trough D, ABSL 0.3 L/s- m2
Figure 5.15 Water entry rates through the deficiency above the electrical outlet that was collected at trough D, ABSL 0.4 L/s- m2
Figure 5.16 Water entry rates through the deficiency above the electrical outlet that was collected at trough D, ABSL 0.6 L/s-m2
LIST OF FIGURES
Figure 5.17 Water entry rates through the deficiency above the vent duct that was collected at trough T2, ABSL 0.3 L/s-m2
Figure 5.18 Water entry rates through the deficiency above the vent duct that was collected at trough T2, ABSL 0.4 L/s-m2
Figure 5.19 Water entry rates through the deficiency above the vent duct that was collected at trough T2, ABSL 0.6 L/s-m2
Figure 5.20 Water entry rates through the deficiency above the vent duct that was collected at trough L, ABSL 0.6 L/s-m2
Figure 5.21 Water entry rates through the deficiency at window that was collected at troughs TW and T5, ABSL 0.3 L/s-m2
Figure 5.22 Water entry rates through the deficiency at window that was collected at troughs TW and T5, ABSL 0.4 L/s-m2
Figure 5.23 Water entry rates through the deficiency at window that was collected at troughs TW and T5, ABSL 0.6 L/s-m2
Figure 5.24 Water entry rates as a function of spray rates
LIST OF TABLES
Table 3.1Static pressure differences for measuring the specimen air leakage Table 3.2 Static pressure differences for measuring the pressure response Table 3.3 MEWS test protocol for water entry
Table 3.4 Test protocol
Table 5.1 Base air leakage results
ACKNOWLEDGEMENTS
The authors gratefully acknowledge to work carried out by Mr. Stacey Nunes in conducting the various tests necessary to characterize the wall response, as well as the support provided to Dr. Sahal in carrying out the tests and reviewing results. Dr. Sahal would also like to express her appreciation to the Istanbul Technical University, Turkey, as well as the Institute for Research in Construction for having supported her work term at the National Research Council Canada, Ottawa. Dr. Sahal would like to extend her sincere thanks to Dr. Ralph Paroli, Director of the Building Envelope and Structures program, for having made arrangements for her stay at the Institute for Research in Construction.
SUMMARY
Overview
Chapter 1 introduces background information in relation to previously conducted work for the assessment of water penetration and entry of various claddings. The objective and the approach of the present study are presented as well. The basic approach described in this work, the test facility, description of test specimen and test protocol, is based on previous studies carried out in the project on Moisture
Management for Exterior Wall Systems (MEWS).
Chapter 2 provides a description of the test specimen, the composition of the wall assembly, types of through wall penetrations incorporated into the assembly, and types of deficiencies that simulate the field conditions. The locations of water collection troughs, pressure taps and air leakage openings incorporated into the assembly for the purpose of the experimental work are described as well.
Chapter 3 offers a description of the test protocol, i.e. the stages of the experimental work, the input test parameters and the expected outputs for each stage carried out to characterize the pressure response and air leakage and as well to assess the water penetration and entry of the test specimen.
Chapter 4 describes the Dynamic Wall Test Facility in which the test protocol is performed on the specimen. For example, the test specimen is subjected to a series of spray rates at increasing pressure differences for the evaluation of water penetration and entry of the specimen.
Chapter 5 gives the results of the experimental work, i.e. the test protocol carried on the test specimen in DWTF. The assessment of the water penetration and entry as well the air leakage and pressure response characteristics are presented. As well, a water entry function for the assembly is derived and a step-by-step approach to estimate the hourly amount of water entry into the stud cavity through a specific deficiency is
developed. The estimate is exclusive to the hardwood siding wall specimen investigated in this study and is based on hourly horizontal rainfall intensity and coincident wind speed for a specific location.
Summary of results
• Substantial amounts of water entered into deficiencies under gravity alone, i.e. no pressure difference across the cladding. The highest rate (0.45 L/min) was through the deficiency in the window.
• Rates of entry for the electrical outlet were primarily dependent on the amount of water deposited on the wall; increased rates of entry were evident for corresponding increases in rates of water sprayed onto the cladding surface.
• The amounts of water that passed through the deficiency located above the
ventilation duct were greater in comparison to amounts entered similar deficiencies above the electrical outlet. This suggested that water entry was dependent on the nature of water deposition at the deficiency itself. It further suggested that the deficiency above the ventilation duct had a greater direct water deposition than that of the deficiency at the electrical outlet.
• Rates of entry for the specified deficiency at the ventilation duct for spray rates of 1.0, 2.0 and 3.4 L/min-m2 were loosely dependent on the amount of water deposited on the wall. However, water entry rates for spray rates of 3.0 and 5.0 L/min-m2 were more evidently dependent on pressure differences particularly at 600 Pa.
• Values for water entry rate at the window were greater than those obtained from the electrical outlet or ventilation duct. Water entry through the deficiency at the window was dependent on pressure differences across the assembly; entry rates increased with increasing pressure levels. The increase in air barrier system leakage provided increasing driving pressures across the drainage cavity; in turn this increased the rates entry to the stud cavity. Of all the tests performed, the highest entry rate was through the deficiency at the window (1.5 L/min) when the assembly was subjected to a spray rate of 5.0 L/min-m2 and a pressure difference of 600 Pa.
• The increase in the amount of water deposition on the cladding, i.e. the thickness of the surface film, in particular at the vicinity of the opening acted as a barrier, which reduced the cavity pressure and increased the driving pressure across the cladding. For the deficiencies at the ventilation duct and the window, the relatively high spray rates (3.0 and 5.0 L/min-m2) increased the driving pressures across the deficiency, particularly at 600 Pa. Thus, at these spray rates, the effect of change in pressure difference was more dominant than that of spray rate in regard to water entry. • For all tests, cascading water at rates of 1.0, 2.0 and 3.0 L/min-m2 on the cladding
surface resulted in substantial rates of water entry as compared to that of spraying water at a rate of 3.4 L/min-m2 on the cladding.
— Chapter 1 —
Introduction
1.1 Background
Driving rain is one of the most significant moisture sources that affect the building facades [1]. Driving rain striking the building façade is shed, adsorbed by the cladding, depending on material properties, and eventually deposited on the exterior surface of the cladding as runoff water. The amount of water deposited on the surface of the cladding is dependent on various parameters such as rainfall intensity, wind speed, wind
direction, building configuration, and can be calculated by several methods [2]. Driving rain deposited on the cladding may penetrate through the imperfectly detailed,
defectively installed and inadequately maintained interface details at through wall penetrations under the driving force of coincident wind pressure, gravity or capillary forces. Water that passes through the cladding may be drained due to the gravity, transmitted due to the capillary forces and pressure differences and/or stored in the adjacent components or in the interstitial spaces of the wall assembly, depending on the properties of the materials used and the type of assembly. The amount of water that penetrates beyond the cladding, the path of water flow, the location of water
accumulation within the assembly and its dwell time before it drains or dries out are the factors that govern the rainwater penetration performance, as well the durability of the wall assembly.
Several surveys on building envelope failures have been conducted and the results of these reports explicitly indicated that the driving rain was the dominant moisture source and rainwater penetration through the interface details of the wall assemblies was one of the major causes for the premature deterioration of the assemblies. Killip and Cheetham [3] reported that dampness was the cause of almost half of the
deterioration of building envelopes investigated by the Building Research Advisory Service (UK) between 1970 and 1974. Rain penetration accounted for approximately half of the dampness problems whereas rain penetration through walls encompassed 40% of the rain penetration problems.
In a report prepared by the Building Envelope Engineering group for the CMHC [4] a estimate was made that 5% of new homes experience rainwater leakage to the interior
under conditions that occur on an annual or more frequent basis and a same amount may experience leakage into the structure but not into the interior.
Scott, in two case studies related to wood frame walls [5], identified rain as the primary moisture source that penetrated through the window-wall interface and
eventually caused the saturation of the sheathing board, wetting of the cellulose thermal insulation material in the stud space and rotting of the wood studs.
As reported in a “Survey of Building Envelope Failures in the Coastal Climate of British Columbia” [6], a good number of low-rise wood frame residential buildings less than 10 years old, characterized by many types of cladding such as traditional stucco and vinyl siding, have suffered from premature deterioration of the sheathing board, wetting of thermal insulation materials in the stud cavity and interior gypsum board. It was noted that interface details such as window, ventilation ducts, wall-electrical outlets, and balcony connections were the primary points for water ingress and, driving rain was responsible for the water ingress. A survey [7] conducted on high-rise buildings in the same region reached similar conclusions.
According to a study commissioned by the CMHC and undertaken by Morrison Hershfield [8], the primary cause of building envelope failures in 3-4 story high stucco-clad wood frame residential buildings located in the coastal regions of BC, was not an interior moisture source, but rather water primarily from an exterior moisture source, i.e., driving rain, that bypasses the weather barrier. Given the lack of protection of sheathing from wetting, premature failure of the sheathing board was likely.
Prediction of the rainwater penetration and entry of the wall assembly prior to construction is essential to ensure the long-term performance of the assembly.
Laboratory investigations are a useful means to provide insightful information regarding water penetration and ingress of wall assemblies. There exist several industrial
standards that describe water penetration test methods, and various test facilities worldwide that evaluate the watertightness performance of wall assemblies [1]. A brief summary of some of the previously conducted laboratory investigations of water penetration and entry of various types of wall assemblies under simulated climatic conditions follows.
Ritchie and Plewes [9, 10] conducted rainwater penetration tests by subjecting various types of brickwork panels to simulated heavy driving rain and wind pressure. The authors sought information on the effect of air leakage rate and panel thickness on the water leakage rate and concluded that both of these factors had an appreciable influence on water leakage.
Roberts [11] conducted water penetration tests on concrete block masonry test specimens according to the BS 4315:1970 standard and reported the water leakage rates through specimens as a function of their percentage of wetted area. For the specific test specimens, water leakage rates were below 75% of the wetted area of the specimen.
Newman and Whiteside [12] experimentally investigated the penetration of water through single-leaf brickwork. The exterior surfaces of small panels were wetted simulating a severe storm condition and several pressure differences were applied across the specimens. It was shown that water leakage through the cracks between the brick and mortar interface increased after the wall was fully saturated. A key finding was that water leaked through the interface even when there was no pressure difference across the wall, although the pressure difference increased the leakage rate. Another key finding was that when sufficient water was applied to provide a water film on the surface of the wall, the leakage rate through the wall increased slightly with a
corresponding increase in spray rate.
Rathbone [13] carried out a series of water and air penetration tests on concrete block work. The leakage rate through the concrete block work panels was linearly related to differential air pressure within the range tested and, as was found in the previous studies, water leakage occurred at zero pressure differential. As well, it was found that for any given air pressure differential, water leakage increased up to a given spray rate and thereafter, the rate of increase in water leakage diminished.
Selvarajah and Johnston [14] suggested that water leakage rate through cracks in single-skin masonry (i.e. brick veneer) increased with an increase in pressure difference across the crack, spray rate and crack width.
A laboratory investigation undertaken by Morrison Hershfield [15] on the rainscreen concept applied to wood frame construction concluded that a pressure equalized brick veneer resisted water penetration better than a non-pressure equalized wall when comparing the performance of wall assemblies having vinyl siding, stucco and brick veneer claddings.
Brown et al. [16] investigated the water penetration performance of EIFS-clad wood frame walls under the simulated climatic loads of Wilmington, NC. The results of the experimental work indicated that the most vulnerable points where water entered the wall cavity was at through-wall penetrations, such as windows.
More recently, a study was undertaken by the IRC, entitled MEWS (Moisture
for different types of cladding, i.e. EIFS, stucco, brick veneer and siding [17]. Water entry functions provided hourly water entry rates through specific deficiencies in the generic type of wall assemblies under given simulated climatic conditions. These functions were obtained from water entry testing of full-scale wall assemblies. The test subjected specimens to two (2) spray rates at three (3) steps of increasing pressure differential across the assembly. The entry functions provided a basis for a systematic means of transferring water entry information to hygIRC [18], a mathematical
hygrothermal model used in the MEWS project to undertake parametric simulation studies [17].
Irrespective of the fact that previously conducted experimental work has provided substantial information on water penetration and entry of various wall assemblies under simulated climatic conditions, basic relationships that link the climate loads such as rainfall intensity and wind speed, to wall response, that relate the quantity of water deposited on the cladding to water entry were not evident. However, the laboratory studies undertaken in the MEWS project and which helped benchmark the
watertightness of wall assemblies and establish basic water entry functions for different types of wall assemblies highlighted the usefulness of this approach to provide essential input data for mathematical simulation models such as hygIRC. Simulation models require hourly rates of water entry in relation to specified climate parameters that can be associated to a given climatic conditions.
The present experimental work was carried out with the intention of expanding the results obtained from work previously carried out in the MEWS project. In this work program, a wood stud wall specimen having hardwood siding cladding in which were incorporated specific deficiencies was subjected to simulated climate loads as was done in the MEWS project. However, the specimen was subjected to a broadened series of simulated climatic load as compared to that defined in the MEWS test protocol [17], i.e. five spray rates at five pressure differences. It is suggested that the results from these experiments would provide a better understanding of the water penetration and entry of the specific wall assembly from which a water entry function would be further developed, and which subsequently could provide input to a hygrothermal simulation tool such as hygIRC [17].
1.2 Objectives
The objectives of this study were to quantitatively assess the water entry of a wood stud wall with hardwood siding cladding that included specific deficiencies and degrees of air barrier system leakage under simulated climatic loads. Specifically, the
quantitative assessments included the following.
• To determine the amount of water entry through the deficiencies in relation to simulated climatic loads and degree of air barrier system leakage, and • To determine the water entry function of the specific cladding.
• To determine the relative dependence of water entry rates to the size of the
deficiency, the spray rate, and the pressure difference across the deficiency, and the degree of air barrier system leakage.
1.3 Approach
The objective was achieved by means of a series of laboratory experiments, in which a wood stud wall having hardwood siding cladding, that included specific deficiencies and degrees of air barrier system leakage, was subjected to simulated climatic loads using the Dynamic Wall Testing Facility (DWTF).
The hardwood siding-clad test specimen was selected among an existing stock of test specimens previously fabricated for the MEWS project [17,19]. The test specimen included a 19-mm cavity, which was provided by wood strapping between the cladding and the sheathing board. Two (2) layers of 30-min building paper were applied as water resistive barrier (sheathing membrane) to the sheathing board. The glass mat gypsum sheathing board was installed on the wood frame studs and an acrylic board was installed onto the other side of the wood studs to provide an air barrier system (ABS).
Common types of wall components such as a vinyl-flanged window, a ventilation duct and an electrical outlet were incorporated in the test specimen. Each of these
components penetrated through the cladding and sheathing board.
Deficiencies were specified in such a manner as to be nominally representative of either imperfect installation or inadequate maintenance in the field. These were introduced at the interfaces between the cladding and the wall-window, wall-ventilation duct and wall-electrical box. Deficiencies were also incorporated at the sheathing membrane in order to provide water entry points to the wall assembly.
Water collection troughs were located in the wall assembly, specifically in proximity to the specified deficiencies, and in such a manner as to facilitate the collection of any water entering deficiencies and passing through either the cladding or sheathing board.
Pressure taps were located within the cavities, i.e. the 19-mm drainage cavity behind the cladding as well as the stud cavity. Some of the taps were specifically located in proximity to deficiencies to obtain information on pressure differences at those locations; this information offered some measure of the driving forces that affect the likelihood of water entry through deficiencies.
The acrylic board used as the ABS included a series of holes, which helped assure a controlled air leakage rate through the assembly. Simply opening or closing the
appropriate number of holes varied rates of air leakage through the ABS.
A test protocol was established to characterize the air leakage, pressure response and water penetration and entry of the test specimen.
The intent for measuring air leakage was to determine the effect of the degree of air leakage of the wall assembly in relation to driving pressures across the cladding that may bring about water entry.
Pressure response was measured by assessing the pressure drop in both the
drainage and stud cavity using differential pressure transducers. This provided a relative measure of the pressure differences across the deficiencies that in turn established the driving pressures for water entry at those locations.
Water penetration and entry were assessed by subjecting the test specimen to a series of spray rates at increasing static pressure difference for specified dwell times and degrees of ABS leakage.
The quantities of water collected in troughs were measured for the duration of the test such that the rate of the water entry in relation to spray rates and static pressure
differences could be estimated. As well, the relative dependence of water entry rates could be assessed in relation to the size of deficiency, spray rate, pressure difference across the deficiency, and degree of ABS leakage. Additionally, the minimum levels of spray rate and static pressure difference at which water entry through the specified deficiencies occurred were determined. This information offered a rough estimation of the climate load that the wall assembly would likely be resistive to water penetration.
As well, observations were made on water penetration of the sheathing board. Such observations provided information on the path of water beyond the cladding and the likelihood of other elements of the wall assembly getting wet.
—
Chapter 2 —
Wood stud wall with hardboard siding cladding:
Description of test specimen
2.1 Introduction
The specimen that comprised a wood stud wall with hardboard siding cladding was selected from an existing stock of wall assemblies built for the MEWS consortium project [19]. Subsequently, the specimen was tested to characterize water entry in relation to simulated wind-driven rain loads using the Dynamic Wind and wall Test Facility (DWTF); a brief description of the DWTF is provided in Chapter 4. The air leakage characteristics and pressure response of the wall assembly were also measured.
This chapter provides a general description of the siding wall specimen, i.e. the composition of the wall assembly and types of details incorporated into the assembly. Deficiencies introduced in the wall assembly and related interface details are also described. The locations of water collection troughs and pressure taps in relation to the location of the deficiencies for the test specimen are given.
2.2 Description of the test specimen
2.2.1 PRIMARY TEST SPECIMEN ASSEMBLY COMPONENTS
The test specimen nominally measured 2.44-m by 2.44-m. The primary components of the wall assembly, as illustrated in Figure 2.1 [19], included the following: hardboard lap siding, 19-mm cavity – incorporating vertical pressure treated (PT) wood strapping, two (2) layers of 30-min. building paper (sheathing membrane), 12-mm glass mat gypsum board sheathing, and 38-mm by 89-mm wood studs. An acrylic sheet (not shown in Figure 2.1) was placed onto the outer face of the wood studs to act as the air barrier system (ABS).
2.2.2 TYPES OF COMPONENTS AND INTERFACE DETAILS
Three basic components were incorporated in the assemblies: a vinyl flanged window, a ventilation duct and an electrical outlet. The location of each of these three components is shown in Figure 2.2 [17]. Each of these components penetrated the
siding (cladding 1st line of defence), sheathing membrane (2nd line of defence) as well as the sheathing board and hence was considered a through-wall penetration.
The window was a flange-mounted fixed PVC (vinyl) window (Bonneville) measuring 755-mm by 755-mm. The window profile is illustrated in Figure 2.3 [19].
The circular metal ventilation duct had a 150-mm diameter and the electrical outlet was an exterior duplex wall outlet measuring 50-mm wide by 75-mm high and 75-mm deep.
Glass Mat Gypsum Board
Hardboard Siding 19 mm Wood Strapping
2 Layers 30-min Paper
2400 mm 2400 mm 755 by 755-mm Vinyl flanged window 50 by 75-mm Electrical outlet 150-mm diameter. Ventilation duct
Figure 2.2 Location of through-wall components in hardboard specimen (elevation) [17]
2.2.3 TYPES OF DEFICIENCIES AND RELATED INTERFACE DETAILS
Deficiencies were introduced in the 1st (cladding outer surface) and 2nd (sheathing membrane outer surface) lines of defence in order to provide water entry points in the wall assembly. The deficiency in the first line of defence was a missing length of sealant bead at each of the interfaces with the respective through-wall penetrations, namely at the wall-window, wall-electrical outlet and wall-ventilation duct interface.
At the wall-window interface, of which a sectional view is shown in Figure 2.4 [19], a 90-mm of sealant length was missing at the bottom centre of the windowsill, as well as along one edge of the sill and at the bottom of the adjacent jamb.
For interfaces of both the wall-vent duct and wall-electrical outlet, a 50-mm length of sealant was missing between the top of the cover plate and wall, as shown in Figures 2.5 and 2.6 [19], respectively as well as Figure 2.7 [17].
At the second line of defence, i.e. the sheathing membrane, the deficiency
introduced in the wall-window interface was a 6-mm gap between the window flange and the sheathing membrane. As well, a reverse lap between the rough sill protection and the sheathing membrane was introduced on the sheathing board.
At the wall-vent duct interface, 6-mm gap between the edge of the sheathing board and the sheathing membrane was incorporated in the assembly and 50-mm of sealant length was missing between the sheathing board and the bottom of the duct.
The wall-electrical outlet incorporated the same kind of deficiencies as the wall-vent duct at the second line of defence. Each type of deficiency is illustrated in Figures 2.4, 2.5 and 2.6 [19], and is highlighted in italic in the text box.
Hardboard siding (not back primed)
2 layers 30-min building paper
Rough head protection membrane (225 mm high, extended
300 mm past opening) Nailing flange (not nailed at head)
Rough sill protection membrane (225 mm high, extended 400 mm past opening)
Drip flashing extending 25 mm past the opening (supplied by siding manufacturer)
19 mm x 38 mm @ 400 mm o.c. vertical PT wood strapping, 19 mm cavity
Acrylic sheet acting as air barrier
Acrylic sheet taped to window frame
2 layers 30-min
building paper Openings in acrylic
sheet simulate leakage of air barrier system Reverse lap between
rough sill protection and WRB
6 mm gap between window flange and WRB 90 mm of sealant length missing in center of sill, at one edge of sill, and at bottom of adjacent jamb
Glass mat gypsum board sheathing, 12 mm
J-track 10 mm
Sealant and backer rod
at jambs and sill Water collection gutter
Missing 50 mm of sealant length at top of cover plate
Acrylic sheet acting as air barrier
Hardboard lap siding
12 mm gap between edge of sheathing and perimeter of duct filled with backer rod and sealant
150 mm diameter ventilation duct Opening of duct closed
with a sheet of acrylic sealed at perimeter
6 mm gap between building paper and edge of sheathing board
3 mm gap between edge of hardboard and perimeter of duct
2 layers 30-minute building paper
19 mm x 38 mm P.T. wood strapping (lined up with studs)
Openings in acrylic sheet simulate leakage of air barrier system
3 mm x 50 mm missing sealant at bottom of duct
Glass mat gypsum board sheathing, 12 mm
Missing 50 mm of sealant length at top of cover plate
6 mm gap between building paper and edge of glass mat gypsum sheathing Exterior duplex electrical
outlet box
50 mm x 75 mm x 75 mm
Acrylic sheet acting as air barrier Hardboard lap siding
Nominal horizontal wood nailer 38 mm X 89 mm (2" X 4")
12 mm gap between sheathing and outlet box sealed with backer rod and sealant 3 mm gap between hardboard and outlet box 2 layers 30-minute building paper 19 mm x 38 mm vertical PT wood strapping, at 400 mm o.c. (over wood studs), 19 mm cavity
Openings in acrylic sheet simulate leakage of air barrier system 3 mm x 50 mm missing sealant at bottom of outlet box Filet bead of sealant
around perimeter of opening
2.2.4 LOCATION OF WATER COLLECTION TROUGHS [17]
A series of troughs, as illustrated in Figure 2.8 [17], permitted collecting water that entered deficiencies, penetrated the cladding (1st line of defense), or was deposited in the stud space behind the sheathing board (beyond 2nd line of defense).
Troughs were located in the 19-mm space between the cladding and the sheathing in order to collect the water that may enter the deficiencies and pass the cladding. Two of the troughs (D and V) were located beneath the respective components, i.e. the electrical outlet (D) and the ventilation duct (V), to serve the deficiencies above the respective components. Deflectors were placed above each component in the cavity in order to prevent any unintentional water entry from an above portion of the wall cavity to otherwise dilute the entry results in either trough.
As well, another series of troughs (T1 to T5) were located, given in Figure 2.8 [17], at the base of the wall in the drainage cavity behind the cladding. Troughs T1 to T5
collected water that might penetrate the cladding and be deposited in the cavity; these troughs were limited nominally to the breadth of a stud space. It is to be noted that water not collected at trough D would be expected to collect in trough T1. Likewise for trough T2, water not collected in trough V would collect in this trough.
Three troughs were situated in the stud cavity beneath the electrical outlet (E), the ventilation duct (L), and the window (TW). The intention was to collect water that might pass both the cladding and the sheathing board through the related deficiency.
2.2.5 LOCATION OF PRESSURE TAPS
Pressure taps were located in six parts of the wall as shown in Figure 2.9 [17]. In each part, pressure taps were situated in the 19-mm cavity between the siding and the sheathing board and in the stud cavity. Certain pressure taps were specifically located in proximity to the deficiencies to obtain the pressure differences that may affect the likelihood of water entry past the cladding and the sheathing board.
2.2.6 LOCATION OF AIR LEAKAGE OPENINGS
An acrylic board situated on the outer surface of the wood stud served as the air barrier system (ABS). Illustrated in Figure 2.9 [17] is the wall specimen showing the location of a series of three 6-mm diameter holes introduced in the ABS (acrylic sheet) about the center of each of the stud cavities. Opening or closing the appropriate number of holes in the ABS could regulate the nominal rate of air leakage through the assembly.
50-mm 50-mm
Figure 2.7 Location of deficiencies (water entry points) above the electrical outlet (left) and ventilation duct (right) [17]
2400 mm
2400 mm
W
TW
T5
T4
T3
T2
T1
L
E
V
D
406-mm
737-mm
Pressure taps located in the drainage cavity - (●) Located in stud cavity - (○)
3 x 6-mm Ø holes to regulate air leakage through air barrier
356-mm
1.22-m
200-mm
2.44-m
—
Chapter 3 —
Test protocol — water penetration and entry assessment of wall assembly
3.1 Introduction
The test protocol was established to measure air leakage, pressure response and water penetration and entry of the specimen when subjected to simulated driving rain and driving rain wind pressures using the DWTF – a description of the DWTF follows in Chapter 4.
The test protocol required conducting tests in a series of stages that included: 1. Measuring air leakage through the test specimen under static pressure differences
for different degrees of ABS leakage as specified by the nominal leakage area (LA*) in the ABS.
2. Measuring pressure responses of the test specimen under static pressure differences for different degrees of ABS leakage.
3. Assessing water penetration and collecting water entry data when subjected to both static pressure differences and varying spray rates for different degrees of ABS leakage.
A description of each stage is provided in the following section giving the test parameters and expected outputs.
3.2 Description of the test protocol
STAGE 1 – AIR LEAKAGE CHARACTERISTICS
In order to determine the air leakage characteristics of the test specimen, the base air leakage for the DWTF as a whole was first measured. When air leakage tests are carried out on a given specimen, the base air leakage must be taken into account, as the overall or gross specimen leakage also comprises the base air leakage. Hence
subtracting the base from the gross air leakage of the specimen establishes the net specimen leakage.
To determine the base air leakage, an airtight metal wall was used in place of the test specimen. It is to be noted that the piston, test frame door and specimen seals, as
*
well as pipe, wire and instrumentation joints, and hatches are not airtight. Hence, the base air leakage for the DWTF could be obtained by isolating certain components of the DWTF with polyethylene sheathing and gathering air leakage data for static pressure differences across the airtight metal wall.
Opening or closing the appropriate number of holes in the ABS, permitted
determining the air leakage of the test specimen at various nominal values of leakage area (LA). The gross air leakage, calculated at 75 Pa pressure difference, was obtained for each of the different nominal LAs; that is, (1) when the specimen air leakage was minimized (“airtight system” - all openings in ABS closed or < 0.6 L/s), (2) the specimen provided for a nominal air leakage of 0.2 L/s-m2, (3) the specimen was configured to be in the least airtight mode (leakiest system - all openings in ABS open) providing the greatest degree of air leakage.
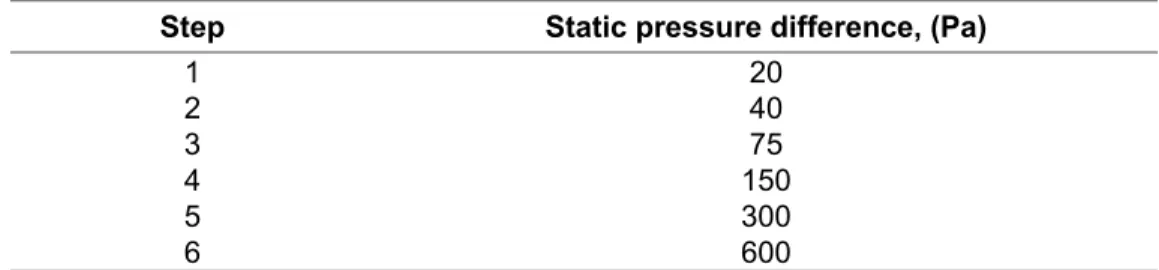
The static pressure differences that were applied across the specimen are given in Table 3.1.
Table 3.1 Static pressure differences for measuring the specimen air leakage
Step Static pressure difference, (Pa)
1 20 2 40 3 75 4 150 5 300 6 600
Air leakage was measured with a Miriam Laminar Flow Element coupled to an Air Limited micromanometer. The flow is determined on the basis of differential pressure drop across the element as well as knowledge of the air temperature and atmospheric pressure at the time of the test. The Air Limited micromanometer is capable of
assessing static pressure differences to an accuracy of ± 0.5 Pa. For each test step, laboratory temperature and atmospheric pressure were measured to apply corrections to the results obtained from the micromanometer.
The expected outputs were laboratory temperature (°C) and atmospheric pressure (Pa), base air leakage of DWTF (L/s), gross air leakage of the system (L/s), and air barrier system leakage (L/s-m2) of the test specimen for a series of leakage areas (LA).
STAGE 2 – PRESSURE RESPONSE CHARACTERISTICS
The pressure response of the test specimen at different nominal levels of ABS leakage was measured under static pressure differences, values of which are given in Table 3.2.
For each step, and different nominal ABS leakage, pressure drops between the static pressure difference and the cavity pressure at each pressure tap location were
measured using differential pressure transducers. The data were recorded on a continual basis. The expected output was values of driving pressures across the
cladding and the stud cavity under static pressure differences for different values of ABS leakage.
Table 3.2 Static pressure differences for measuring the pressure response Air leakage characteristic Step Static pressure, (Pa) 1 0 2 40 3 75 4 150 5 300 Airtight system 6 600 1 0 2 40 3 75 4 150 5 300 Nominal requirement 6 600 1 0 2 40 3 75 4 150 5 300 Leakiest system 6 600
STAGE 3 – WATER PENETRATION AND ENTRY OF THE TEST SPECIMEN
One of the important parameters of the test protocol was determining the level of rates of spray and static pressure difference that would be applied to the specimens given that these ought to simulate the type of conditions that might prevail across North America in regard to driving rain intensity and driving rain wind pressure respectively. In terms of driving rain intensities and driving rain wind pressures, these nominal values of spray rate and static pressure difference would comprise in-service as well as extreme
conditions. As well, it was considered that the test protocol should accommodate ASTM E331 [20]. The ASTM 331 requires a spray rate of 3.4 L/min m2 to be applied on to the exterior surface of the wall simultaneously with a pressure difference of 137 Pa across the wall for a dwell time of 15 minutes [20].
A comprehensive study for deriving the level of spray rates and pressure differences from North American climate data had already been undertaken for MEWS project [21]. The MEWS protocol for water entry under static pressure differences required subjecting the test specimen to nominal spray rates of 1.7 and 3.4 L/min-m2 with 3 steps of
increasing static pressure difference, that is 75, 150 and 300 Pa. Each step was conducted over a 20-minute period. Levels of rate of water spray and pressure
difference were consistent with related climatic data for driving rain and driving rain wind pressure that might occur in an extreme climatic event within a 10-year period in North America [17].
However, in this study, the spray rates did not include a broad range of possible in-service conditions. Therefore, it was felt that providing additional levels of spray rate and static pressure difference to the existing MEWS protocol would more likely represent these conditions.
Table 3.3 MEWS test protocol for water entry [17]
Step Spray rate
(L/min-m2) Static pressure, (Pa) Dwell time, (min.) 1 0* 20 2 75 20 3 150 20 4 1.7 300 20 5 75 20 6 150 20 7 3.4 300 20 *Preconditioning of the test specimen.
The deposition of driving rain on the surface of the cladding can be simulated by two methods: water may be (1) sprayed through a series of nozzles perpendicular to the surface of the cladding, or (2) cascaded onto the cladding surface through the use of a spray bar located on top of the cladding. In order to determine the effect of the type of application of spray rates to rates of water entry, both application types were
incorporated in the test protocol.
Hence, a modified test protocol was established to subject the test specimen to different static pressure differences, varying spray rates and selected degrees of air
barrier system (ABS) leakage. Table 3.4 provides a summary of the different test series. The same series was repeated for the nominal ABS leakage requirement and the
greatest ABS leakage.
During tests, water ingress through specified deficiencies to the stud cavity was observed. As well, water entry rates through specified deficiencies in the wall assembly were determined based on the collection of water in troughs over a given time period.
The expected outputs for the water penetration and entry tests were the following. • Pressure drops at each pressure tap locations for the given static pressure
differences and air barrier system leakage.
• Quantity of water entry through the deficiencies at the cladding and the sheathing board as a function of nominal spray rates, static pressure differences and degrees of air barrier system leakage.
Table 3.4 Test protocol* Air leakage characteristics Step Spray rate (L/min-m2) Pressure (Pa) Dwell time, (min.) 1 0 10 2 40 10 3 75 10 4 150 10 5 3.4 Spray 300 10 1 0 10 2 40 10 3 75 10 4 150 10 5 1.0 Cascade 300 10 1 0 10 2 40 10 3 75 10 4 150 10 5 2.0 Cascade 300 10 1 0 10 2 40 10 3 75 10 4 150 10 5 3.0 Cascade 300 10 1 0 10 2 40 10 3 75 10 4 150 10 Airtight 5 5.0 Cascade 300 10
—
Chapter 4 —
Description of the Dynamic Wind and Wall Test Facility (DWTF)
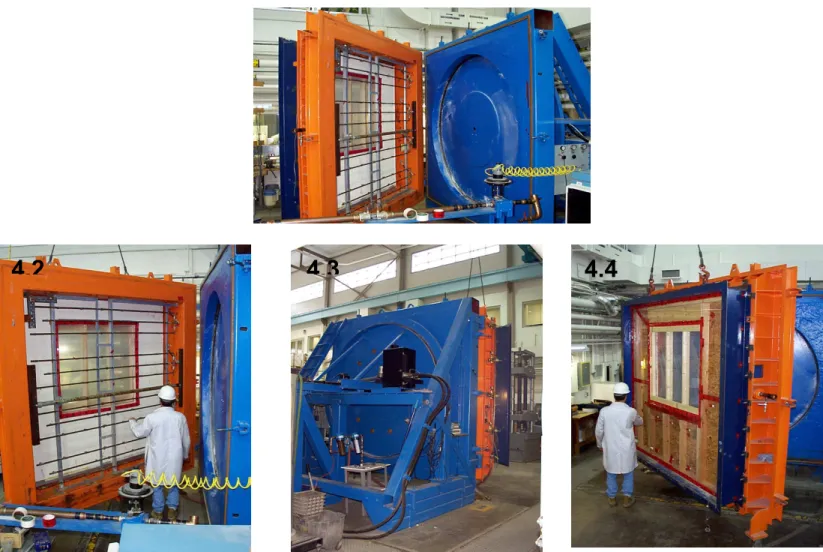
The facility used to conduct the tests was the Dynamic Wind and Wall Test Facility (DWTF) [17]. This facility, depicted in Figures 4.1 to 4.4, is capable of subjecting full-scale test specimens (nominal size 2.44 by 2.44-m) to static or dynamic pressure fluctuations of over 2 kPa and spray rates of up to 8 L/min-m2.Dynamic pressure fluctuations are obtained by the displacement of a sealed 2.4-m diameter piston, which forms part of the back of the apparatus as shown in Figure 4.3. The displacement of the piston (up to 75 mm) causes the volume of the space between it and the test specimen assembly to increase or decrease, thus varying the air pressure difference across the specimen. The movement of the piston can be programmed to produce sinusoidal, triangular or square waveforms of air pressure at frequencies ranging from 0.1 to 10Hz and amplitudes up to or exceeding 2kPa. A secondary blower generates the steady-state (static) component of air pressure. This blower provided the means to assess the air leakage characteristics of the specimens.
The apparatus also contains a pressure regulated water spray system that simulates the action of rain deposition on the cladding surface. Different water deposition rates (hereafter referred to as spray rates) are achieved by regulating the pressure level along specific arrays of spray nozzles. Water spray rates can be regulated between 0.8 and 8 L/min-m2. Water can be applied to the front face of the specimen in either full-spray format in which water is deposited evenly across the front of the specimen, or by cascading water from the top of the specimen in a continuous sheet of water.
4.2
4.3
4.4
Figure 4.1 Inside view of apparatus showing test specimen (sizes up to 2.44 by 2.44-m). The exterior cladding faces the inside of the apparatus. Figure 4.2 Inside view of apparatus showing piston and water spray racks.
Figure 4.3 Rear view of apparatus showing test frame, piston and hydraulic gear.
Figure 4.4 Front view of apparatus - The wall specimen is installed integrally to the metal test frame (in blue). The specimen test frame is in turn mounted and sealed to the facility test frame (in orange). The facility test frame supports the water spray racks and is the operable door to the apparatus.
—
Chapter 5 —
Experimental results
5.1 Introduction
Experimental work in this study consisted of conducting air leakage, pressure response and water penetration and entry tests on a full-scale test specimen using the DWTF. The specimen was mounted in a steel test frame, the frame being affixed to the DWTF. The interior face of the specimen was exposed to the laboratory for observation of the stud cavities during testing.
The test protocol, as described previously in Chapter 3, was initiated by conducting air leakage tests to characterize the wall assemblies by measuring airflow rates through the specimen at various predetermined static pressure differences and various nominal ABS leakage. Opening or closing the appropriate number of holes in the air barrier system controlled ABS leakage.
Pressure response of the specimen was evaluated by measuring the pressure drops in the drainage cavity and stud cavity at predetermined static pressure differences (i.e. nominally at 20, 40, 75, 150, 300 and 600Pa) and for each level of ABS leakage.
Observing and measuring the transport of water through the specimen under
simulated wind and rain conditions permitted evaluating the degree of water penetration and weathertightness of the specimen and quantifying the amount of water entry and thereafter deriving the rates of entry in relation to simulated climate loads.
In this study, wind-driven rain was simulated through application of a series of spray rates (3.4 spray, 1.0, 2.0, 3.0 and 5.0 cascade L/min m2) and pressure differences across the specimen (0, 40, 75, 150, and 300 Pa). These combinations were carried out for each level of ABS leakage over given dwell times.
5.2 Air leakage characterization
5.2.1 DWTF SYSTEM AIR LEAKAGE
In order to provide accurate air leakage characteristics of the test specimen, base air leakage data for the DWTF system using an airtight specimen (metal wall) was
measured. Table 5.1 provides the base air leakage data at given static pressure differences across the metal wall and is plotted in Figure 5.1.
Air Leakage (L/s)
Pressure Difference (Pa)
1000 100 110 0.1 0.01 0.001 = 0.9646 R2 y = 0.0002x0.9938
Figure 5.1 Base air leakage, pressure difference vs. air leakage Table 5.1 Base air leakage results
Chamber Pressure (Pa) Air leakage (L/s) Chamber Pressure (Pa) Air leakage (L/s) 30 0.0074 400 0.0540 40 0.0082 500 0.0644 50 0.0082 600 0.0788 60 0.0090 700 0.0980 75 0.0130 800 0.1251 100 0.0130 900 0.1592 200 0.0203 1000 0.1837 300 0.0404
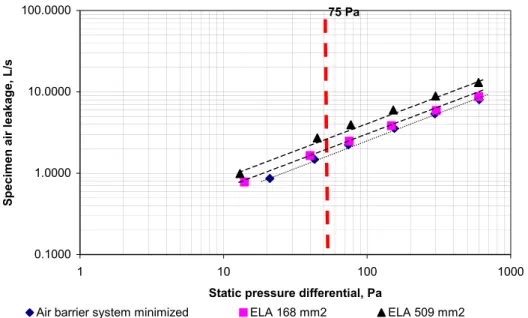
5.2.2 TEST SPECIMEN AIR LEAKAGE
Air leakage of the test specimen at given static pressure difference was measured at various levels of ABS leakage as characterized by the leakage area (LA). A series of seven (one in each stud cavity) nominally 6-mm diameter holes represented a leakage
area (LA) of 169-mm2 and provided a nominal air barrier system leakage of 0.4 L·s-1m-2 at a pressure difference of 75 Pa. An air barrier system leakage of 0.7 L·s-1m-2 (LA 508-mm2) was achieved by using twenty-one holes of the same diameter, three in each stud cavity. An air barrier system leakage of 0.3 L·s-1m-2was achieved when all the holes in the air barrier system were closed.
Base air leakage data was deducted from the gross specimen air leakage, which in turn provided the air leakage of the test specimen. Figure 5.2 provides the specimen air leakage data for static pressure differences across the specimen at various leakage areas (LA). 0.1000 1.0000 10.0000 100.0000 1 10 100 1000
Static pressure differential, Pa
S p eci men ai r l e akage, L/ s
Air barrier system minimized ELA 168 mm2 ELA 509 mm2
75 Pa
Figure 5.2 Specimen air leakage - static pressure difference vs. air leakage
5.3 Characterization of pressure response
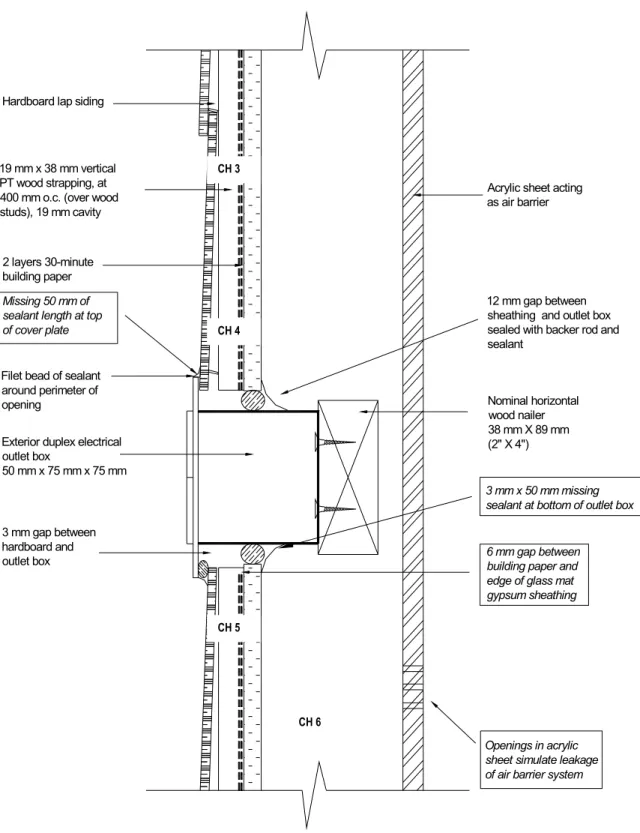
5.3.1 STATIC PRESSURE RESPONSE ACROSS WIDTH OF WALL AT ELECTRICAL OUTLET The wall-electrical outlet interface detail and the pressure tap locations (CH x) within the drainage cavity and the stud cavity are given in Figure 5.3. When the air barrier system leakage of the specimen was either 0.3, 0.4 or 0.6 L/s-m2, the pressure drop at each pressure tap locations was measured with differential pressure transducers for each given static pressure differences (20, 40, 75, 150, 300 and 600 Pa) for the dwell time and the data was recorded on a continuous basis. The pressure drop is simply the difference between the static pressure difference across the specimen and the actual
Missing 50 mm of sealant length at top of cover plate
6 mm gap between building paper and edge of glass mat gypsum sheathing
Exterior duplex electrical outlet box
50 mm x 75 mm x 75 mm
Acrylic sheet acting as air barrier Hardboard lap siding
Nominal horizontal wood nailer 38 mm X 89 mm (2" X 4")
12 mm gap between sheathing and outlet box sealed with backer rod and sealant 3 mm gap between hardboard and outlet box 2 layers 30-minute building paper 19 mm x 38 mm vertical PT wood strapping, at 400 mm o.c. (over wood studs), 19 mm cavity
Openings in acrylic sheet simulate leakage of air barrier system 3 mm x 50 mm missing sealant at bottom of outlet box
Filet bead of sealant around perimeter of opening CH 4 CH 6 CH 5 CH 3
Figure 5.3 Wall-electrical outlet interface for the specimen and the location of the pressure taps - vertical section
pressure at that specific tap location, namely the driving pressure. The driving pressure is the amount of pressure to drive water through an opening. Hence, the driving
pressure ratio is the ratio of driving pressure across the cavity, under the given
conditions, in relation to the static pressure difference across the specimen. The higher this value, the greater the potential driving pressure across the opening.
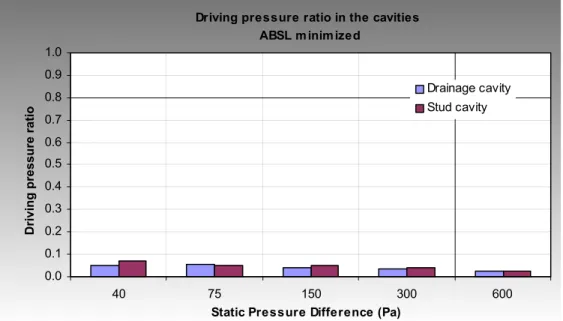
The pressure tap locations of interest were CH 5 and CH 6, as the water collection trough servicing the electrical outlet was located in proximity to CH5 and CH 6. The driving pressure ratio within the drainage cavity and stud cavity across the width of the wall under static pressure differences when the ABS leakage is 0.3, 0.4 or 0.6 L·s-1m-2 are provided in Figures 5.4, 5.5 and 5.6, respectively.
The driving pressure ratio for each cavity at all static pressure differences and ABS leakage ranged from 0.0 to 0.1. In other words, the acrylic board provided the greatest resistance to air pressure and thus sustained the pressure-moderated hardboard siding throughout the test.
Driving pressure ratio in the cavities ABSL m inim ized
0.0 0.1 0.2 0.3 0.4 0.5 0.6 0.7 0.8 0.9 1.0 40 75 150 300 600
Static Pressure Difference (Pa)
D
ri
v
ing pressure rati
o
Drainage cavity Stud cavity
Figure 5.4 Static pressure response across the cavities at the electrical outlet, ABSL 0.3 L·s-1m-2
Driving pressure ratio in the cavities ABSL 0.4 L/s-m2 0.0 0.1 0.2 0.3 0.4 0.5 0.6 0.7 0.8 0.9 1.0 40 75 150 300 600
Static Pressure Difference (Pa)
Driving pressure ratio
Drainage cavity Stud cavity
Figure 5.5 Static pressure response across the cavities at the electrical outlet, ABSL 0.4 L·s-1m-2
Driving pressure ratio in the cavities ABSL 0.6 L/s-m2 0.0 0.1 0.2 0.3 0.4 0.5 0.6 0.7 0.8 0.9 1.0 40 75 150 300 600
Static Pressure Difference (Pa)
D
ri
v
ing pressure rati
o
Drainage cavity Stud cavity
Figure 5.6 Static pressure response across the cavities at the electrical outlet ABSL 0.6 L·s-1m-2
5.3.2 STATIC PRESSURE RESPONSE ACROSS WIDTH OF WALL AT THE VENT DUCT The wall-vent duct interface detail together with the pressure tap locations within the cavities are given in Figure 5.7. The pressure tap locations considered were CH 8 and CH 9. CH 8 is located immediately beneath the deficiency within the drainage cavity and CH 10 is situated in the stud cavity. The driving pressure ratio within the drainage cavity and stud cavity across the wall under static pressure differences when air barrier system leakage is 0.3 L·s-1m-2 is provided in Figure 5.8.
The driving pressure ratio in both cavities and each pressure step ranged from 0.0 to 0.1. This result was essentially the same for the remaining air barrier system leakage, i.e. 0.4 and 0.6 L·s-1m-2. The results implied that pressure moderation occurred in the drainage cavity, which in turn decreased the driving pressures across the cladding. 5.3.3 STATIC PRESSURE RESPONSE ACROSS WIDTH OF WALL AT THE WINDOW
Figure 5.9 illustrates the wall-window interface detail and the pressure tap locations within the drainage cavity and the stud cavity. The pressure tap locations considered were CH 13, CH 14, CH 16 and CH 17. CH 13 and CH 16 are located immediately beneath the wall-window interface deficiency at the right and left drainage cavities when facing the inside of the wall, respectively. CH 14 and CH 17 are situated at the right and left stud cavities when facing the inside of the wall, respectively. The pressure ratio within the drainage cavity measured from CH 13 and stud cavity measured from CH 14 across the width of the wall under static pressure difference when air barrier system leakage is either 0.3, 0.4 or 0.6 L·s-1m-2 are provided in Figures 5.10, 5.11 and 5.12, respectively.
In Figure 5.10, in which the ABS leakage is 0.3 L·s-1m-2, the driving pressure ratio at drainage cavity for each pressure step ranged from 0.0 to 0.1. The driving pressure ratio at the stud cavity ranged from 0.1 to 0.2. However, when the specimen was evaluated with an ABS leakage of 0.4 L·s-1m-2, the driving pressure ratio at the drainage cavity increased, i.e. the ratio varied between 0.35 and 0.45, when the static pressure
difference across the assembly varied between 40 and 700 Pa, respectively. When the ABS leakage is increased to 0.6 L·s-1m-2, the ratio likewise increased and ranged from 0.45 to 0.50 for the same pressure range of pressures.
Missing 50 mm of sealant length at top of cover plate
Acrylic sheet acting as air barrier
Hardboard lap siding
12 mm gap between edge of sheathing and perimeter of duct filled with backer rod and sealant
150 mm diameter ventilation duct Opening of duct closed
with a sheet of acrylic sealed at perimeter
6 mm gap between building paper and edge of sheathing board
3 mm gap between edge of hardboard and perimeter of duct
2 layers 30-minute building paper
19 mm x 38 mm P.T. wood strapping (lined up with studs)
barrier system
3 mm x 50 mm missing sealant at bottom of duct
Glass mat gypsum board sheathing, 12 mm CH 8 CH 9 CH 7 Openings in acrylic sheet simulate leakage of air
ABSL minimized - 3 holes closed ABSL 0.4 L/s-m2 – 2 holes open ABSL 0.4 L/s-m2 – 3 holes open
Figure 5.7 Wall-ventilation duct interface for the specimen and the location of the pressure taps - vertical section
Driving pressure ratio in the cavities ABSL m inim ized
0.0 0.1 0.2 0.3 0.4 0.5 0.6 0.7 0.8 0.9 1.0 40 75 150 300 600
Static pressure difference (Pa)
D
ri
v
ing pressure rati
o Drainage cavity
Stud cavity
Figure 5.8 Static pressure response across the cavities at the vent duct, ABSL 0.3 L·s-1m-2 ; similar results were obtained for air barrier system leakages of 0.4 and 0.6 L·s-1m-2 The driving pressure ratio in the stud cavity for each pressure step increased with increasing ABS leakage. The driving pressure ratios are approximately 0.1 for each pressure steps when the ABS leakage was 0.3 L·s-1m-2, and ratios varied between 0.65 to 0.95 and 0.85 to 0.98, when the ABS leakage was 0.4 and 0.6 L·s-1m-2, respectively. The results imply that when the specimen ABS leakage increases, the proportion of pressure available to drive water through the openings likewise increases. This suggest that there is greater likelihood of water entry for those assemblies having an ABS
Hardboard siding (not back primed)
2 layers 30-min building paper
Rough head protection membrane (225 mm high, extended
300 mm past opening) Nailing flange (not nailed at head)
Rough sill protection membrane (225 mm high, extended 400 mm past opening)
Drip flashing extending 25 mm past the opening (supplied by siding manufacturer)
19 mm x 38 mm @ 400 mm o.c. vertical PT wood strapping, 19 mm cavity
Acrylic sheet acting as air barrier
Acrylic sheet taped to window frame
2 layers 30-min
building paper Openings in acrylic
Reverse lap between rough sill protection and WRB
6 mm gap between window flange and WRB 90 mm of sealant length missing in center of sill, at one edge of sill, and at bottom of adjacent jamb
Glass mat gypsum board sheathing, 12 mm
J-track 10 mm
Sealant and backer rod
at jambs and sill Water collection gutter
CH14 CH 17 CH13 CH 16
CH12 CH 15
sheet simulate leakage of air barrier system
ABSL minimized - 3 holes closed ABSL 0.4 L/s-m2 – 2 holes open ABSL 0.4 L/s-m2 – 3 holes open
Figure 5.9 Wall-window interface for the specimen and the location of the pressure taps - vertical section
Driving pressure ratio in the cavities ABSL m inim ized
0.0 0.1 0.2 0.3 0.4 0.5 0.6 0.7 0.8 0.9 1.0 40 75 150 300 600
Static pressure difference (Pa)
D
ri
v
ing pressure rati
o
Drainage cavity Stud cavity
Figure 5.10 Static pressure response across the cavities, ABSL 0.3 L·s-1m-2
Driving pressure ratio in the cavities ABSL 0.4 L/s-m 2 0.0 0.1 0.2 0.3 0.4 0.5 0.6 0.7 0.8 0.9 1.0 40 75 150 300 600
Static pressure difference (Pa)
D
ri
v
ing pressure rati
o
Drainage cavity Stud cavity
Driving pressure ratio in the cavities ABSL 0.6 L/s-m2 0.0 0.1 0.2 0.3 0.4 0.5 0.6 0.7 0.8 0.9 1.0 40 75 150 300 600
Static pressure difference (Pa)
D
ri
v
ing pressure rati
o Drainage cavity
Stud cavity
Figure 5.12 Static pressure response across the cavities, ABSL 0.6 L·s-1m-2
5.4 Water entry assessment
Water entry rates provide the quantity of water that may enter deficiencies of known size and location on the cladding when exposed to simulated driving rain and driving rain wind pressure, likewise using DWTF.
The test specimen was subjected to simulated driving rain (water spray rates) simultaneously with driving rain wind conditions (static pressure differentials across the specimen) at degrees of air barrier system leakage, as described in the test protocol. Water entry rates were determined at each trough servicing the electrical outlet, the ventilation duct and the window. The locations for each trough are given in Figure 2.8. The troughs that were located in the 19-mm space between the cladding and the sheathing board, namely the drainage cavity, provided the collection of water passing the cladding through the deficiencies. These troughs were located beneath the penetrations, i.e. troughs D, V and W serviced the deficiencies above the electrical outlet, vent duct and the window, respectively. Above the troughs D and V were
deflectors, which prevented water inadvertently entering the troughs from above to dilute the water entry results.
The troughs that were located in the stud cavity permitted the collection of water passing the cladding and the sheathing board through the deficiencies. Troughs E, L and TW serviced the electrical outlet, ventilation duct and the window, respectively.
A series of troughs, T1 to T5 were also located at the base of the drainage cavity. Trough T1 collected water in the cavity between the two vertical studs. Water that would not be collected at trough D would be collected in this trough. Trough T2 collected water that would not be collected at trough V. Location of the base troughs T3, T4 and T5 are given in Figure 2.8.
Information related to water entry through deficiency above the electrical outlet is first discussed followed by results obtained from entry through deficiency located above the ventilation duct and thereafter, for entry about window. Observations related to water entry into the stud cavity are noted. General trends as to the changes in rate of entry in relation to increases in spray rate or static differential pressure are given. Finally, a summary of the test results is also provided.
5.4.1 WATER ENTRY THROUGH SPECIFIED DEFICIENCY AT ELECTRICAL OUTLET Water entering the deficiency above the electrical outlet was collected at trough D (located beneath the electrical outlet) and some instances at through E (located at the stud cavity). No water was collected at trough T1 (trough located at the base of the wall directly below the electrical outlet).
An important observation was the initial sight of the water leakage past the sheathing board, which eventually was collected at trough E. Water leakage through the
deficiencies above the electrical outlet (a missing 50-mm of sealant length at the top of the cover plate) and the sheathing board (50-mm missing sealant at the bottom of the outlet box) into the stud cavity occurred under the following simulated climatic
conditions.
• Water cascaded at a rate of 5.0 L·min.-1m-2 on the cladding surface of the specimen that provided a nominal air leakage rate of 3.0 L·s-1m-2 and pressure difference across the specimen was maintained at 300 Pa.
• Water cascaded at a rate of 3.0 L·min.-1m-2 on the surface of cladding and the pressure difference across the specimen was 300 Pa when the air barrier system leakage of the specimen was 4.0 L·s-1m-2.
![Figure 2.3 Configuration of the window installed in the test specimen [19]](https://thumb-eu.123doks.com/thumbv2/123doknet/14189807.477800/19.918.194.808.598.997/figure-configuration-window-installed-test-specimen.webp)
![Figure 2.5 Wall/ventilation duct interface for the specimen - vertical section [19]](https://thumb-eu.123doks.com/thumbv2/123doknet/14189807.477800/22.918.96.867.134.929/figure-wall-ventilation-duct-interface-specimen-vertical-section.webp)
![Figure 2.6 Wall/electrical outlet interface for the specimen - vertical section [19]](https://thumb-eu.123doks.com/thumbv2/123doknet/14189807.477800/23.918.161.797.120.874/figure-wall-electrical-outlet-interface-specimen-vertical-section.webp)
![Figure 2.9 Location of air leakage holes and pressure taps [17]](https://thumb-eu.123doks.com/thumbv2/123doknet/14189807.477800/26.918.196.698.89.648/figure-location-air-leakage-holes-pressure-taps.webp)