MÉMOIRE PRÉSENTÉ À
L'UNIVERSITÉ DU QUÉBEC À TROIS-RIVIÈRES
COMME EXIGENCE PARTIELLE DE LA MAÎTRISE EN GÉNIE ÉLECTRIQUE
PAR
ALVARO OMAR MAClAS FERNANDEZ
IDENTIFICATION EN LIGNE POUR LA GESTION D'ÉNERGIE DES
SYSTÈMES MULTI-STACKS
Université du Québec à Trois-Rivières
Service de la bibliothèque
Avertissement
L’auteur de ce mémoire ou de cette thèse a autorisé l’Université du Québec
à Trois-Rivières à diffuser, à des fins non lucratives, une copie de son
mémoire ou de sa thèse.
Cette diffusion n’entraîne pas une renonciation de la part de l’auteur à ses
droits de propriété intellectuelle, incluant le droit d’auteur, sur ce mémoire
ou cette thèse. Notamment, la reproduction ou la publication de la totalité
ou d’une partie importante de ce mémoire ou de cette thèse requiert son
autorisation.
UNIVERSITY OF QUEBEC
THESIS SUBMITTED TO
UNIVERSITÉ DU QUÉBEC À TROIS-RIVIÈRES
IN PARTIAL FULFILLMENT OF THE REQUlREMENTS FOR THE DEGREE OF MASTER IN ELECTRICAL ENGINEERING
BY
ALV ARO OMAR MAClAS FERNANDEZ
ONLINE IDENTIFICATION FOR ENERGY MANAGEMENT OF MUL
TI-ST ACK SYTI-STEMS
111
UNIVERSITÉ DU QUÉBEC À TROIS-RIVIÈRES
MAÎTRISE EN GÉNIE ÉLECTRIQUE (M. Sc. A.) Programme offert par l'Université du Québec à Trois-Rivières
IDENTIFICATION EN LIGNE POUR LA GESTION D'ÉNERGIE DES SYSTÈMES MULTI-STACKS
PAR
ALVARO OMAR MAClAS FERNANDEZ
Loïc Boulon Université du Québec à Trois-Rivières
Hicham Chaoui Carleton University
Joao Trovao Université de Sherbrooke
Résumé
La dépendance aux combustibles fossiles et l'effet de serre peuvent être réduits par l'électrification du train de puissance des véhicules. Afin d'assurer une réelle diminution de la pollution, l'énergie électrique doit être générée par des sources vertes et renouvelables. De nos jours, les véhicules à batterie (BEV) montrent une acceptation du marché et sont à zéro émission locale, mais il a deux inconvénients principaux : un long temps de recharge et une autonomie limitée. La combinaison d'une pile à combustible en tant que source primaire et d'une source secondaire telle qu'une batterie ou un super-condensateur bénéficie d'atouts particuliers, tels qu'un rendement plus élevé que les moteurs à combustion interne, plus d'autonomie que les BEV et une maintenance aisée. Un système de pile à combustible à plusieurs stacks (MFCS) est un ensemble de piles à combustible indépendantes (P AC) de faibles puissances utilisé en lieu et place d'une PAC de forte puissance. Ainsi, les différentes modules peuvent fonctionner ensemble pour prolonger la durée de vie du système et augmenter les performances. Néanmoins, le Tableau 1-1 présente évaluation du coût du système de 25 kW à mono et multi PAC, ce qui montre que le coût initial d'un MFCS est plus élevé. La répartition de puissance entre les P ACs doit être contrôlé par une stratégie de gestion de l'énergie. Les stratégies peuvent être catégorisées en deux grands groupes : basées sur des règles et basées sur l'optimisation. Le groupe à base de règles comprend des règles déterministes et logique floue, qui peuvent apparaître sous la forme d'approches conventionnelles, adaptatives et prédictives. Le groupe à base d'optimisation est composé d'une optimisation globale et en temps réel dans laquelle une fonction de coût est utilisée pour définir la consommation de combustible et l'efficacité du système. Cette thèse traite de
v
la conception d'une stratégie en ligne pour un MFCS dans une connexion parallèle, comme cela est montré dans la Figure 1.4, pour améliorer l'économie de combustible ainsi que la durée de vie des P AC. À cet égard, une stratégie à deux couches est proposée pour partager la puissance entre quatre P ACs et une batterie. La première couche (locale à chaque P AC) est responsable de la détermination en tout temps de la puissance maximale réelle et de l'efficacité de chaque PAC, étant donné que la variation des conditions de fonctionnement et le vieillissement influencent sensiblement les performances des P AC. Cette couche est composée d'un modèle semi-empirique et d'un filtre de Kalman. Ces modèles contiennent des paramètres physiques significatifs, qui permettent à un expert d'analyser les résultats de manière pratique. Dans ce travail, un modèle électrochimique proposé par Amphlett et al. est utilisé. Ce modèle est pour un nombre de cellules connectées en série et suppose le même comportement pour toutes les cellules. Dans ce modèle, la tension de sortie de la pile PEM (VFc) est perçu comme la somme du potentiel de cellule réversible (ENernst) et de trois chutes de tension, à savoir activation (Vact ), ohmique (Vohmic) et concentration n'con)'
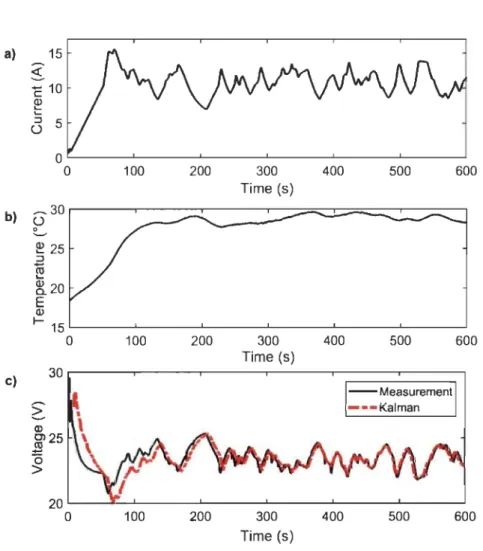
Le filtre utilisé met à jour les paramètres du modèle pour compenser les dérives de performance des FC. Le modèle discuté présente huit paramètres à identifier, qui sont listés dans au Tableau 2-1, avec les plages de variation correspondantes. L'intégration du filtre de Kalman pour estimer les paramètres du modèle d'une P AC réelle est illustrée à la Figure 2.6. Le filtre de Kalman est considéré comme un estimateur optimal et il peut estimer les paramètres d'intérêt à partir d'observations imprécises et incertaines. La Figure 2.7 présente un profil de courant et la tension et la température de mesure d'une PEMFC Horizon de 500 kW avec un cycle de conduite UDDS d'échelle, qui représente la condition de conduite urbaine. Dans la Figure 2.7, le tracé c) indique la comparaison de la tension estimée par la
modélisation en ligne avec la tension mesurée de la PAC. Comme il est observé, le modèle en ligne proposé est capable d'estimer la tension avec une précision satisfaisante. La Figure 2.8 compare la courbe de polarisation obtenue et la courbe de puissance du modèle en ligne avec les courbes de la P AC réelle. Selon cette figure, le modèle peut prédire la puissance maximale et le comportement de polarisation de la PAC avec une précision acceptable.
La deuxième couche (gestion globale) est responsable de la répartition de la puissance entre les composants. Cette couche prend en compte deux entrées par P AC, la puissance et l'efficacité maximales déterminées en temps réel par la première couche, ainsi que l'état de charge de la batterie (SOC) et la puissance demandée par le train de puissance pour effectuer le partage de puissance. La stratégie proposée, appelée stratégie de machine d'état adaptative, est illustrée à la Figure 3.5. Il utilise les deux premières entrées pour trier les PAC par la puissance maximale et les autres entrées pour faire l'allocation de puissance. L'objectif principal de cette stratégie est de minimiser le nombre de P AC pour fournir l'énergie requise et utiliser les PAC de manière efficace. Pour ce faire, elle utilise chaque P AC du point d'efficacité maximum jusqu'à la puissance maximale, en commençant par le P AC avec les meilleures performances. Les résultats finaux de la stratégie suggérée sont comparés à deux méthodes de partage de puissance couramment utilisées, à savoir Daisy Chain et Equal Distribution. La validation de la performance de la stratégie proposée est réalisée sur un banc d'essai développé au moyen de la technique « hardware-in-the-Ioop » (HIL). L'émulateur HIL développé peut être considéré comme un émulateur HIL complet pour le véhicule Némo, qui est un véhicule de laboratoire. Les spécifications de ce véhicule sont énumérées dans le Tableau 2-1. Comme on peut le voir sur la figure 1.4, il est composé d'une P AC réel, qui est un PEMFC Horizon 500 W à cathode ouverte, trois émulateurs PEMFC, qui seront discutés
Vil
au Chapitre 2, un modèle mathématique de batterie et quatre convertisseurs de courant continu. Afin d'étudier la performance de la stratégie proposée, trois scénarios différents ont été conçus. Dans le premier scénario, un profil de puissance de rampe a été utilisé pour montrer clairement la différence entre la distribution de la puissance entre les sources par les trois stratégies. Le deuxième scénario traite de l'évaluation des performances des stratégies tout en utilisant un vrai profil de conduite du véhicule Némo. Enfin, le dernier scénario a été conçu en utilisant un très long profil de puissance aléatoire pour évaluer le taux de dégradation des P ACs. Les résultats de la stratégie proposée indiquent une amélioration prometteuse de la performance globale du système et un accroissement de la durée de vie du système en réduisant le temps de fonctionnement du FC avec un taux de dégradation plus élevé comme le montre la Figure 3.15.
Abstract
This thesis deals with design of an online energy management strategy (EMS) for a multi-stack fuel cell system (MFCS) to enhance the fuel economy as well as the fuel cells (FCs) lifetime. In this respect, a two-Iayer strategy is proposed to share the power among four FCs and a battery pack. The first layer (local to each FC) is held solely responsible for constantly determining real maximum power and efficiency of each FC since the operating conditions variation and ageing noticeably influence FCs' performance. This layer is composed ofa FC semi-empirical model and a Kalman filter. The utilized filter updates the FC model parameters to compensate for the FCs' performance drifts. The second layer (global management) is held accountable for splitting the power among components. This layer takes two inputs per each FC, updated maximum power and efficiency, as well as the battery state of charge (SOC) and power train demanded power into account to perform the power sharing. The proposed EMS, which is called adaptive state machine strategy, employs the first two inputs to sort the FCs out and the other inputs to do the power allocation. The ultimate results of the suggested strategy are compared with two commonly used power sharing methods, namely Daisy Chain and Equal Distribution. The results of the suggested EMS indicate promising improvement in the overall performance of the system. The performance validation of the proposed strategy is conducted on a developed test bench by means of hardware-in-the-Ioop (HIL) technique.
ix
Acknowledgments
First, 1 would like to thank my director, Professor Loïc Boulon, for his constructive comments and valuable guidance over my different stages of research. 1 am grateful to him for all the support during my internship period and the Master degree. 1 also thank the Mitacs Globalink and UQTR Foundation for the financial support.
1 want to thank my co-director, Professor Hicham Chaoui, for the constant inspiration and valuable pieces of advice. He provided me with the tools that 1 needed to choose the right direction.
1 am grateful to Professors Daniel Massicotte, Sousso Kelouwani, and Nadia Yousfi, for their encouragement and practical advice. 1 also want to thank to all my colleagues at the Hydrogen Research Institute for the nice working environment and all the good times shared.
Thanks to my friends during my master studies at Trois-Rivières, for all the trips, and outdoor activities during the summer and winter. Thanks to all the Persian communities for the warm weI come and making me feel at home.
Special thanks to my friend Mohsen Kandi for his priceless contributions to make this work possible. 1 could not have imagined having a better friend and advisor for my Master study.
Last but not the least; 1 would like to thank my family: my parents Maria deI Carmen and Lorenzo, my brother Guillermo, and Elena for all the support and never letting me down.
Contents
Résumé ... iv
Abstract ... viii
Acknowledgments ... ix
Contents ... x
List of Tables ... xii
List of Figures ... xiii
Chapitre 1 - Introduction ... 15 1.1 Motivation ... 15 1.2 Literature review ... 19 1.3 Objective ... 24 1.4 Methodology ... 26 1.5 Thesis outline ... 27
Chapitre 2 - Modeling and Online Identification of a Fuel Cell System ... 28
2.1 Introduction ... 28
2.2 Power train model ... 29
2.3 Battery and DC-DC converter models ... 31
2.4 PEMFC modeling ... 32
Xl
2.4.2 Resistor measurement ... 37
2.4.3 Online parameter identification ... 39
2.4.4 Results and discussion ... 43
2.5 Emulator design ... 49
2.5.1 Dynamic modeling ... 51
2.5.2 Model calibration ... 56
2.5.3 Results and discussion ... 61
2.6 Synopsis ... 64
Chapitre 3 - Energy management strategy design ... 65
3.1 Introduction ... 65
3.2 Multi-stack fuel cell system configuration ... 66
3.3 Energy management strategy ... 69
3.4 Results and discussion ... 73
3.4.1 Scenario 1: ... 74
3.4.2 Scenario 2: ... 79
3.4.3 Scenario 3: ... 81
Chapitre 4 - Conclusion ... 85
List of Tables
Table 1-1 25 kW Material handling equipment PEM MFCS analysis per unit
[13] ... 18
Table 2-1 The unknown parameters of the semi-empirical model ... 37
Table 2-2 CUITent levels and PEMFC stack temperature during resistor measurement ... 38
. . Table 2-3 Kalman filter customization for the identification problem ... 42
Table 2-4 Average value of the estimated parameters (activation and concertation) ... 47
Table 2-5 Targeted parameters for model calibration ... 55
Table 2-6 DE parameters for definition ... 61
Table 2-7 Targeted parameters for model calibration ... 63
Table 3-1 Initial conditions for performing the ramp profile test ... 75
Table 3-2 Hydrogen consumption for the studied strategies and percentage reduction ofthe proposed strategy ... 81
Table 3-3 Degradation rate ... 82
Table 3-4 Hydrogen consumption comparison for the 300-h test and percentage reduction ofthe proposed strategy ... 84
Xl1l
List of Figures
Figure 1.1 Schematic diagrarn of a FCV drivetrain system ... 16
Figure 1.2 Classification of energy management strategies ... 20
Figure 1.3 MFCS configuration along with the EMS demonstration ... 25
Figure 1.4 The full-scale HIL ... ~ ... 27
Figure 2.1 Battery equivalent circuit.. ... 31
Figure 2.2 PEMFC model categories ... 32
Figure 2.3 Evolution range of the PEMFC internaI resistor with respect to CUITent (a) and temperature (b) [47] ... 39
Figure 2.4 Different ways of processing the measured data in identification process ... 40
Figure 2.5 Online PEMFC modeling procedure ... 41
Figure 2.6 The employed set up for testing the online modeling ... 44
Figure 2.7 The voltage estimation result. a) Applied CUITent profile to the PEMFC system, b) Measured temperature, c) Comparison of measured and estimated voltage (MSE: 0.1475) ... 45
Figure 2.8 Polarization curve a) and Power curve b) for the experimental and estimated curves by mean of Kalman filter with a MSE of3.44 (by using the extracted pararneter at 200 s) ... 46
Figure 2.9 PEMFC internaI resistor evolution ... 47
Figure 2.10 The fluctuation of the activation loss pararneters ... 48
Figure 2.11 The variation of the concentration loss pararneter.. ... 49
Figure 2.12 The PEMFC system emulatof. ... 52
Figure 2.13 DE parameter evolution process for two-dimensional cost function [65] ... 57
Figure 2.14 DE flowchart ... 59
Figure 2.16 CUITent profile for testing the emulator ... 62
Figure 2.17 Voltage and temperature prediction by the emulator for dut y cycle of 34, voltage evolution a), and temperature evolution b) ... 62
Figure 2.18 Voltage and temperature prediction by the emulator for dut y cycle of 100, voltage evolution a), and temperature evolution b) ... 63
Figure 3.1 Operating characteristics of a PEMFC system from maximum efficiency to maximum power ... 66
Figure 3.2 multiple FC stack system architectures ... : ... : ... 67
Figure 3.3 Different configurations in a MFCS with DC-DC converters ... 68
Figure 3.4 Parallel architecture of the utilized MFCS ... 69
Figure 3.5 MFCS EMS configuration ... 70
Figure 3.6 Adaptive state machine EMS ... 72
Figure 3.7 Ramp profile ... 75
Figure 3.8 Power split for Condition l, a) Equal distribution, b) Daisy Chain, and c) Adaptive State Machine ... 77
Figure 3.9 Power split for Condition 2, a) Equal distribution, b) Daisy Chain, c) Adaptive State Machine ... 78
Figure 3.1 0 Hydrogen consumption for the two conditions using the ramp profile ... 79
Figure 3.11 HWFET profile, a) Speed profile, b) Requested power from Nemo drive train ... 79
Figure 3.12 Power split for the three strategies, a) Equal distribution, b) Daisy Chain, and c) Adaptive State Machine ... 80
Figure 3.13 Random step power profile unit ... 81
Figure 3.14 Maximum power evolution during the 300-h test. a) Equal distribution, b) Daisy Chain, c) Adaptive State Machine ... 83
Figure 3.15 Operation time of each PEMFC during the 300-h test ... 83
Chapitre 1 - Introduction
1.1 Motivation
Anthropogenic emission of carbon dioxide has been dedared as one of the leading causes
of global warming around the world. In this regard, transportation sector is recognized as a
primary contributor of emitting a noticeable amount ofthis greenhouse gas to the atmosphere
mainly due to the combustion of fossil fuels such as gasoline in internaI combustion engines
(lCEs). Passenger cars are viewed as the principal source of transportation-related
greenhouse gas discharge. Therefore, replacing the fossil fuel dependent energy sources by
cleaner ones to power the vehicles can be stated as a vital step to defuse this global crisis.
Thanks to the technological ad van ces in the electrification of vehicles' powertrains,
several cleaner substitutes have been proposed for conventional vehicles. Hybrid electric
vehicle (HEV) is one of the commercially available candidates, which is composed of a
smaller ICE and an electric propulsion system. Although HEV generates less pollution than
the conventional vehicle, it is still dependent on fossil fuels. Another potential substitute is
pure battery electric vehicle (BEV), which is run on just batteries. BEV is a zero-emission
vehicle. However, it suffers from two main disadvantages oflong recharging time and limited
driving range. The discussed drawbacks of the available options have created the basis for
Among various types of fuel cells, proton exchange membrane fuel cell (PEMFC) has interesting characteristics, like low-temperature operation, high power density, and solid electrol yte to be utilized in a fuel cell vehicle (FCV) [1]. FCV s do not possess the restrictions of their rivaIs and benefit from particular assets, such as higher efficiency than ICEs, more autonomy than BEVs, easy maintenance, and being eco-friendly, by comparison [2]. FCVs powertrain is composed of a PEMFC as the primary power source, and a secondary source . . . . such as battery pack or/and supercapacitor, as shown in Figure 1.1. FCV sare experiencing a steady growth in the automotive market and several car companies have started introducing their products such as Honda FCX Clarity (2007), Mercedes-Benz F-Cell (2010), Hyundai Tucson FCEV (2014), Toyota Mirai (2015), Riversimple Rasa (2016), and Honda Clarity Fuel Cell (2016). Hydrogen Battery Pack Electric Motor Wheels
Figure 1.1 Schematic diagram of a FCV drivetrain system
However, sorne challenges have been posed to the development of this technology and FCVs need to rise to these challenges to be able to penetrate into the automotive market [3]. Sorne ofthese challenges are related to the renewable hydrogen production with comparable cost to fossil fuels, advances in material-based hydrogen storage, and providing the necessary infrastructures such as hydrogen stations, which are all in progress parallel to one another. Apart from the stated ongoing purposes, FCV s need to attract public attentions by offering a feasible substitute for conventional vehicles, particularly in terms of performance, reliability,
17
durability, and cost, to succeed in this super-competitive market. The existing cost projections ofFCVs are mainly based on the presumption oflarge series production, usually 500,000 units / year. Therefore, in addition to performance and reliability, reaching the economy of scale can be considered highly important in the success of this technology in the confronted competition. The concept of using multi-stack fuel cell system (MFCS), which has been put forward recently [4], can be considered as a potential solution for the mentioned challenges regarding performance, reliability, and cost. A MFCS is an arrangement of low-power independent FCs, rather than one high-power FC, which can work together [5]. MFCSs can be configured in a way to lead to several economical and technical merits. In tenns ofperfonnance, a MFCS can bring about high level of efficiency for the whole system.
It is mainly due to the fact that a single fuel cell system has just one optimal operating point as opposed to a MFCS which has several optimal points. Regarding the reliability, the modular configuration in a MFCS, i.e. one converter per FC allowing independent control,
provides a degraded mode of operation which is not accessible in single stack systems. This modularity makes the PEMFC system fault tolerance and enables the system to keep operating in case of a FC malfunction. Concerning the cost, it can be stated that employing a MFCS can help reaching the economy of scale and large-scale production numbers in the intended source of power. In fact, in a MFCS, the same module ofPEMFC, which is produce in one production line, can be used for a wide range application in tenns of the rated power because just the number of modules can be increased or decreased to meet the demand. On the other hand, the initial cost development of a MFCS is higher than a single stack system [6]. However, this drawback can be compensated by the discussed scale economy of modular configuration [7, 8]. The use of another source of energy, such as a battery pack,
that FCs have slow dynamics and are not capable of storing energy. The extra source reduces degradation rate of the FC by absorbing the power peaks and is also used for energy recovery. Common structures for hybridization of FCV s are FC-battery, FC-SC, and FC-battery-SC. AlI of these structures have their own advantages and disadvantages [9]. However, among them, FC-battery structure has been widely employed in practical FCV s [10, Il]. Among the existing rechargeable batteries, Li~ion battery is considered as a potential secondary source in FCVs since it has the merits of high capacity, several charge-<iischarge cycles and acceptable cost [12]. A cost breakdown of single and multi-fuel cell system of 25 kW is presented in Table 1-1. In this comparison, the same battery and hydrogen tank have been used in order to preserve the same energy capacity and compare capital costs, though the two systems could present different performances.
Table 1-1 25 kW Material handling equipment PEM MFCS analysis per unit [13]
Component Single FC MFCS Battery $ 10,000 $ 10,000 H ydrogen tank $ 3,373 $ 3,373 DC/DC converter $ 6,024 $ 4,990 Auxiliaries $ 7,717 $ 15,968 Labor cost $ 2,271 $ 3,527 Fuel cell $ 6,972 $ 8,740 Total $ 36,357 $ 46,598
With aIl the promising features of a MFCS and hybridization of sources, the performance of a FCV is influenced by a number of factors mainly due to the several sources with various
19
features. In this respect, the operating points of different components need to be determined efficiently by an energy management strategy (EMS) to increase the overall performance of the system. Indeed, this is the design of a suitable EMS which makes most of the above-mentioned advantages of MESs, such as reliability, durability, degraded mode operation, and even cost decline, feasible. The flexible structure of the MFCSs provide the powertrain with more degrees of freedom in terms of designing an EMS though the system becomes more complex to control.
1.2 Literature review
The overall performance of a FCV in terms of fuel or energy consumption significantly depends on the efficient coordination of powertrain component. TraditionaIly, an EMS attempts to optimize the fuel consumption of the system, without sacrificing the driving performance of the vehicle. It manages this important task through controlling the power flow between the PEMFC, battery, and the drive train. A well-designed EMS should assure reaching the following terms:
• The demanded power is always met by the output power of the electric motof. • The state of the energy is always maintained within an optimal range in the battery. • The PEMFC system operates within its optimal operating region.
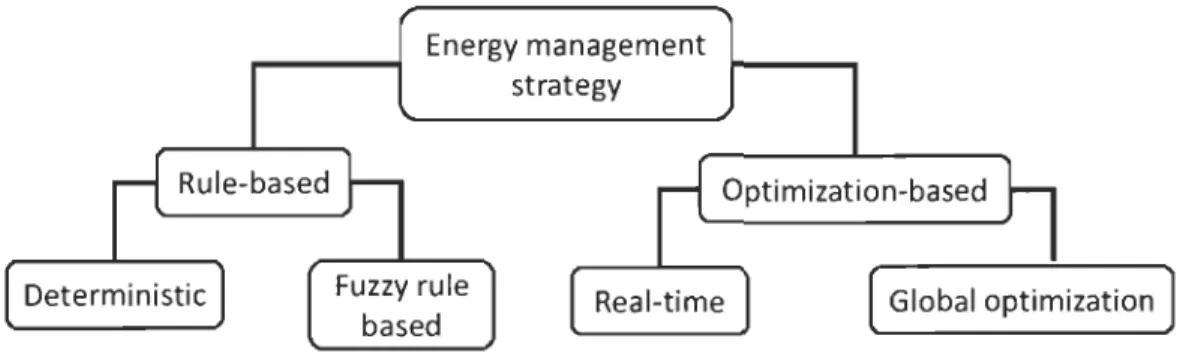
Several EMSs have been utilized for splitting the power in the previously-discussed structures in FCVs. The majority of EMSs deal with a single-stack FC system. However, these methods are applicable to a MFCS with slight modifications. The existent EMSs in the literature fall into two categories ofrule-based and optimization-based [9, 14], as represented in Figure 1.2 .
Energy management strategy
Optimization-based
Figure 1.2 Classification of energy management strategies
The rule-based group comprises deterministic and fuzzy rule-based [15], which can appear in the form of conventional, adaptive, and predictive approaches. The optimization-based group is composed of global and real-time optimization in which a cost function is utilized to define fuel consumption and system efficiency. As mentioned earlier, there are a few works in the literature to touch on the subject of EMS design for MFCSs.
The following works fit into the first category of the presented EMSs. In [16] a simple rule-based EMS, composed of four FCs and a battery, is investigated in simulation. This control strategy considers 4 cases based on the SOC of the battery to adjust the requested energy from the FCs. In [4], a two-layer EMS is applied to a MFCS. The first layer is astate vector machine, which decides when to start or stop a FC based on the demanding power. The second layer sets the power level for the active FC by means of a rule-based algorithm. In [17], two simple rule-based algorithms are implemented in a MFCS with a parallel structure. The main purpose of the mentioned work is to demonstrate that parallel architecture can lead to a modular system in which the FC system is able to keep working even after losing one of the FCs. In [18], three power sharing algorithms, namely equal distribution,
daisy chain, and optimal power splitting are compared. The comparison reveals that the optimal power splitting approach performs much better in high power region. In [17, 19], the
21
first two power sharing algorithms of the previous work are tested for a degraded mode operation scenario, where one of the FCs stops working. The influence of driving condition over the design of an EMS for a single fuel cell system has been considered in [20, 21], which is valid and expandable for multiple source systems. An optimized fuzzy logic controller (FLC) considering different traffic conditions is suggested in [21], and an adaptive FLC based on pattern recognition is proposed in [20]. . . These manuscripts indicate that the . . perfonnance of a FCV is strikingly affected by the driving condition variations, and this is due to the fact that the fuel consumption is the direct result of the driving patterns fonned by the traffic condition. Another type of rule-based EMS which has been successfully tested for multiple source systems is state machine based strategies [22-24]. This type of EMS can coordinate multiple units to meet the power demand while respecting the intrinsic characteristics of the sources. To do so, the power distribution is done with respect to the state change and the safe operating zones of the power sources. In brief, the rule-based strategies are simply implementable in real-time applications. However, they might result in the operation far from the optimal since the design is not based on the infonnation of the whole trip. This weakness can be compensated by combining this methodology with other principles such as operating point tracking and optimization methods.
The second category of EMSs is based on optimization strategies which minimize a defined cost function by using global and real-time optimization techniques. Global optimization strategies usually have a priori knowledge of driving cycle, which can be translated to the demanded power from the FCV. These methods are usually applicable in the design of offline strategies, which can be utilized as a reference for evaluating new strategies. They also require a lot of time and cannot be used for real-time applications. In
[25], genetic algorithm is utilized to minimize the fuel consumption in a range extender vehicle by investigating several scenarios in terms of architecture and driving cycles. In [26], a multi objective optimization problem has been defined with the aim ofminimizing the fuel consumption and vehicle cost by means of particle swarm optimization method. On the other hand, real-time optimization methods use an instantaneous cost function which only depends on the present data. In [27], a neural network modeling strategy is proposed to predict the . . .
behavior of a MFCS composed of four FCs. The application ofthis modeling technique is in the EMS design by means of model predictive control. There sorne other methods which use the optimal trajectory achieved by global optimization methods and try to devise a mIe based method to improve this trajectory response for a wide range of conditions or cases. In [28], a multi-objective optimization method is proposed to ameliorate fuel economy as weIl as system durability. The proposed method is designed based on the results achieved by dynamic programming, and then the performance of the system is improved by altering the size of the battery. In [29], a combinatorial optimization approach is utilized to improve the decision making quality of the EMS off-line by a piecewise linearization of the supercapacitor power los ses curve. In [30], a real time optimization strategy is implemented to reduce the hydrogen consumption, by searching the global maximum point in a virtual environment. Convex programming formulation, which benefits from a fast computational time, is proposed, in [10], to optimize the EMS as weIl as the main component sizes. In [31], a real time linear optimization is proposed for a MFCS, to find the optimal subset of FC to reach a constant demand during a specific time. This method estimates the remaining useful life to deduce the evolution of maximum and nominal power of each FC. To sum up, the global optimality can be reached by having the trip information in advance. Other cases may
23
lead to real-time optimality by defining an instantaneous cost function and introducing the necessary limitations to ensure self-sustainability of the electrical path.
The majority of the existing EMSs, regardless of their category or type, are premised upon
Fe
maps or unvarying-parameter mathematical models. In this light, these results remain valid only within a specific operating range. However, the energetic performance of aFe
alters by the operating conditions and degradation level variations through the time. Sorne solutions based on extremum seeking strategies have been proposed to deal with the moving characteristics of theFe
systems. The frrst suggestion is to use the maximum power point tracking methods, such as perturb and observe or hill climbing, to track the real performance of aFe.
Such strategies have been used in [32-34] for EMS purposes due to their convenient implementation. However, these methods are not very suitable for simultaneous identification of several characteristics, such as maximum power and efficiency points, in online applications since they require a separate search stage for each feature extraction. The second solution is the use of a parameter identification method coupled with an optimization algorithm. The identification is performed by using an online parameter estimation method and a greylblack box model [35]. Although the black box based strategies are easily applicable in real-time situations, they do not provide any insights into the physical phenomena inside theFe
and might become unreliable in case of confronting new situations. Moreover, the analysis of the results become more difficult with black box models due to the ambiguous input-output relationships. In this regard, the employment of semi-empirical models has come under attention. These models contain meaningful physical parameters, which enable aFe
expert to analyze the results conveniently. In [36, 37], a semi-empiricalFe
model, which is only based on cUITent, is utilized and its parameters are identified bymeans ofrecursive filters to update the states of the FC and an optimization algorithm is then employed to find the operating points. The main idea in this line of work is to update the semi-empirical model parameters by means of a recursive algorithm and then apply the EMS. Combining the operating point tracking with the EMS design has been able to improve the performance of a single-stack fuel cell system, as reported in [38). In this regard, this concept seems to be worthwhile to be tested in the MFCSs.
With respect to the reported manuscripts, it is c1ear that the use of real-time techniques in the design of adaptive EMSs to respect the real behavior a PEMFC in a MFCS demands more attention. Several online and real-time EMSs for the application ofFCVs can be found in the literature. However, the majority ofthese works deal with single-stack systems. Even,
among the existed real-time single-stack EMSs, only few ofthem have tried to consider the real characteristics ofthe PEMFC while designing the EMS. Another worth mentioning point is that most of the existent investigations of PEMFC behavior lack the experimental validation.
1.3 Objective
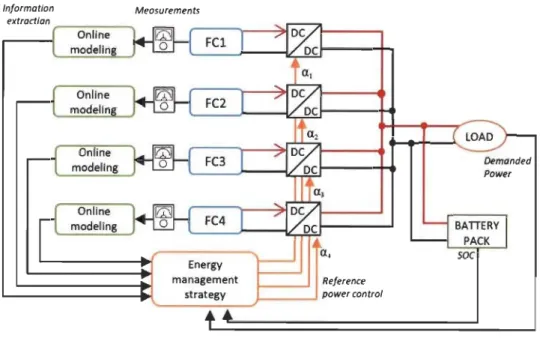
The conducted literature study has disc10sed the fact that a MFCS has several advantages over a single-stack system, such as increased efficiency, modularity, and degraded mode operation. However, benefiting from these advantages requires a suitable EMS design to provide the basis for using them. One of the most important factors to have such a strategy is to incorporate the real-behavior tracking of a PEMFC, which goes under performance drifts due to various reasons such as degradation and operating conditions variations, into the EMS design. In this regard, the principal objective of this work is to propose a new adaptive state machine based EMS for a MFCS with a parallel configuration, as shown in Figure 1.3. The
25
MFCS of this work is composed of four PEMFCs, and a battery pack, which is mainly
responsible for absorbing the peaks. The PEMFCs are connected to the DC bus individually
by a DC-DC converter to increase the system redundancy. This strategy is indeed an online
model based power-sharing methodology premised on a state machine algorithm. The state
machine algorithm distributes the power among the PEMFCs and the battery pack. In the
meantime, the strategy keepstrack ofthe PEMFCs state ofhealth by determining the present
maximum power point of each. In case of detecting maximum power drifts in the PEMFCs,
the strategy changes the order based on which it demands power from each PEMFC. It should
be noted that the online modeling is performed by using an adaptive filter to update the
parameters of a semi-empirical PEMFC model.
Informatian Measurements
Energy
management Reference
'---~L__.:.st~ra:::te~g~y
_r--...
pawercantralDemanded Power
1.4 Methodology
A three-step methodology has been followed to complete this thesis. The first step is to review the literature to provide state-of-the-art information about the proposed topic. In this regard, the recent works mainly in the area of EMS designs have been scrutinized, and the areas which are in need of more attentions have been discovered. These gaps have formed the chief objectives of this project, discussed in the previous section. In this regard, anew adaptive state machine based EMS is put forward for the presented MFCS in Figure 1.3.
The second step of this work deals with the development of a suitable PEMFC model for the EMS design. This step comprises two important parts. The first part copes with proposing a simple static online model to track the behavior of the real PEMFC. To do this, Kalman filter has been used to update the parameters of a PEMFC semi-empirical model. The second part ofthis step is about developing an emulator to imitate the behavior of a real PEMFC. The main reason for designing an emulator is to be used in the hardware-in-the-loop (HIL) simulation for validating the EMS.
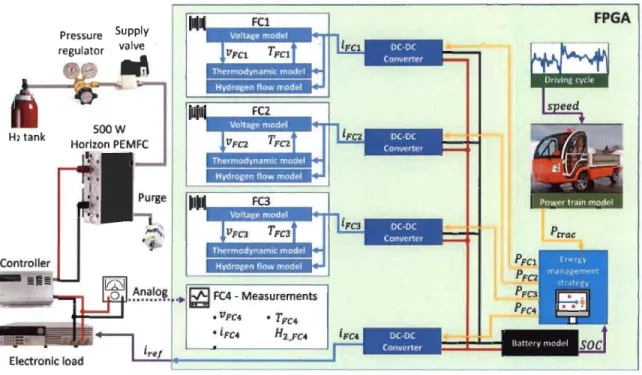
The last step of this work is designing an EMS for a MFCS. The proposed EMS of this work has two layers. The first layer is responsible for updating the semi-empirical model and the second layer distributes the power among the energy sources, which are four PEMFCs and a battery pack. It should be noted that as opposed to most of the existing EMS design researches, the results of this work have been validated by implementing the proposed strategy on a developed HIL in the Hydrogen Research Institute (IRH). HIL, which inc1udes the insertion of real components in the simulation loop, is a beneficial step to develop new EMS to test the control limitations and components restraints. Since developing a complete multi-stack PEMFC test bench is expensive, HIL emulator is used to validate the efficiency
27
of the proposed EMS. Figure lA presents the utilized HIL simulation in this work. As it can be seen, it is composed of a real PEMFC, which is an open cathode 500-W Horizon PEMFC,
three PEMFC emulators, which will be discussed in Chapter 2, a battery mathematical model,
and four simulated DC-DC converters.
H2tank Pressure regulator E lectronic load Supply valve 1.5 Thesis outline • VFC4 • T FC4 • iFC4 H2.FC4
Figure lA The full-scale HIL
FPGA
The rest of this document is organized as follows. Chapter 2 reVlews the PEMFC modeling methods, along with a detailed discussion of PEMFC online modeling and emulator design. Chapter 3 provides data on the suggested adaptive EMS and MFCS structure of this work. Chapter 4 investigates the obtained results of simulation and implementation stages. Finally, the conclusion is given with sorne suggestions for future steps conceming this work in Chapter 5.
Chapitre 2 - Modeling and Online Identification of
a Fuel Cell System
2.1 Introduction
Mathematical modeling plays a key role in the technical development of PEMFCs since it can unveil a number of features about the performance of the device and how to enhance it. GeneraIly, PEMFC modeling methods can be fallen into two categories of steady-state and dynamic. Each category has its own advantages, disadvantages, and more importantly its own application. Depending on the application, one chooses the suitable group. Regarding the
EMS design, which is the main focus of this work, steady-state models are usually used to devise the strategy [39]. This choice is firstly due to the fact that fuel cell system has a slow dynamic and will be exposed to steady demanded power. Secondly, in hybrid systems, the energy storage devices, such as battery, usually deals with the high dynamic. Therefore, a suitable PEMFC steady-state model needs to be selected for the purpose of EMS design in this work. However, since the proposed EMS of this work is an adaptive strategy based on recursive filters, the filters need a reference input signal to update the steady-state model parameters. In this regard, an emulator, which is a dynamic PEMFC model, needs to be designed to provide the filters with the necessary inputs.
This chapter starts with providing the information on the utilized fuel cell system, which is a low speed vehicle. Subsequently, it outlines the selection of a steady-state model along
with the integration of an adaptive filter to update the model online. Then, the obtained results
29
in details and the outcomes are evaluated. This chapter finishes by giving a synopsis of the main points of each investigated section.
2.2 Power train model
In this work, the developed HIL emulator can be considered as a full scale HIL emulator for Nemo vehicle, which is a laboratory-scale vehicle. The specifications of this vehicle are listed in Table 2 1 .
Table 2-1 Vehicle specification [40] Dimension L:W:H 3.48 m: 1.52 m : 1.90 m Tire 175170 R13 Weight 896 kg Max Load 453 kg Driving performance Maximum speed 40 km/h Acceleration 6.5s (0-40 km/h) Autonomy 115 km Transmission Engine ACX-2043; 4.8kW Transmission 12; 44:1 Batteries Battery series 9x US 8VGCHC XC2 Battery Type Lead-acid deep cycle Battery charger 1.3 kW
The requested power from the traction system has been estimated by the following power train model using the driving cycle speed
v
as the input [40).(2.1)
Where Face is the acceleration force, Fr is the friction of the tires, Fad is the aerodynamic drag resistance, and Fer is the resistance of climbing. For this case, it has been assumed that the vehicle is on a fiat area and both of the friction and drag resistance are uniform and constant.
The friction of the tire is calculated by:
Fr = Crr
*
mtotal*
g*
cos aslope (2.2)Where Crr is the coefficient of friction (0.015), mtotal the total mass of the vehicle (896 kg), g is the standard acceleration due to gravit y (9.81 m/s2), and aslope is the slope of the
road (0°). The drag force caused by the airfiow is calculated by the following equation, which only considers a uniform contacting surface.
Fad = 0.5
*
Pair*
Cx*
Aaero*
v
2 (2.3)Where Pair is the air density (1.2 kg /m3), Cx is the drag coefficient (0.42), Aaero is the contact surface area (4 m 2), and v is the vehicle speed (km/ h). The acceleration force is calculated by multiplying the acceleration of the vehicle (ace) by the total mass (m).
Face = aacc
*
m (2.4)After calculating the requested power (PtraJ, it is sent to the energy management strategy block. The first thing which is checked in this block is the battery
soc.
If the battery needs to be charged, one PEMFC with its maximum power will be allocated to recharge the31
battery pack. It should be noted that a hysteresis strategy has been used for the battery pack to keep the SOC level between 50 % and 95 % [41].
2.3 Battery and De-De converter models
A simple electric circuit based battery model is used to describe the battery pack ofNemo vehicle [42]. Figure 2.1 shows the equivalent circuit, which is composed of a configuration of series resistor (Rl ) and a parallel resistor (R2 ) with a capacitor (C) [42].
Figure 2.1 Battery equivalent circuit
The CUITent in the circuit is expressed by:
(2.5)
where Vo is the open circuit voltage. The SOC of the battery is calculated by using the initial charging state (SOCini ), CUITent of the battery (ibat ), and the capacity of the battery (Qr=183 Amp h)[43].
(2.6)
Since the battery and FCs are connected in parallel to the power transmission, the CUITent flow in the bus is obtained by:
As the PEMFCs are low-voltage and high-current suppliers, the use of converter has been opted to boost the voltage output. Indeed, the converter is used to control the FC current. The inductance response is represented by:
iL,eonv = _l-J(Vbat - veonv,out) dt
Lconv (2.8)
where iL,eonv is the CUITent through the inductor, Leonv is the inductance value, and veonv,out
is the output voltage of the converter. The output converter voltage is fonnulated by:
(2.9)
(2.1 0)
where mfe is a gain and the efficiency of the converter (r]) is 95%.
2.4 PEMFC modeling
The existing PEMFC models in the literature can be categorized into three groups of white box, known as mechanistic, black box, and grey box, known as semi-empirical, as shown in Figure 2.2 . Min Black box models Based on experimental data (stochastic) Physical insight Gray box models Based on empirical equations Max ~ White box models Based on mechanistic model (deterministic)
33
Mechanistic models mainly focus on clarifying the phenomena happening inside a single cell and are based on algebraic and differential equations. These equations describe the occurred processes related to thermodynamics, electrochemistry, and fluid mechanics. Mechanistic models require a wide knowledge of influencing parameters such as transfer quantities, humidity level, membrane thickness, etc. to mimic the behavior of the PEMFC over different operating conditions. However, fuel cell is a multiphysics system and a number . . . . of factors, such as degradation and operating condition fluctuation, can cause performance drifts in this system. In this regard, design of a complete mechanistic model considering aIl of the performance drifts is very difficult, time-consuming, and still a study limitation. As opposed to the mechanistic models, black box models are based on inputs and outputs data without any information about the internaI workings and physical interpretation of the parameters. Since the computational time of black box models is very low, they have been used in many studies for online vehicular applications. However, the dependability of such models decreases when facing new operating conditions, which have not been included in their training process. The last category of PEMFC modeling belongs to the semi -empirical methods, which are considered as an intermediary between mechanistic and black box types.
Semi-empirical models are usually formed by combining the physical relationships with sorne experimental data. They describe the electrochemical behavior of a PEMFC by imitating the polarization curve, which is a useful approach for both single cell and stack modeling. One of the practical applications ofPEMFC semi-empirical models is in the field of EMS design. As mentioned before, these models provide remarkable data on the polarization curve effects, such as cell reversible voltage, and activation, ohmic, and concertation voltage drops, which are very useful to investigate the relevance of the results for fuel cell researchers. Moreover, by having the polarization curve, extracting the power
curve will be very convenient and it can be used in the design of an EMS. Semi-empirical models can also become adaptive easily, which will be discussed hereinafter.
2.4.1 Semi-empirical model
In the light of the explained PEMFC modeling methods in the previous section, semi-empirical models seem to be fitted for EMS purposes. Several semi-semi-empirical models can be found in the literature [44-46]. Among them, the model proposed by Amphlett et al. has been suggested for EMS purposes in a number of different manuscripts. This model has a good mechanistic background, so it has been used in many studies [35, 39]. The other available semi-empirical models may also perform the same as this model, however, they have not had this wide application in the literature.
The proposed electrochemical PEMFC model by Amphlett et al. is for a number of cells connected in series and assumes the same behavior for aIl the cells. In this model, the output
voltage ofthe PEMFC (VFd is perceived as the sum of the reversible cell potential (ENernst)
and three voltage drops, namely activation (Vact), ohmic (Vohmic), and concentration (\'con). The general formulation ofthis model can be given by:
(2.11 )
where N is the number of cells, and the unit of VFC is volt. ENernst is calculated based on the
following theoretical formula:
ENernst = 1.229 - 0.85 x 10⁻³(T - 298.15)
+
4.3085 x 10-ST[In(PH2)+
0.5In(Po2 )] (2.12)35
where T is the stack temperature (K), PHZ is the partial pressure of hydrogen in anode side
(atm), and Poz is the partial pressure of oxygen in cathode side (atm). Vact is obtained by:
(2.13)
where (n(n = 1 ... 4) are semi-empirical parameters based on fluid mechanics,
thermodynamics, and electrochemistry, COz is the oxygen concentration (mol cm-3), and i is the PEMFC actual CUITent (A). The oxygen concentration is calculated by:
CO = P02
Z 5.08xl06 exp(-498jT)
(2.14)
The computation of the Vohmic is based on (2.5), where ~n(n
=
1 ... 3) are the parametric coefficients. This way of ohmic loss formulation has a considerable structure to avoid requiring specifie information for calculation of water content or membrane thickness.(2.15)
It should be noted that ohmic loss formulation is a function of temperature, mainly due to the fact that diffusivities and water partial pressures vary with temperature, and cUITent,
because proton and water fluxes change with the CUITent. Finally, Vron is given by: J
Vcon = Bln(l--) Jmax
(2.16)
where B is a parametric coefficient (V),
1
is the actual CUITent density (A cm -z), andlmax
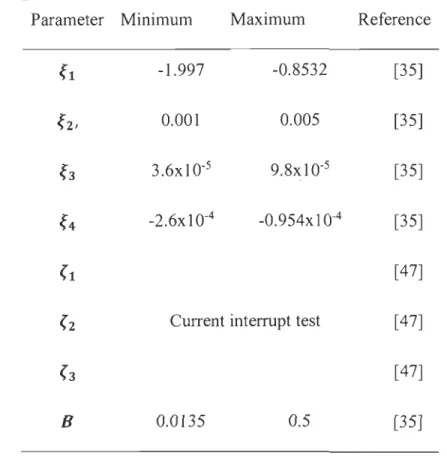
isThe discussed electrochemical PEMFC model has eight pararneters to be identified, which are listed in Table 2 1 . As previously discussed, a PEMFC system experiences sorne performance drifts during its lifetime. These drifts are because of degradation phenomenon, which happens slowly over time, and the influence of conditions which are not included in the model such as humidity. In order to take these effects into account, the model pararneters need to be updated online to adapt the model to the real state of the PEMFC system. The reported ranges of the listed pararneters in Table 2-1 have been collected from the available researches in the literature [35, 47]. That is to say, using a proper initial value is necessary for having satisfactory results while using the adaptive filters, especially when sorne of the model pararneters have physical interpretations. In this regard, a preprocessing of data is suggested to avoid a long convergence time or divergence in the pararneters and to get close to realistic results. The pre-treatrnent is performed by the Curve Fitting Toolbox™ of MATLAB software. This toolbox uses the least square methods to fit the data. Fitting requires a pararnetric model, which can relate the real data to the predictor data. In this work, the employed fuel cell model is linear in coefficients. The least square method minimizes the surnrned square of the difference between the observed and the estimated value. The employed experimental data in the preprocessing stage cornes from the conducted test for obtaining the polarization curves of the fuel cells, which is a proper representative of its behavior. This initialization method has shown that it can reach stable pararneters in 400 seconds [47]. This time is acceptable for the FC application, since the variations in the performance of the FC are slow (in order ofhours).
37
Table 2-1 The unknown parameters of the semi-empirical model
Parameter Minimum Maximum Reference
ft
-1.997 -0.8532 [35]fz, 0.001 0.005 [35]
f3
3.6x10-s 9.8x10-s [35]f4
-2.6x10⁻⁴ -0.954x 1 0-4 [35]{t
[47]{z CUITent interrupt test [47]
{3
[ 47]B 0.0135 0.5 [35]
2.4.2 Resistor measurement
In this work, CUITent interrupt test has been used as an electrochemical technique to obtain a range for the resistor variation with regard to CUITent and temperature [41-44]. This range can be used as reference to validate the estimation result of the internaI resistor (Rinternal) of the PEMFC. The practicality of this method for measuring the resistor of a PEMFC stack has been already studied in [47-49]. CUITent interrupt test measurement is based on the rapid acquisition of the measured voltage, after interrupting the CUITent in the PEMFC. The fast data acquisition is necessary to separate the ohmic loss from the activation loss, which disappears faster than electrochemical losses after CUITent interruption. Therefore, the ohmic loss can be obtained from the difference between the voltage measurement immediately before and after the interruption.
In this work, the steps for conducting the current interrupt test is completely pursuant to [47]. One of the main advantages of the CUITent interrupt test compared to other electrochemical methods is the straightforward result analysis. However, the measurement needs to be done with a fast oscilloscope to exactly catch the point in which the voltage Jumps.
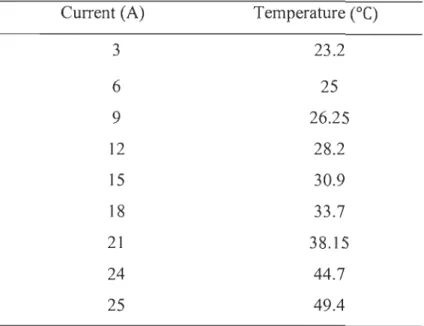
Table 2-2 presents different CUITent levels and their cOITesponded temperature in which the interruption test has been performed. It should be noted that the PEMFC has been allowed enough time to achieve a stable temperature for each current level before doing the test. The CUITent interrupt test has been performed in a forced convection condition where the fans of the PEMFC worked with a constant dut y cycle of 34%.
Table 2-2 CUITent levels and PEMFC stack temperature during resistor measurement
CUITent (A) Temperature (oC)
3 23.2 6 25 9 26.25 12 28.2 15 30.9 18 33.7 21 38.15 24 44.7 25 49.4
39
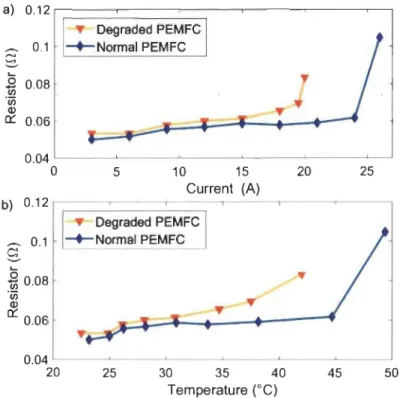
Figure 2.3 indicates the change of the resistor with regard to current and temperature for the utilized PEMFC. As mentioned before, this measurement is used as a reference to check the range of the estimated resistor by the identification algorithm.
a) 0.12 , - - - , - - - , - - - r - - - , - - - , . - - - , ~ Degraded PEMFC _ 0.1 -+-Normal PEMFC
S
'-~ 0.08 'iil ~ 0.06 - -. 0.04 '--_ _ . . i -_ _ - ' - _ _ ___'__ _ _ - - - ' _ _ _ " - - - 'o
5 10 15 Current (A) b) 0.12 .. Degraded PEMFC _ 0.1 -+-Normal PEMFCS
'-o ûj 0.08 'iil Ql Cl:: 0.06 20 25 0.04 '---'~---'---'---'---'----' 20 25 30 35 40 45 50 Temperature (oC)Figure 2.3 Evolution range of the PEMFC internaI resistor with respect to current (a) and temperature (b) [47]
2.4.3 Online parameter identification
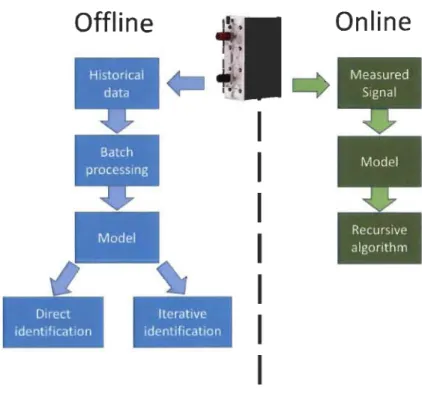
Generally, the identification pro cess can be performed offline and online, as shown in. In Figure 2.4 offline identification, the measured data is frrst saved in a data storage and then it is transferred to a computer for further analysis and evaluation. This type of identification is conducted by using batch processing of the data, which means assessing the complete data at once. Direct identification techniques, like least squares, are usually used for this type of identification. In online identification, the process is done through an online operation and the data is evaluated immediately after each sample is collected. Recursive identification
algorithms are used in online processes, which means that no data storage is required in online identification. In this work, online parameter identification is in demand. It is mainly due to the fact that, as mentioned before, the parameters of a PEMFC model are time-varying. Since the PEMFC performance is affected by degradation and operating conditions, updating the model parameters is necessary. Kalman filter and recursive least square (RLS) are two well: .. known recursive filters, which have been successfully used in different engineering problems. In [35], the robustness of RLS has been investigated and realized that its performance decreases when facing noisy data. In [35], the performance of Kalman filter and
recursive least square have been compared in the PEMFC model parameter estimation problem and conc1uded that Kalman filter benefits from more robustness. In this regard, the focus of this section is to use Kalman filter to identify the parameters of the introduced electrochemical PEMFC model online.
Offline
Direct identification Iterative identification1
1
1
1
1
1
1
Online
41
Kalman filter is considered as an optimal estimator and it can estimate the parameters of interest from imprecise and uncertain observations. Figure 2.5 shows the process of integrating Kalman filter into the parameters estimation ofthe PEMFC model.
Real VFC PEMFC Ü
+
e
...
Kalman iFC ~ filter-T
FC ~~PFC ... Sem i-em pi rica 1 VFC est
model
t
Update parametersFigure 2.5 Online PEMFC modeling procedure
Kalman filter identifies the current state parameters first and then updates them when the next measurement is received. The structure of Kalman filter is as follows:
{X(t yt ()
+
=
1) H ()=
t x t F(t ()+
+vt 1It)x(t) ( )+
w(t) ( d stea y-state mo e d 1) (2.17)x-Ct)
=
F(tlt - 1)x-(t - 1) (steady-state propagation) (2.18)P-(t)
=
FCtlt - 1)P(t - 1)FT (tlt - 1)+
Q(t - 1) (Error covariance propagation) (2.19)G(t) = P-(t)HT(t)[H(t)r(t)HT(t)
+
R(t)r1 (Kalman gain matrix) (2.20)x(t) = x-Ct)
+
G(t)(y(t) - H(t)x-(t)) (State estimate update) (2.21)where t is the discrete time, x(t) is the state vector, which is unknown and here it can be called parameters vector as weIl, x(t) is the estimate of the state vector, x-Ct) denotes priori
estimate of the state vector, F(t
+
lit) is the transition matrix, which takes the state vector from time t to time t+ 1
, w(t) is the process noise, y(t) is the output, H(t) is themeasurement matrix, v(t) is the measurement noise, pet) is the error covariance matrix,
Q(t) is the process noise covariance matrix, C(t) is the Kalman gain, R(t) is the
measurement noise covariance matrix, and 1 is the identity matrix. Table 2 3 shows the customization of the explained Kalman filter for the problem of PEMFC model parameter estimation. As it can be seen in this table, state vector is composed of the targeted parameter for the identification, and the measurement vector is in fact the coefficient of each parameter in the introduced PEMFC formulation. It should be noted that the transition matrix has been assumed to be an identity matrix, which means that the future state is guessed to be the same as the CUITent state and the error will be compensated by the filter.
Table 2-3 Kalman filter customization for the identification problem
Kalman operators Symbols Implementation description State vector x(t) [(v (2, (3, (4' (l' (2, (3, B]
[l, T, Tln(C02 ), Tln(O, - i - iT - i, , 2 , ln(l
Measurement vector H(t)
1
- - ) ]
lmax
Measured output Y(t) Measured VFC from the real PEMFC
43
2.4.4 Resu/ts and discussion
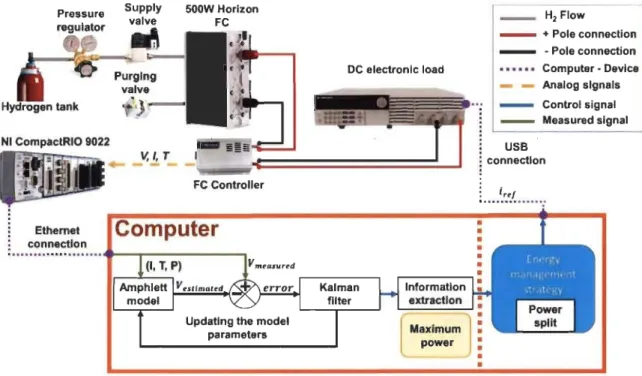
The performance assessment of the explained online modeling procedure is detailed in this section. In order to test the performance of this parameter identification process, the explained semi-empirical model with the Kalman filter have been implemented in a developed test bench in Hydrogen Research Institute (IRH) of Université du Québec à Trois-Rivières. This test bench is represented in Figure 2.6 . As it can be seen in this figure, this test bench comprises a Horizon H-500 air breathing PEMFC which is connected to a National Instrument CompactRIO through its controller. A 8514 BK Precision DC Electronic Load is used to ask load profiles from the open cathode PEMFC. According to the manufacturer, the difference between the pressure of the PEMFC in the anode side and the atmospheric pressure in the cathode side should be kept around 50.6 kPa. The pressure in the anode side is set to 55.7 kPa. The explained semi-empirical model and parameter identification method has been first designed and initialized in MA TLAB and then put into Lab VIEW software via Math Script Module. A current load is applied to the PEMFC by using the programmable DC Electronic Load, which communicates with Lab VIEW software and PC through a USB connection. The measured temperature and voltage from the open cathode PEMFC are sent to the PC with the help of the CompactRIO. The measured data are used in the implemented model for testing the identification process. The information between CompactRIO and the PC is transferred by means of an Ethernet connection every 100 milliseconds. In this respect,
it can be stated that Kalman filter receives the measured data very 100 milliseconds and update the parameters of the model before the next measurement arrives. Then the updated model can be used for extracting useful information, such as maximum power and maximum efficiency, to be used in the EMS design. After extracting the required information from the
updated model, the CUITent that leads to the maximum efficiency/power can be requested from the PEMFC via the electronic load.
NI CompàetRIO 9022 Supply valve \1,/, T
....
---Ethemet eonneetlon FC Controller
...
....
-.---,
OC eleetronle load _ H2Flow - + Pole eonneetion _ • Pole eonnection • • • • •• Computer· Deviee _ _ Analog signais - Control signal - Measured signal USB eonnection •.•. i.~~~ ••••...Figure 2.6 The employed set up for testing the online modeling
Figure 2.7 presents the CUITent profile and the cOITesponded measured voltage and temperature of the PEMFC. This CUITent profile has been extracted from the UDDS driving cycle, which represents the urban driving condition. The extraction of the demanded load profile from the UDDS driving cycle has been done by means of the IEEE VTS Motor Vehicles Challenge Simulink file available in [50], and the obtained required CUITent from the PEMFC has been scaled within the operating range of the employed PEMFC in the test bench. In Figure 2.7 subplot c) indicates the comparison of the estimated voltage by the online modeling with the measured voltage of the PEMFC. As it is observed, the proposed online model is able to estimate the voltage with a satisfying precision. Figure 2.8 compares the obtained polarization curve and power curve of the online model with curves of the real
45
PEMFC. According to this figure, the model can predict the maXImum power and
polarization behavior of the PEMFC with an acceptable accuracy. It should be noted that for
each case of prediction the mean square error (MSE) has been reported in the caption of the figures to clarify more the estimation quality. MSE shows the cumulative squared error
between the estimated voltage and the measured voltage. The lower the value of MSE, the lower the error.
a) 15 ~ ë 10 ~ .... :::J 5 () 100 200 300 400 500 600 Time (s) _30 b) () ~ ~ 25 :::J
-
co...
~20 E CI) 1- 15 0 100 200 300 400 500 600 Time (5) c) 30 - Measurement ~ - - -Kalman CI) 0)25 S ë5 > 20 0 100 200 300 400 500 600 Time (s)Figure 2.7 The voltage estimation result. a) Applied CUITent profile to the PEMFC
system, b) Measured temperature, c) Comparison ofmeasured and estimated voltage (MSE:
a) 30
~20
Q) Cl ~ (5>
10'
..
---
---
..
-- Experimental - - -Kalman
...
O~--~----~----~--~----~----~ b) 400 §'300-
~~
200 oa..
100 5 10 15 20 25 30 Current (A)Figure 2.8 Polarization curve a) and Power curve b) for the experimental and estimated curves by mean of Kalman filter with a MSE of 3.44 (by using the extracted parameter at
200 s)
Figure 2.9 represents the prediction of the value for internaI resistor of the PEMFC. The
resistor seems to be in the same range obtained by the CUITent interrupt test and it is a
promising indication for validating the estimation of this physical parameter. It should be
noted that the observed increase in the resistor evolution specifically between
a
to 100 isbecause of the utilized current profile to test the estimation. In the utilized profile, shown in
Figure 2.7 , the current profile undergoes a sudden growth which results in a temperature
increase influencing the resistor evolution. As previously-mentioned the internaI resistor is affected by operating CUITent and temperature. Table 2-4 shows the average value of
47
activation and concentration drop related semi-empirical parameters. It should be noted that the achieved parameters in this work are almost in the same range as in Table 2 4 , which have been collected from other manuscripts in the literature. The subtle difference in sorne of the parameters is probably attributable to different aging and conditions of the PEMFC systems from which the data has been obtained.
0.15,---,---~~---,,---~----~---,
-S
....
0.1~
.~ 0.05 Il:: OL---~----~L---~---~---~----~ 100 200 300 400 500 600 Time (s)Figure 2.9 PEMFC internaI resistor evolution
Table 2-4 Average value of the estimated parameters (activation and concertation)
Parameter Obtained value Minimum Maximum
(1 -1.29 -1.997 -0.8532
(2 0.0032 0.001 0.005
(3 1.3x 10-s 3.6xlQ-s 9.8xlQ-S (4 -0.952x 1 0-4 -2.6x 1 0-4 -0.954x 1 0-4
Figure 2.10 shows the change of the activation region parameters of the PEMFC with Kalman filter. As it can be seen in this figure, the parameters have sorne variation and this
small variation of the parameters overtime implies that the selected PEMFC model has an acceptable accuracy, otherwise the parameters would fluctuate a lot to compensate the lack of accuracy in the model. The fluctuation of the concentration loss parameter, achieved by Kalman filter, is shown in Figure 2.11 . It should be reminded that although the influence of degradation on each parameter is not clear, the estimation process assures that in case of having performance drifts, the parameters change to update the model to the new condition.
a) -1.295 ....;:- -1.31---~ -1.305 3.2044 r-x...!.:10"--3~~-~-~-~____, b) 3.2042 'VN 3.204 3.2038 3.2036 L-~_~_~_~~_---' 100 200 300 400 500 600 Time (5) 2.5 x10⁻⁵ c) 2 1.5 1 -945 x 10-: d) . -9.5 'V~ -9.55 -9.6 -9.65 L-~_~_~_~_~---' 100 200 300 400 500 600 Time (5)
![Table 1-1 25 kW Material handling equipment PEM MFCS analysis per unit [13]](https://thumb-eu.123doks.com/thumbv2/123doknet/14613173.732714/19.918.192.828.620.930/table-material-handling-equipment-pem-mfcs-analysis-unit.webp)