HAL Id: tel-03222191
https://tel.archives-ouvertes.fr/tel-03222191
Submitted on 10 May 2021HAL is a multi-disciplinary open access archive for the deposit and dissemination of sci-entific research documents, whether they are pub-lished or not. The documents may come from teaching and research institutions in France or abroad, or from public or private research centers.
L’archive ouverte pluridisciplinaire HAL, est destinée au dépôt et à la diffusion de documents scientifiques de niveau recherche, publiés ou non, émanant des établissements d’enseignement et de recherche français ou étrangers, des laboratoires publics ou privés.
Contribution to the investigation of the chemical
interaction between sodium and irradiated MOX fuel for
the safety of Sodium-cooled Fast Reactors
Guilhem Kauric
To cite this version:
Guilhem Kauric. Contribution to the investigation of the chemical interaction between sodium and irradiated MOX fuel for the safety of Sodium-cooled Fast Reactors. Inorganic chemistry. Université Paris-Saclay, 2020. English. �NNT : 2020UPASF027�. �tel-03222191�
Contribution to the investigation of the
chemical interaction between sodium
and irradiated MOX fuel for the safety
of Sodium-cooled Fast Reactors
Thèse de doctorat de l'université Paris-Saclay
École doctorale n° 571, Sciences chimiques : molécules, matériaux, instrumentation et biosystèmes (2MIB)
Spécialité de doctorat: Chimie
Unité de recherche : Université Paris-Saclay, CEA, Service de la Corrosion et du Comportement des Matériaux dans leur Environnement, 91191, Gif-sur-Yvette, France. Référent : Faculté des sciences d’Orsay
Thèse présentée et soutenue en visioconférence totale, le 20 Novembre 2020, par
Guilhem KAURIC
Composition du Jury
Gianguido BALDINOZZI
Directeur de recherche, Centrale Supelec, Université Paris-Saclay Président
Alexander PISCH
Chargé de recherche (HDR), SIMAP, Grenoble INP Rapporteur & Examinateur
Olivier TOUGAIT
Professeur, UCCS, Université de Lille Rapporteur & Examinateur
Lionel DESGRANGES
Ingénieur Chercheur, CEA Cadarache Examinateur
Rudy KONINGS
Professeur, JRC-Karlsruhe, European Commission Examinateur
Christine GUÉNEAU
Ingénieur Chercheur, CEA, Université Paris-Saclay Directrice de thèse
Karin POPA
Associated Professor, University of Iasi Invité
Anna Louise SMITH
Assistant Professor, Delft University of Technology Invitée
Thè
se
de doct
orat
NNT : 2020U PA SF 027Every great improvement has come after repeated failures. Virtually nothing comes out right the first time. Failures, repeated failures, are finger posts on the road to achievement. One fails forward toward success
Acknowledgments
Along these three years of PhD spent at a different place each year I met and worked with a lot of people that I would like to thank for their support.
Firstly, I would like to thank the jury members of my PhD defence: Dr. Pisch, Pr. Tougait, Pr. Baldinozzi, Dr. Desgranges, Pr. Konings, and my daily supervisors during the PhD Dr. Guéneau, Dr. Popa and Dr. Smith.
I would like to thank first Anna Smith as without you nothing would have been possible. Indeed, I discovered the research world with you during the internship I made in Delft. I loved working with you and you taught me how to behave and be a good scientist!
After the internship, you mentioned a PhD position opening and introduced me to Christine Guéneau. After the first meeting, I knew directly that you would be a person I will get along really well. This first feeling was right! All the discussions we had and the suggestions you made were extremely useful to me both on the working part but also on the personal viewpoint. So I would like to thank you for these three years that I spent fully focused on the topic!
Finally, the last place I went is the JRC-Karlsruhe. Karin you taught me how to work efficiently in a lab doing at least 10 tasks at the same time! It matched directly as we have the same concept of the lab work: run from an experiment to another one! You also taught me all the tips to work at the JRC! I will always remember your first reaction to my data: “You know your results bring more questions than answers!”
Rudy, you have always found some time to discuss the results, suggests new experiments to perform, taking care that I had everything I needed! So I would like to thank you for these amazing talks we had!
I would also like to thank the “chef de programme SFRAG” F. Serre and then F. Payot.
At the different places I met amazing people. The first person I am thinking of is Enrica. We were following each other from Paris to Delft and then back to Paris! You became more than a friend for me! I would say my big sister! I would also like to thank Elisa, Marco, Fahad, Koos, Sara, Jaèn, Fulvio and Laura for the great times we spent in Delft especially in the lab, on the beach volley court, at the bouldering gym, at Koepeltje, at BierFabrik’s, etc… Thanks to you, everyday was a new story with a lot of craziness!
I would also like to thank L. van Eijck who helped me performing neutron diffraction experiments at the PEARL reactor in TU Delft, Nicolas Clavier for the Raman measurements at ICSM and Enrica, Sara and the support team of the BM26 beamline, in particular Banerjee Dipanjan for the help received during the XAS experiments at the ESRF in Grenoble.
When I arrived in Karlsruhe, I felt directly home! This might be related to the amount of Kraüsen drank with you, especially Ema and Tommaso! When I arrived, I got directly adopted by the Italian group of JRC (I got well-trained in Delft)! I would like to thank you for the complaining coffee time, the nights spent at Vogelbraü or Stövchen, the basketball training or the climbing moments etc… Thank you Ema, Luana, Pauline, Tommaso B., Tommaso S., Concettina, Sara, Luca B, Luca L., Jone, Viktoria, Jessika, Lorenza, Laura M, Olaf, J-F aka Johnny and Petra.
I also wanted to thank the people I worked with at JRC, Cô, Herwin, Daniel, Antony, Jean-Yves, Oliver. It was a real pleasure to work with all of you and you always took the time to explain me how the machine was working and all the details! I was always bringing a lot of samples to analyse with the XRD and to do the accountancy so a second time thank you Cô, Daniel and Antony.
I would also like to thank Laura M. and T. Charpentier for their help with the NMR experiments and analyses and the INE group, especially Dr Vitova and A. Beck for the different measurements you performed on my samples at the KARA synchrotron.
Now the last place I went is the LM2T in Saclay. Everytime I was coming back for a short period or for the longer one at the end, I had the feeling I spent all the PhD there! Therefore, I would like to thank all the staff of the lab: Alain, Sylvie, Laure, Paul, Andrea, Christophe, Eric, Jean-Louis, Philippe, Laurent, Thierry, Stéphanie. I would also like to thank the “chef de labo” Stéphane Gossé and the “chef de Service” Fabrice Legendre and then Fanny Balbaud.
Finally, in Saclay I met also PhD students that were finishing, starting (even the same day as me) and maybe future PhD. I would like to thank all of you for the advices, the coffee times, the discussions… Thank you Eva, Luca S, Hector, Marie B, Mathieu, Xian, Alan, Clément.
I met a lot of new people during these different travels around Europe but now I would like to thank all the people I met before starting the PhD. For sure without you and your support from when we met to today where I am writing these words, things might have gone differently!
I will start with the Poh-lanta group. We met at High-school or later on for some of you! For sure without you guys life would have been different! Thank you Alex, Hugo, Richard, Laurent, Christian, Anna, Axelle, Martin, Marie-Alix, Marc, Laura, Matthieu.
I would like to thank Helene B. and Laure B., we shared the harsh times of prep classes together and kept contact, sharing the adventure of a life in Germany! So thank you for your support and the “short” sum up by audio!
Now I will go to people from Chimie Paris! We spent 3 amazing years all together and then split around the world but reading the messages and seeing each other as much as we could was really a way to escape from the routine! Thank you Stan, Natacha, André, Yacine, Yann, Béné, Tomas, Marion, Bastien, Cyrielle, Flavien, Marie L.P and Noémie.
I will end this part with the friends I met during my internship at CEIDRE. I will always remember the surprise you made all coming to Amsterdam without telling me and all the plans you made so that I got the surprise! Your messages in the good times but also the harsh ones were keeping me sane or at least less insane! I want to thank you for all the times we shared travelling to see each other! It was always amazing! Thank you, Audrey, Clem, Pierre, Coco, Benoît, Charlène, Léa, Willy!
Je voulais aussi remercier ma famille et surtout mes parents qui m’ont toujours soutenu et ont cru en moi et m’encourageant chaque jour me permettant ainsi de profiter au maximum des bons moments et de surmonter les épreuves qui m’ont forgées jusqu’à en arriver où j’en suis aujourd’hui ! UN GRAND MERCI !
Contents
Chapter 1: Introduction and thesis outline... 1
1.1. Context ...2
1.1.1. Sodium-cooled Fast Reactors (SFR) ... 2
1.1.2. Fuel behaviour under operating conditions ... 5
1.1.3. Severe accident conditions ... 10
1.1.3.1. Severe Accident scenarii ... 10
1.1.3.2. Fuel-sodium interaction ... 14
1.1.4. Conclusion... 17
1.2. Thesis outline ... 18
Chapter 2: Literature review ... 23
2.1. Structural and phase diagram study in the Na-O-Pu-U system ... 24
2.1.1. The Na-O-U ternary system ... 24
2.1.2. The Na-O-Pu ternary system ... 30
2.1.3. The Na-O-Pu-U system ... 36
2.1.3.1. The Na-O-Pu-U phase diagram ... 36
2.1.3.2. The Na3MO4-MO2-Na section... 37
2.1.4. Conclusion... 41
2.2. Sodium-MOX fuel chemical interaction under operating conditions ... 43
2.3. Sodium-fission products reaction ... 45
2.3.1. Iodine / sodium interaction ... 46
2.3.2. Cesium / sodium interaction ... 47
2.3.3. Molybdenum / sodium interaction ... 48
2.3.4. Tellurium / sodium interaction ... 48
2.3.5. Barium / sodium interaction ... 49
2.3.6. Conclusion ... 49
2.4. Thermodynamic modelling with the Calphad method ... 51
2.4.1. Na-O-Pu-U ... 51
2.4.2. Na-FP-O with FP: Cs, Ba, I, Mo, Te ... 54
2.4.2.1. Binary systems ... 54
2.4.2.2. Ternary sub-systems... 57
2.5. Conclusion ... 58
Chapter 4: Experimental study of the Na-Pu-U-O system ... 69
4.1. Materials synthesis ... 71
4.1.1. Nanoparticles of U1-xPuxO2 ... 71
4.1.1.1. Characterisation by XRD, TEM and ID-TIMS ... 72
4.1.1.2. Characterisation by HR-XANES ... 76
4.1.1.3. Conclusion ... 77
4.1.2. Naα(U1-xPux)βOγ phases ... 78
4.1.2.1. Ternary compounds Na2PuO3 and Na4PuO5 ... 78
4.1.2.2. Quaternary phases under argon ... 78
4.1.2.3. Quaternary phases under air ... 82
4.1.2.4. Conclusion ... 82
4.2. Structural investigation... 83
4.2.1. NaαPuβOγ compounds ... 83
4.2.1.1. The Na2PuO3 compound ... 83
4.2.1.2. The Na4PuO5 compound ... 87
4.2.1.3. Conclusion ... 92
4.2.2. Naα(U,Pu)βOγ phases... 92
4.2.2.1. The Na2MO4 and Na2M2O7 phases ... 92
4.2.2.2. The Na3MO4 phase ... 99
4.2.2.3. The Na4MO5 phase ... 103
4.2.2.4. The Na2MO3 phase ... 115
4.3. Phase equilibria in the Na-O-Pu-U system ... 118
4.4. Conclusion ... 123
Chapter 5: Experimental study of the BaO-MoO
3-Na
2O system .... 129
5.1. Literature review... 130
5.2. Characterisation of the Ba2NaMoO5.5 compound ... 135
5.2.1. Synthesis ... 135
5.2.2. Structural investigation... 136
5.2.2.1. XRD and neutron diffraction at room temperature ... 136
5.2.2.2. X-ray Absorption Spectroscopy ... 140
5.2.2.3. High temperature Raman Spectroscopy ... 144
5.2.3. Thermal expansion ... 147
5.2.4. Standard enthalpy of formation ... 149
5.2.4.1. Na2Mo2O7 synthesis ... 150
5.2.4.2. Solution calorimetry measurement ... 151
Chapter 6: Experimental study of the Cs
2O-MoO
3-Na
2O system .... 159
6.1. Literature review... 160
6.2. Phase transition data in the Cs2MoO4-Na2MoO4 system ... 166
6.3. Synthesis and structural analysis of the quaternary compounds ... 171
6.3.1. CsNaMo3O10 ... 171
6.3.2. Cs3Na(MoO4)2 ... 176
6.4. Transition enthalpy measurements ... 177
6.4.1. Na2MoO4 ... 177
6.4.2. Cs3Na(MoO4)2 ... 179
6.4.3. CsNaMo3O10 ... 181
6.5. Conclusion ... 182
Chapter 7: Thermodynamic modelling ... 185
7.1. Gibbs energy models ... 186
7.1.1. Pure elements ... 186
7.1.2. Substitutional solutions ... 186
7.1.3. Stoichiometric compounds ... 187
7.1.4. Non-stoichiometric solid compounds ... 187
7.1.5. Liquid ... 188
7.2. Optimisation procedure and results ... 190
7.2.1. The Ba-Na system ... 190
7.2.2. The Mo-O system ... 194
7.2.3. The Cs2MoO4-Na2MoO4 pseudo binary system ... 196
7.3. Conclusion ... 202
Chapter 8: General conclusion and perspectives ... 205
List of Figures
1.1. Sketch of the Sodium-cooled Fast Reactor design ...4 1.2. a) MOX fuel pellets ; b) scheme of a fuel subassembly ...4 1.3. Principle of the chain reaction ...5 1.4. Micrograph of MOX fuel pellet irradiated at 13 at. % in the PHENIX reactor. The X-ray
mapping for the grey phase precipitates, metallic precipitates and (Pd,Te) precipitates are reported in Samuelsson et al. BSE micrograph of the outer part of the pellet with qualitative EDS maps from the red dashed box taken from Cappia et al.. ...8 1.5. Summary of the main possible phases forming the JOG layer ...9 1.6. Aerosol transport and evaporation of liquid after severe accident leading to a leakage
of the first barrier containment ... 12 1.7. Description of the stages for the three types of severe accidents. The events leading to
sodium/irradiated fuel interaction are highlighted in red... 13 1.8. Schematic representation of fuel ejection from the fuel pin into the coolant channel. .. 16 1.9. Evolution of a subassembly under a TIB scenario as described by Kayser et al. ... 16 1.10. Principle of the Calphad method ... 19 2.1. Sketch of the Na-O-U ternary phase diagram. ... 24 2.2. Na-O-U phase diagram at 900 K and 1 bar reported by Pillon (red lines), and
comparison with the phase boundaries between the ternary phase fields suggested by Backburn (black dashed line). ... 25 2.3. Na-O-U phase diagram section between the theoretical composition “Na2UO3” and
Na4UVIO5 along the O/(U+Na)=1 composition line ... 26
2.4. Calculated Na-O-U phase diagram at 900 K and 1 bar by Smith et al. (red line), and comparison with the phase equilibria suggested by Blackburn(black dotted line). ... 27 2.5. Sketch of the Na-O-Pu ternary phase diagram. ... 30 2.6. Pseudo binary phase diagram on the theoretical composition Na2PuIVO3 and Na4PuVIO5
representing the different phase fields evolution on the O/(U+Na)=1 line ... 31 2.7. Ternary Na-O-Pu phase diagram at 1073 K obtained by Pillon in black line ... 31 2.8. Ternary Na-O-Pu phase diagram at 800°C obtained by Pillon in black lines and by Smith in red dotted lines ... 33 2.9. Na-M-O phase diagram at 1073 K with M=(U,Pu) reported by Pillon ... 36 2.10. Sections of Na-O-Pu-U system of interest for the sodium / MOX reaction reported by
Mignanelli et al. ... 38 2.11. Pseudo-binary diagram between Na2MO3 and Na4MO5 reported by Pillon ... 39
2.12. Representation of O-Pu-U phase diagram sections for T<1073 K. The O-U, Na-O-Pu and Na-Na-O-Pu-U systems are respectively in blue, red and black. The Na-MO2
-Na3+ξ1M1+ξ1O4+2ξ1 phase field is represented with dashed lines. The extend of the solid
solution Na3+ξM1+ξO4+2ξ is represented by ξ1, ξ2 on the phase diagram. ... 40
2.13. Calculated phase diagrams of the Na-O (a) and Na-U (b) systems with the Calphad model reported by Smith et al. ... 52
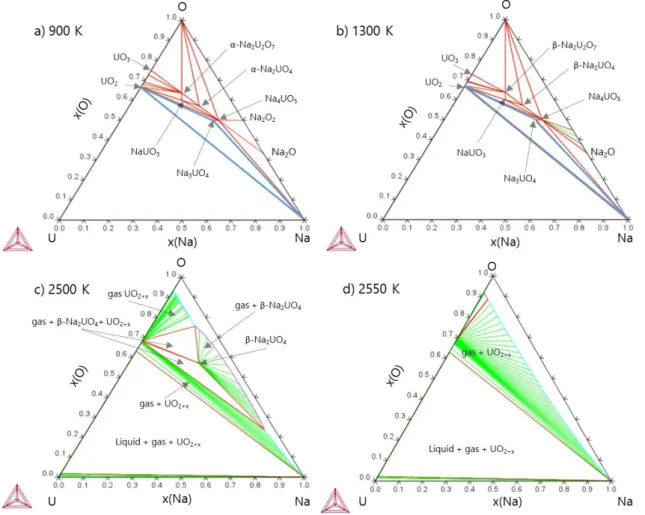
2.14. Calculated isothermal sections of the Na-O-U system at 900 K (a), 1300K (b), 2500K (c), 2550K (d) using the Calphad model of Smith et al. [6]. The stable ternary compounds at the temperature considered are reported on the sections. The UO2-Na3UO4-Na phase
field is represented in blue on fig a) and b). ... 53
2.15. Calculated phase diagrams of Cs-Na, Na-Te and Na-NaI systems... 56
2.16. Na-Ba phase diagram reported by Pelton ... 56
3.1. The PhD project organisation ... 65
4.1. Synthesis routes for the (U1-x,Pux)O2 ... 71
4.2. XRD patterns of U1-xPuxO2(+y) nanocrystals obtained by decomposition of oxalate under the hot compressed water conditions. ... 73
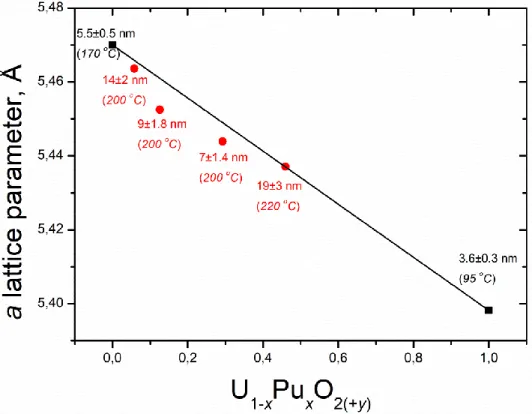
4.3. Evolution of the lattice parameter as a function of the substitution degree x in the U1-xPuxO2(+y) solid solutions. ... 74
4.4. Transmission electron micrographs of nanocrystalline U0.707Pu0.293O2+y. In (a), an agglomerate of nanocrystals has been observed; (b) shows a zoom on an agglomerate where nanocrystals can be better observed. ... 75
4.5. XRD pattern of MOX-29 obtained before and after annealing (800°C for 20 h) ... 75
4.6. U M4 HR-XANES spectra of the MOX-6, -12 and -29 samples and the BiUVO4 and UO2 references. Lines A and B mark the peaks characteristic for UIV and UV. ... 76
4.7. Comparison between the observed (Yobs, in red) and calculated (Ycalc, in black) X-ray diffraction patterns of Na2PuO3. Yobs-Ycalc, in blue, is the difference between the experimental and calculated intensities. The Bragg reflections’ angular positions are marked in blue. Measurement at λ=Cu-Kα1. ... 84
4.8. 23Na central transition MAS-NMR spectra of Na 2PuIVO3 recorded using a) a single π/12 impulsion and b) an MQMAS experiment. In red rectangles, we identify the four different sodium sites. ... 85
4.9. Pu M5-edge HR-XANES (a) and post-edge (b) spectra of Na2PuIVO3 sample and PuIVO2 reference ... 86
4.10. Comparison between the observed (Yobs, in red) and calculated (Ycalc, in black) X-ray diffraction patterns of Na4PuO5 (blue) and PuO2 (red). Yobs-Ycalc, in blue, is the difference between the experimental and calculated intensities. The Bragg reflections’ angular positions are marked in blue. Measurement at λ=Cu-Kα. ... 88
4.11. 23Na MAS NMR spectra of Na 4UO5 from Smith et al. [23] and Na4PuO5 (black line) and their corresponding fits (red dashed line). ... 89
4.12. Pu M5-edge HR-XANES (a) and post-edge (b) spectra of Na2PuO3, Na4PuO5 and Na2MO4-6% (PuVI reference) samples and PuO2 reference. ... 90
4.13. Evolution of the a cell parameter in the solid solution Na2U1-xPuxO4 with the Pu/(U+Pu) ratio. Symbols are half filled when several phases were observed. ... 93
4.14. Volume evolution in the solid solution Na2(U1-xPux)2O7 with the Pu/(U+Pu) ratio. Symbols are half filled when several phases were observed. ... 95
4.15. Pu M5-edge HR-XANES (a) and post-edge (b) spectra of Na2U1-xPuxO4-6%, Na2(U1-xPux)2O7-6% and Na2(U1-xPux)2O7-12% samples and PuO2 reference. ... 96
4.16. U M4-edge HR-XANES (a) and post-edge (b) spectra of Na2MO4-6%, Na2M2O7-6% and
Na2M2O7-12% samples and UO2 reference. ... 97
4.17. Comparison between the observed (Yobs, in red) and calculated (Ycalc, in black) X-ray
diffraction patterns of Na2UVI0.94PuVI0.06O4 (blue). Yobs-Ycalc, in blue, is the difference
between the experimental and calculated intensities. The Bragg reflections’ angular positions are marked in blue. Measurement at λ=Cu-Kα1. ... 98 4.18. Comparison between the observed (Yobs, in red) and calculated (Ycalc, in black) X-ray
diffraction patterns of the “NaOH-12h” batch sample synthesized with MOX-46. Yobs
-Ycalc, in blue, is the difference between the experimental and calculated intensities. The
Bragg reflections’ angular positions are marked in blue for Na3MO4 and in green for
MO2. Upper: Na3MO4, Lower: MO2. Measurement at λ=Cu-Kα1 ... 100
4.19. Cell parameters reported for the mixed oxide cubic phases attributed
to Na3U1-xPuxO4. Comparison with the data of Scholder and Gläser (Na3UO4), Smith et
al. (Na4UO5), Mignanelli and Potter (Na3PuO4), Keller et al. (Na4PuO5) and Bykov et al.
for the cubic end-members and Pillon and Housseau for the cubic Na3MO4 mixed
oxides. ... 101 4.20. Cell parameters and volume of Na4MO5 obtained after Lebail refinement of the Na2CO3
sample XRD data, compared with data of Pillon for Na4UO5 and Na4MO5 and Bykov et
al. for Na4PuO4.5. Symbols are half filled when several phases were observed ... 104
4.21. 23Na MAS NMR spectra of data from Smith et al, Na
4MO5-6 and Na4PuO5 and their
corresponding fits (red dashed line). ... 105 4.22. Pu M5-edge HR-XANES (a) and post-edge (b) spectra of Na2PuIVO3, Na4PuVO4.5,
Na2MO4-6, Na4MO5-6 samples and PuIVO2 reference. (Spectra have been shifted on the
y axis to better distinguish the different measurement)... 106 4.23. Cell parameters of Na4MO5 obtained after Lebail refinement of the XRD data of the
NaOH sample and volume evolution with the Pu/(U+Pu) ratio. The data of Pillon [1] for Na4UO5 and Na4MO5 and Bykov et al. for Na4PuO4.5 have also been added. Symbols are
half filled when several phases were observed. The dashed line represents the linear increase observed for the volume of Na4MO5 synthesised with sodium excess ... 108
4.24. U M4-edge and Pu M5-edge HR-XANES spectra of Na4MO5-6% sample and UO2 or
PuO2 reference ... 109
4.25. Comparison between the observed (Yobs, in red) and calculated (Ycalc, in black) X-ray
diffraction patterns of the Na4UVI0.94PuIV0.06O4.94 compound with ~1 wt% of unreacted
MOX. Yobs-Ycalc, in blue, is the difference between the experimental and calculated
intensities. The Bragg reflections’ angular positions are marked in blue for
Na4UVI0.94PuIV0.06O4.94 and in green for MO2. Upper: Na4UVI0.94PuIV0.06O4.94, Lower: MO2.
Measurement at λ=Cu-Kα1... 110 4.26. 23Na central transition MAS-NMR spectra of Na
4MO5-12% and end members recorded
using a) a single π/12 impulsion and b) an MQ-MAS experiment of Na4MO5-12%. In red
rectangles, we identify two different sodium sites ... 111 4.27. Pu M5-edge HR-XANES (a) and post-edge (b) spectra of Na2PuO3, Na4PuO5, Na4MO5
-12% samples and PuO2 reference. (Spectra have been shifted on the y axis to better
4.28. Lattice volume evolution of the Na4MO5 compositions with the starting Pu/(U+Pu) ratio
of the MOX. The data of Pillon for Na4UO5 and Na4MO5 and Bykov et al. for Na4PuO4.5
have also been added ... 113 4.29. Lattice volume evolution of the Na2MO3 compositions with the starting plutonium
content in the MOX. Symbols are half filled when several phases were observed ... 116 4.30. Pu M5-edge HR-XANES (a) and post-edge (b) spectra of Na2MO3-46% and PuO2
reference. (Spectra have been shifted on the y axis to better distinguish the different measurements) ... 117 4.31. Comparison between the Na-M-O phase diagram at 1073 K with M=(U,Pu) reported by
Pillon and the one suggested from the results obtained in this work. In red, the stable phases reported by Pillon with the phase fields boundaries in red dashed lines. In blue the stable phases observed in this work with the phase fields boundaries in blue dashed lines and the composition domain of Na4+ξ1(M,Na)O5+ξ2 ... 119
4.32. Experimental phase diagram at 800°C of the Na2O-UO3-PuO2 section. In figure b) a
zoom on the Na2O-Na2UVIO4-Na2PuO3 section is shown ... 121
5.1. Sketch of the pseudo-ternary phase diagram BaO-MoO3-Na2O ... 130
5.2. Calculated BaO-MoO3 pseudo-binary phase diagram. Model developed by Smith within
the TAF-ID project with the data of Yanushkevich et al., Dash et al., Zhukovskii and Petrov, Zhukovskii et al., Cordfunke and Konings ... 131 5.3. Calculated Na2O-MoO3 pseudo-binary phase diagram using the thermodynamic
modelling assessment of Bordier, compared with the liquidus data of Groschuff, Hoermann, Caillet, Balashov and solidus data of Groschuff, Hoermann, Caillet, Mudher et al. and the allotropic transition data of Caillet ... 132 5.4. Phase diagram of the AB section with A (20% BaMoO4 + 80% Na2MoO4) and B (20%
BaMoO4 + 80% MoO3) reported by Garkushin et al. ... 133
5.5. Na2MoO4-BaMoO4-MoO3 section reported by Garkushin et al.. The AB section is
represented in red ... 134 5.6. Comparison between the calculated (Ycalc, in black) and observed (Yobs, in red) XRD
patterns of BaMoO4. Yobs-Ycalc in blue, is the difference between the experimental and
calculated intensites. The angular positions of Bragg reflections are shown in blue. The measurement has been performed at λ=Cu-Kα ... 136 5.7. Comparison between the calculated (Ycalc, in black) and observed (Yobs, in red) XRD
patterns of Ba2NaMoO5.5. Yobs-Ycalc in blue, is the difference between the experimental
and calculated intensities. The angular positions of Bragg reflections are shown in blue. The measurement has been performed at λ=Cu-Kα ... 137 5.8. Comparison between the calculated (Ycalc, in black) and observed (Yobs, in red) neutron
diffraction patterns of Ba2NaMoO5.5. Yobs-Ycalc in blue, is the difference between the
experimental and calculated intensities. The angular positions of Bragg reflections are shown in blue. The measurement has been performed at λ=1.667 Å... 138 5.9. Sketch of the structure of Ba2NaMoO5.5. The octahedra around the atoms of
molybdenum and sodium are represented in purple and yellow, respectively. Barium atoms are represented in green, and oxygen atoms in red ... 139
5.10. XANES spectra of the Ba2NaMoO5.5 compound obtained at the Mo K-edge and
comparison with spectra of Mo0, MoIVO
2 and MoVIO3 used as reference compounds .. 140
5.11. Normalised second derivative of the Mo K-edge absorption of Ba2NaMoO5.5 compound and comparison with the ones of Mo0, MoIVO 2 and MoVIO3 used as references. The horizontal dashed lines mark the zero value for each shifted spectra. The vertical one is the energy position of the inflexion point ... 141
5.12. Fitted (red) and experimental (black) k3χ(k) spectra (a) and Fourier transform (b) of Ba2NaMoO5.5 obtained at room temperature. (Fourier Transform boundaries 3.5-13.5 Å−1, dk = 1 Å−1) ... 143
5.13. Scheme of the multi-scattering “path*” ... 144
5.14. Raman spectrum of Ba2NaMoO5.5 at room temperature ... 145
5.15. Variation of the Raman spectrum of Ba2NaMoO5.5 versus temperature ... 145
5.16. Evolution of the Raman band’s position of Ba2NaMoO5.5 as a function of temperature ... 146
5.17. XRD patterns of the Ba2NaMoO5.5 compound measured from room temperature up to 1223K. Two sections were deleted, where no peaks were coming from the phase measured, but additional peaks were coming from the sample holder ... 147
5.18. Relative thermal expansion of Ba2NaMoO5.5, compared to BaMoO4 and BaMoO3 ... 148
5.19. Comparison between the calculated (Ycalc, in black) and observed (Yobs, in red) XRD patterns of Na2Mo2O7. Yobs-Ycalc in blue, is the difference between the experimental and calculated intensities. The angular positions of Bragg reflections are shown in blue. The measurement has been performed at λ=Cu-Kα ... 150
5.20. DSC curve of a sample of Na2Mo2O7 (80.7 mg) in an alumina liner heated from 300 K up to 953K at 5K/min ... 151
6.1. Sketch of the pseudo-ternary phase diagram Cs2O-MoO3-Na2O ... 160
6.2. Calculated Cs2MoO4-MoO3 pseudo-binary phase diagram using the TAF-ID database with the experimental phase diagram data of Hoekstra et al. ... 161
6.3. Na2MoO4-Cs2MoO4 phase diagram reported by Samuseva et al ... 162
6.4. Na2MoO4-Cs2MoO4 phase diagram reported by Zolotova et al. ... 163
6.5. Na2MoO4-Cs2MoO4 pseudo-binary phase diagram with the data of Samureva et al. and the one of Zolotova et al. ... 164
6.6. Projection of the crystallisation surface of the Na2MoO4-Cs2MoO4-MoO3 system reported by Zueva et al.. The temperature are in °C. The ternary compounds have been added in blue on the pseudo-binary systems ... 165
6.7. Heat flow curve versus temperature of two samples with compositions x(Cs2MoO4)=0.077 (msample=107 mg) and x(Cs2MoO4)=0.420 (msample=78 mg) ... 167
6.8. Na2MoO4-Cs2MoO4 pseudo-binary phase diagram with the experimental data measured by Samuseva et al. and Zolotova et al. and in this work... 170
6.9. Comparison between the calculated (Ycalc, in black) and observed (Yobs, in red) XRD patterns of CsNaMo3O10. Yobs-Ycalc in blue, is the difference between the experimental and calculated intensities. The angular positions of Bragg reflections are shown in blue. The measurement has been performed λ=Cu-Kα... 172
6.10. Representation of the structure of CsNaMo3O10. The octahedrons around the atoms of
molybdenum and sodium are represented in purple and yellow, respectively. The polyhedrons around the cesium atoms are represented in green, and oxygen atoms in red... 173 6.11. XANES spectra of the CsNaMo3O10 compound obtained at the Mo K-edge and
comparison with spectra of Mo0, MoIVO
2 and MoVIO3 used as reference ... 175
6.12. Normalised second derivative of the Mo K-edge absorption of CsNaMo3O10 compound
and comparison with the ones of Mo0, MoIVO
2 and MoVIO3 used as references. The
horizontal dashed lines mark the zero value for each shifted spectra. The vertical one is the energy position of the inflexion point ... 175 6.13. Comparison between the observed (Yobs, in red) and calculated (Ycalc, in black) X-ray
diffraction patterns of Cs3Na(MoO4)2. Yobs-Ycalc, in blue, is the difference between the
experimental and calculated intensities. The angular positions of Bragg reflections are shown in blue. The measurement has been performed λ=Cu-Kα ... 176 6.14. DSC measurement of Na2MoO4 with a lead sample used as reference. The first peak is
the melting of the lead sample in the reference crucible. The second event is the
allotropic transition of Na2MoO4 ... 178
6.15. DSC measurement of Cs3Na(MoO4)2 with a lead sample used as reference. The first peak
is the melting of the lead sample in the reference crucible. The second event is the peritectic decomposition of Cs3Na(MoO4)2 ... 180
6.16. DSC measurement of CsNaMo3O10 with an aluminium sample used as reference. The
first peak is the decomposition reaction of CsNaMo3O10. The second event is the
melting of the aluminium sample in the reference crucible... 181 7.1. Phase diagram data reported by Kanda et al. on the Ba-Na system ... 188 7.2. Phase diagram data reported by Addison et al. on the Ba-Na system. The dotted lines
correspond to the phase boundaries proposed by Kanda et al ... 189 7.3. Na-Ba phase diagram reported by Pelton ... 189 7.4. a) Calculated Ba-Na phase diagram at 1 bar and comparison with the experimental data reported by Kanda et al. and Addison et al.. In b) the calculated Na-NaBa section is represented ... 191 7.5. a) Calculated Mo-O phase diagram with the modified Mo-O database. In b) a focus on
the section 0.73<x(O)<0.76 and 800 < T< 1500K ... 193 7.6. a) Calculated Cs2O-MoO3 phase diagram with the Mo-O parameters reported by
Corcoran et al. where a miscibility gap is clearly identified in red by Liq1+Liq2. In b) the calculated Cs2O-MoO3 phase diagram with the Mo-O database modified in this work is
represented ... 194 7.7. Calculated Na2O-MoO3 phase diagram with the modified Mo-O database ... 195
List of Tables
1.1. SFR nuclear power plants in the world (2012) ...3
1.2. Elemental yields of fission products in a Phenix fuel pin at 10 at.% burnup. Fission products are listed in alphabetical order. ...6
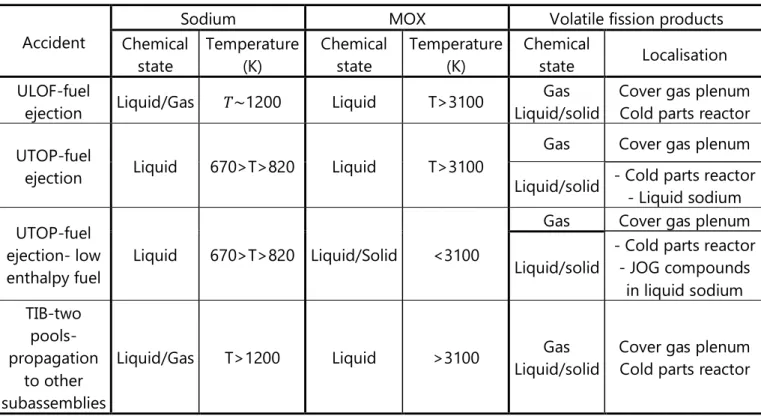
1.3. Summary of the interaction conditions between irradiated fuel and sodium ... 14
2.1. Structural parameters of the sodium uranate phases... 29
2.2. Structural parameters of the sodium plutonate phases ... 35
2.3. Structural data on the Na4UVIO5, Na4MO5 and Na4PuVIO5. ... 37
2.4. Structural data on the Na-M-O phases and endmembers reported by Pillon ... 41
2.5. Fraction of fission products released after a severe accident estimated by Balard and Carluec ... 45
2.6. Summary of the data on the interaction between the fission products and sodium. (with +++ high amount and + low amount). ... 50
2.7. Review of the binary sub-systems binaries of the Na-O-Pu-U system. With “Calphad”: Calphad model published in the literature. In green, the Calphad model is implemented in the TAF ID database. In orange, the system is not implemented in the TAF-ID database ... 51
2.8. Review of the ternary sub-systems of the Na-O-Pu-U system. With “Calphad”: Calphad model published in the literature. In green, the Calphad model is implemented in the TAF ID database. In orange, the system is not implemented in the TAF-ID ... 53
2.9. Review of the binary sub-systems of interest in this work. With “Calphad”: Calphad model published in the literature, “Diagram”: Phase diagram reported in the literature. In green, the Calphad model is implemented in the TAF ID. In orange, the system is not implemented in the TAF-ID database. ... 54
2.10. Review of the oxide ternary systems to describe the interaction between sodium and the fission products elements under study in this work. With “Calphad”: Calphad model reported in the literature. In green, the Calphad model is implemented in the TAF ID. In orange, the system is not implemented in the TAF-ID database. ... 57
4.1. Cell parameters a and crystallite diameter d obtained from the XRD and TEM results for the different compositions of mixed oxide fuel nanocrystals synthesised ... 73
4.2. Experimental conditions for the syntheses of Na4MO5 under argon at 800°C. ... 79
4.3. Experimental conditions for the Na3MO4 syntheses at 800°C. ... 81
4.4. Experimental conditions for the Na4MO5 syntheses at 1000°C. ... 82
4.5. Experimental conditions for the sodium mixed oxide syntheses at 800°C under air. ... 82
4.6. Na2PuO3 structure reported by Bykov et al ... 83
4.7. Na2PuO3 structure reported by Smith ... 84
4.8. Na2PuO3 cell parameters in C2/c space group ... 84
4.9. Refined atomic positions of Na2PuO3 in C2/c space group ... 85
4.11. Refined atomic positions of Na4PuO5 in I4/m space group ... 88
4.12. 23Na shift (δ), quadrupolar coupling constant (C Q), asymmetry parameter (ηQ). ... 89
4.13. Energies of the White Lines and post-edge features of the PuO2, Na2PuO3, Na4PuO5 and Na2MO4-6 samples at the Pu M5-edge. ... 90
4.14. Na2U1-xPuxO4 cell parameters evolution with the Pu/(U+Pu) ratio ... 93
4.15. Na2(U1-xPux)2O7 cell parameters evolution with the plutonium content ... 94
4.16. Energies of the White Lines and post-edge features of the PuO2, Na2PuO3, Na2M2O7-6, Na2M2O7-12 and Na2MO4-6 samples at the Pu M5-edge... 96
4.17. Energies of the White Lines and post-edge features of the PuO2, Na2PuO3, Na2M2O7-6, Na2M2O7-12 and Na2MO4-6 samples at the U M4-edge... 98
4.18. Refined atomic positions of Na2UVI0.94PuVI0.06O4 ... 98
4.19. Summary of the phase diagram data obtained on the samples heated under air ... 99
4.20. Cubic phases cell parameters in the NaOH-12h and Na2CO3-3h samples ... 100
4.21. Uranium and plutonium ionic radii for a six-fold coordination as a function of the actinide oxidation state ... 102
4.22. Lattice parameters of the Na4MO5 phase obtained by Le Bail refinement of the XRD patterns obtained for each sample with Pu/(U+Pu), the plutonium content. ... 103
4.23. 23Na shift (δ), quadrupolar coupling constant (C Q), asymmetry parameter (ηQ). ... 105
4.24. Energies of the White Lines and post-edge features of the PuO2, Na2PuO3, Na4PuO5, Na4MO5-6, and Na2MO4-6 samples at the Pu M5-edge. ... 106
4.25. Refined atomic positions, isotropic thermal displacement factor B0 and occupancy in the Na4U0.94Pu0.06O5 compound (noted Occ. in the table) derived from the XRD refinement. Background: Linear interpolation between operator-selected points in the pattern with refinable heights. Rwp=11 Rexp=4.52 χ2=5.92 ... 110
4.26. Energies of the White Lines and post-edge features of the PuO2, Na2PuO3 and Na4MO5 -12 samples at the Pu M5-edge ... 112
4.27. Summary of the phase diagram data obtained on Na4MO5 compositions after the structural analyses ... 114
4.28. Lattice parameters of the Na2MO3 phase obtained by Le Bail refinement of the XRD patterns obtained for each sample with Pu/(U+Pu) ratio ... 115
4.29. Energies of the White Lines and post-edge features of the PuO2 and Na2MO3-46 samples at the Pu M5-edge ... 117
4.30. Summary of the experimental phase diagram data obtained in the Na-O-Pu-U system ... 120
4.31. Structural data on the Na-M-O phases and endmembers ... 124
5.1. Profile parameters of Ba2NaMoO5.5 obtained with XRD and neutron diffraction methods ... 138
5.2. Refined atomic positions, isotropic thermal displacement factor B0 and occupancy factor in the Ba2NaMoO5.5 compound (noted Occ. in the table) derived from the neutron diffraction pattern refinement at λ=1.667 Å. Background obtained by linear interpolation between operator-selected points in the pattern with refinable heights ... 138
5.3. Energy positions of the inflexion points for the reference materials and Ba2NaMoO5.5
... 141
5.4. Bond lengths RE (Å) of Ba2NaMoO5.5 obtained from EXAFS and neutron diffraction data (RN). For the EXAFS fitting (ΔE0=3.1, goodness of fit = ∑ (𝒅𝒂𝒕𝒂𝒂𝒌−𝒇𝒊𝒕𝒌) 𝟐 𝒌 ∑ (𝒅𝒂𝒕𝒂𝒌 𝒌)𝟐 =0.017). Standard deviations are given in parenthesis. σ2 is the Debye-Waller factor, N is the number of atoms in each shell ... 144
5.5. Linear thermal expansion of the different band positions in the Ba2NaMoO5.5 compound ... 147
5.6. Evolution of the cell parameters and unit cell volume of Ba2NaMoO5.5 with temperature ... 148
5.7. Thermodynamic cycle used for the calorimetric measurement ... 151
5.8. Calorimetric results for the dissolution of Ba2NaMoO5.5 (M = 481.6 g.mol-1), BaO (M = 153.3 g.mol-1) and Na 2Mo2O7 (M = 349.9 g.mol-1) in 2a M HNO3 at 298.15 K. Solution calorimetry measurements were performed at a pressure p = (0.105 ± 0.005b) MPa, and in the temperature interval T = (298.15 ± 0.30b) K ... 152
5.9. Thermochemical cycle used for the determination of the enthalpy of formation of Ba2NaMoO5.5. Solution calorimetry measurements were performed at a pressure p = (0.105 ± 0.005) MPa, and in the temperature interval T = (298.15 ± 0.30a) K ... 153
6.1. Thermodynamic data on the Cs3Na(MoO4)2 reported by Smith et al. ... 165
6.2. Results of the DSC measurements on the pseudo-binary Na2MoO4-Cs2MoO4 section 169 6.3. Refined atomic positions, isotropic thermal displacement factor B0 the CsNaMo3O10 derived from the XRD refinement with χ2 = 3.15, R p= 15.5 Rwp= 15.6 ... 173
6.4. Selected bond lengths of the Cs, Mo or Na atoms of CsNaMo3O10 ... 174
6.5. Energy position of the inflection points for the reference materials and for CsNaMo3O10 ... 176
6.6. Raw data obtained after analysing DSC measurements of Na2MoO4 ... 178
6.7. Comparison between the enthalpy of the first allotropic transition of Na2MoO4 measured in this work and the one suggested in the work of Sugawara and Jin ... 179
6.8. Raw data obtained after analysing the DSC measurement of Cs3Na(MoO4)2 ... 179
6.9. Raw data obtained after analysing the DSC measurement of CsNaMo3O10 ... 181
7.1. Assessed parameters for the Ba-Na system ... 190
7.2. Modified parameters for the liquid phase of the Mo-O system ... 193
7.3. Assessed parameters for the Cs2MoO4-Na2MoO4 system ... 197
7.4. Calculated and experimental thermodynamic data on the Cs3NaMo2O8 compound .... 198
7.5. Comparison between the thermodynamic data of Cs3NaMo2O8 reported by Smith et al. and the calculated ones with the Calphad model ... 199
7.6. Comparison between the enthalpy of the peritectic decomposition of Cs3NaMo2O8 measured in Chapter 6 and the calculated with the Calphad model ... 199
1
Chapter 1:
Introduction and thesis
outline
2
The context of the thesis, related to the interaction between sodium and irradiated fuel under severe accident conditions in Sodium-cooled Fast Reactors is first introduced. Then, the evolution of the fuel chemistry under operating conditions is presented to understand the fuel chemical state before the accident. Finally, the phenomenology of the main severe accident cases is shortly described with the open questions remaining on the irradiated fuel behaviour and its interaction with sodium.
1.1. Context
One of the major challenges of the 21st century is the management of a rising world
population and energy needs, while reducing carbon dioxide emissions to mitigate the impact on climate change. In this context, nuclear energy can play a key role in the energy mix. Nowadays, in France, 77% of the produced energy comes from Nuclear Power Plants [1]. Nevertheless, the French nuclear fleet is getting old and will soon need to be renewed. One of the possibilities is to develop a Generation IV nuclear power plant design at industrial scale and adopting a closed fuel cycle. With this system some uranium resources would be saved and wastes reduced by burning plutonium and using 238U as fissile element. Finally, transmutation of minor actinides would also
be possible.
The Generation IV International forum (GIF) defined four main criteria for these systems, namely Sustainability, Economics, Safety and Reliability, and Proliferation Resistance and Physical Protection [2]. Six nuclear power plant designs satisfy these requirements: the Gas-cooled Fast Reactor, Lead-cooled Reactor, Molten Salt Reactor, Sodium-cooled Fast Reactor, Supercritical-Water-cooled Reactor, and Very-High-Temperature Reactor. Among these designs, the Sodium-cooled Fast Reactor (SFR) is one of the most advanced concept.
1.1.1 Sodium-cooled Fast Reactor (SFR)
Sodium cooled Fast Reactors that were operating or are under commissioning are reported in table 1.1. In France, R&D activities are still ongoing to develop a new SFR design using the feedback gained with Rapsodie, Phénix and Superphénix reactors.
3 Table 1.1: SFR nuclear power plants in the world (2012) [3]
Reactor (country) Thermal Power
(and electric) MW First start Final stop
Number of operating years EBR-I (USA)(NaK) 1,4 (0,2) 1951 1963 12 BR-5/BR-10 (Russia) 8 (0) 1958 2002 44 DFR (UK) (NaK) 60 (15) 1959 1977 18 EBR-II (USA) 62,5 (20) 1961 1991 30 EFFBR (USA) 200 (61) 1963 1972 9 RAPSODIE (France) 40 (0) 1967 1983 16 BOR-60 (Russia) 55 (12) 1968 44 SEFOR (USA) 20 (0) 1969 1972 3 BN-350 (Kazakhstan) 750 (130) 1972 1999 27 PHÉNIX (France) 563 (250) 1973 2009 36 PFR (UK) 650 (250) 1974 1994 20 JOYO (Japan) 50-75/100 (0) 1977 35 KNK-II (Germany) 58 (20) 1977 1991 14 FFTF (USA) 400 (0) 1980 1993 13 BN-600 (Russia) 1470 (600) 1980 32 SUPERPHÉNIX (France) 3000 (1240) 1985 1997 12 FBTR (India) 40 (13) 1985 27 MONJU (Japan) 714 (280) 1994 18 CEFR (China) 65 (25) 2010 2
PFBR (India) 1250 (500) commissioning Under BN-800 (Russia) 2100 (880) Under
commissioning
Total 418
In SFRs (figure 1.1), sodium is the coolant and the heat transfer medium allowing high power density with low coolant volume fraction. As sodium is activated by neutrons and emits β and γ radiations, (24Na has a half-life of nearly 15 hours), two circuits are
used. A primary “pool” exchanges the produced heat by the core with a second sodium loop, used to heat water/steam or supercritical carbon dioxide.
4 Figure 1.1: Sketch of the Sodium-cooled Fast Reactor design [2]
Among the different nuclear fuels considered for SFRs (oxides, carbides, nitrides and metals), U1-xPuxO2-y homogeneous mixed oxide fuel (MOX) is currently the reference,
with a plutonium content “x” higher than 0.2 and an oxygen stoichiometry “2-y” between 1.93 and 1.98.
The fuel pellets are introduced (figure 1.2a) in a stainless steel tube constituting the fuel pin. The core of the reactor, where the fission reactions take place, is made of numerous subassemblies, constituted of several fuel pins surrounded by Hexagonal Tube (HT), as presented in figure 1.2b.
Figure 1.2: a) MOX fuel pellets [3] ; b) scheme of a fuel subassembly [4]
Removable upper neutron shielding
Lifting head Hexagonal tube Spike
Sodium
plenum Fuel pins bundle
Pressure drop device
5
The use of sodium has several advantages: - Its production is cheap [3].
- It has very advantageous thermal properties for cooling down the reactor with its high heat capacity and thermal conductivity. Moreover, in case of loss-of-flow with scram, the decay heat can be safely removed through natural convection [5].
- It remains in liquid state under operating conditions (core outlet temperature at 1 bar: 550°C) and there is a large safety margin for sodium vaporisation (~900°C at 1 bar) [3]. Thanks to this high operating temperature, a high efficiency coefficient in the energy production is obtained.
- It has a low neutron absorption cross-section and does not slow down neutrons. However, some drawbacks exist with this technology mainly due to sodium chemical reactivity. Indeed, in case of contact between sodium and air or water, an energetic accident could occur causing a sodium fire and/or an explosive reaction forming NaOH and dihydrogen H2.
1.1.2. Fuel behaviour under operating conditions
During irradiation, a neutron hits a fissile atom, splitting it into two new atoms called fission products and some additional neutrons that will produce other fissions and maintain the chain reaction as described in figure 1.3.
Figure 1.3: Principle of the chain reaction [6] maintain the chain reaction as described in figure 1.3.
6
In table 1.2, typical fission product yields for an irradiated fuel in Phénix reactor (Pu/(U+Pu)~0.2) are reported for a 10 at. % burnup. The burnup measures the fuel utilisation and represents the fraction of atoms from the fuel that underwent fission (percentage of fissions per initial metal atom).
For the fission of one heavy atom, two oxygen atoms are released inducing an increase in the oxygen potential of the fuel. Then, the chemical state of the fission products depends on the oxygen potential, temperature and plutonium concentration of the fuel.
Table 1.2: Elemental yields of fission products in a Phenix fuel pin at 10 at.% burnup [7]. Fission products are listed in alphabetical order.
Fission Product products per fission) Yields (%fission Fission Product products per fission) Yields (%fission
Ag 1.3 Pd 13.8 Ba 6.8 Pm 1.2 Br 0.1 Pr 4.8 Cd 1 Rb 1.5 Ce 11.4 Rh 5.8 Cs 20.1 Ru 22.0 Eu 0.6 Sb 0.2 He 0.8 Sn 0.5 I 1.7 Sm 3.4 In 0.1 Sr 3.6 Kr 1.8 Tc 5.5 La 5.6 Te 3.5 Mo 21.3 Xe 23.6 Nb 0.2 Y 1.9 Nd 15.5 Zr 1.2
The numerous fission products found in the fuel have different physico-chemical properties. Kleykamp [8] proposed to gather the major ones in four classes:
o Fission gases and other volatile fission products: Kr, Xe, Br,I;
o Fission products forming metallic precipitates: Mo, Tc, Ru, Rh, Pd, Ag, Cd, In, Sn, Sb, Te;
o Fission products dissolved in the oxide fuel matrix: Ce, Nd, La, Gd, Y, Sr, Zr, Nb; o Fission products forming secondary oxide precipitates: Rb, Cs, Ba, Zr, Nb, Mo, Te. Therefore, fission products are found under gaseous form or/and in the fuel either dissolved in the fuel matrix or associated with other fission products in separate oxide or metallic secondary phases.
7
Under operating conditions, the fuel pellets are submitted to extreme thermal conditions. Indeed, as reported in figure 1.4, there is a very large temperature gradient (around 500 K/mm) between the pellet centre (~2000 K) and the pellet rim (~900 K). Due to this thermal gradient, mass transport of the fuel chemical elements occurs along the pellet radius. As shown in figure 1.4, one of the consequence is the hole formation in the pellet centre governed by a vaporisation/condensation phenomenon of uranium oxide gaseous species (mainly UO3), as described by Guerin in the chapter 2.21 of the
Comprehensive Nuclear Material [7]. This phenomenon leads to an increase of the plutonium content and a decrease of the oxygen stoichiometry in the centre of the pellet. On the contrary, the oxygen stoichiometry is higher in the pellet rim. Therefore, the plutonium, uranium and oxygen concentrations change along the pellet radius. The fission products react differently depending on the local oxygen potential and temperature in the fuel pellet. As reported by Samuelsson et al. [9],the main secondary phases observed in the irradiated MOX fuels are:
- The so-called “grey phase” precipitates with the formula (Ba,Sr)(Zr,Mo,U,Pu)O3 [8]
[10];
- The metallic precipitates (Ru, Mo, Pd, Rh, Tc ) also called Five Metals Precipitates; - The (Pd,Te) rich precipitates.
As first reported by Tourasse et al. [11], due to the large thermal gradient in the fuel pellet, from a burnup of 7 at. %, mass transport of the volatile fission products towards the pellet periphery happens. It leads to the formation of the so called” Joint Oxyde-Gaine” (JOG), which is a layer between the pellet and the cladding enriched in volatile fission products. The main constituting elements are cesium, tellurium and iodine. However, palladium and Cs2MoO4, which have a high vapour pressure, are also found
in this region, as reported by Guerin [7].
The JOG formation is a peculiarity of the MOX fuels irradiated in SFRs. However, the precise composition and structure of this JOG layer are still not well-known. Tourasse et al. [11] found using X-ray mapping that cesium and molybdenum are the main elements forming the JOG.
Later, thermodynamic calculations were performed by J-C Dumas [12] and Ball et al. [13]. The phases predicted to form in the JOG from these calculations were CsI in solid, liquid or gas state, Cs2I2(g), and Cs2Te in solid and liquid forms. However, post
irradiation experiments hardly showed the presence of these compounds in the JOG [7].
8 Figure 1.4: Micrograph of MOX fuel pellet irradiated at 13 at. % in the PHENIX reactor [14].
The X-ray mapping for the grey phase precipitates, metallic precipitates and (Pd,Te) precipitates are reported in Samuelsson et al [9]. BSE micrograph of the outer part of the
pellet with qualitative EDS maps from the red dashed box taken from Cappia et al. [15].
In post irradiation examinations of high burnup fuels, Ba-O phases by Kleykamp [8] and BaMoO4 compound by Castleman et al. [16] and Tête [17] were also found in the JOG.
Barium is not soluble in the fuel because of the large ionic radius of Ba2+ [18]. Therefore,
it can react with the free oxygen released by the fission of uranium leading to the formation of Ba-O phases. Due to the high vapour pressure of BaO, this phase can also precipitate in the cold regions of the pellet near the JOG or in the “grey phase “ [8]. Barrachin et al [19] reported that BaMoO4 is the most stable barium compound under
the normal temperature and oxygen potential conditions suggesting that the barium in the JOG should be under BaMoO4 form. The formation of BaMoO4 is also a result of
the β decay of cesium in Cs2MoO4 as described by Tête [17]. However very recently,
experiments on SIMFUELS (UO2 samples doped with fission products simulating the
irradiated fuel) performed by Geiger et al [20] have evidenced three different Mo/Ba ratios (1.2 ; 7 ; 8.4) in barium molybdates precipitates. Therefore, the interaction between barium, molybdenum and oxygen is much more complex than the thermodynamic estimations predicting the formation of BaMoO4 as reported in the
literature and described within the different analytical research programs PHEBUS FP, HI/VI, VEGA, VERCORS, etc [21].
“grey phase” precipitates
Metallic precipitates
(Pd,Te) rich precipitates
9
In studies on corrosion of the steel cladding [8,17], other compounds have been reported to exist such as Cs2TeO3, CrMoO4, NiTeO3, barium oxitellurides or
cesium-barium oxitelluride, forming in the gap between the blanket and the corroded steel cladding. Nevertheless, the mechanisms leading to their formation are not yet known. Recently, the JOG composition has been reinvestigated by Cappia et al. [15] using EDS measurements. Cesium, molybdenum, tellurium, iodine and barium were found as major elements in the JOG, which is consistent with the previous studies. The Cs2MoO4
structure was identified by XRD for the first time and was reported as the main phase forming the JOG layer.
Finally, Samuelsson et al. [22] calculated the evolution of the JOG composition and thickness in irradiated MOX fuels as a function of burnup by coupling thermodynamic calculations with the fuel performance code GERMINAL. Both the TAF-ID [23] and TBASE databases were used for the thermodynamic calculations. From the calculations using the TAF-ID database, as all solution phases are described, a complex mixture of many different solid, liquid and gas phases is predicted to form.
Thus, the JOG chemistry is very complex and depends on the oxygen potential, temperature and burn-up. Up to now, only a few experimental quantitative results on the JOG composition are available and fission product compounds are mainly predicted by thermodynamic calculations.
In figure 1.5, a non-exhaustive summary of the main phases found in the JOG is proposed.
10
1.1.3. Severe accident conditions
In this section, the phenomenology of severe accidents is introduced. From the different scenarii leading to a severe accident, the stages where a reaction between the irradiated fuel and sodium could occur are identified. Finally, the key chemical systems selected in this work to study the interaction between the irradiated fuel and sodium are listed.
1.1.3.1 Severe Accident scenarii
During a severe accident, the reactor fuel is damaged with a more or less extensive melting of the reactor core [24], which might lead to radioactive product release in the atmosphere. Even if this accident is highly unlikely happening, the impact on population and environment has to be assessed.
Two time scales can be defined in a severe accident [25]:
- The short term phase where the mechanical energy generation control is the key issue not to face a rupture of the confinement. The identification, control and understanding of the phenomena leading to mechanical energy release (void effect, recompaction, secondary phase recriticality) are the main issues under investigation.
- The long term phase where the relocation and cooling of the radioactive compounds formed after solidification are essential to lower the risks of recriticality and breach in the containment at the bottom part of the reactor.
Different initiating events might lead to a severe accident. The detailed scenarii together with every major event characteristic time in the three severe accident cases reported in the literature [25,26] are shown in figure 1.7 (end of section 1.1.3.1):
o UTOP: Unprotected Transient Over Power
The initiating event is the inadvertent control rod withdrawal without backup control rod drop. The withdrawal of the control rod inserts reactivity in the reactor core leading to a linear power increase and partial fuel melting inside the fuel pins in the subassemblies. A cavity filled with molten fuel and fission gases forms. In case of clad failure, molten fuel ejection might happen [26].
o TIB: Total Instantaneous Inlet Blockage
In case of ingress of external material into the fuel pin bundle, a local blockage can occur. A part (or a whole) assembly is not cooled down anymore. Due to the very fast boiling of sodium (some seconds), the accident cannot be immediately detected and therefore the reactor is not shutdown. This leads to pin failure and possibly melting and degradation of the subassembly and propagation to other subassemblies.
11
o ULOF: Unprotected Loss of Flow
In the ULOF scenario, the heat removal from the primary coolant system is not high enough leading to a decrease of the sodium flow in the primary coolant system and a rise in the temperature inside the fuel pins [27].
All these scenarii may happen in a very short time however, four different steps can always be distinguished [25]:
- The “Primary phase” where the materials move predominantly in the axial direction. It begins with the degradation of the fuel pins and ends at the first break of hexagonal tubes (HT)
- The “Transition phase” where the hexagonal tubes melt or lose their mechanical integrity. Because of this loss of integrity, a transition occurs between the axial relocation and the radial propagation of the damaged materials.
- The “Secondary phase” in which large pools of molten materials are formed where re-criticality events can occur.
- The “Post-Accidental cooling phase” during which a large part of the core material inventory cools down on the core catcher.
Severe accidents generally induce a sharp rise in the pressure and the temperature in the cover gas space above the sodium pool of the primary coolant system leading to possible leakage of the primary coolant system which:
- creates a risk of sodium fire
- a possible transfer of fuel fission products and aerosols to the containment or to the cover gas circuit as described in figure 1.6.
Indeed, when the cladding is not tight anymore (either because of a breach or melting event), fission gases are released from the fuel pin. They leave the local accidental area and are either trapped in the sodium pool or mixed with sodium gas. In case of mixing with sodium gas, the gaseous mixture will recondense on the cold parts of the reactor [36] leading to an interaction between fission gases and sodium.
The radiological consequences have to be precisely assessed by determining the possible fission products and/or actinides compounds that can be transferred from the core to the primary cooling system.
Therefore, the nature, amount and composition of the phases (in gas, liquid and solid states) have to be known at each stage of a severe accident but also after the Post-Accidental cooling stage.
12 Figure 1.6: Aerosol transport and evaporation of liquid after severe accident leading to a
leakage of the first barrier containment [28] Release from cover gas circuit Core Release to Containment Cover Gas Fuel ejection Bubble release pathway Liquid release pathway Liquid sodium
13 Figure 1.7: Description of the stages for the three types of severe accidents. The events
leading to sodium/irradiated fuel interaction are highlighted in red [26] [29] Propagation to the
neighbouring sub-assemblies Detection of delayed neutrons and shutdown
of the reactor
Fuel-coolant interaction
14 1.1.3.2 Fuel-sodium interaction in severe accidents
To model the evolution of the fuel pin under severe accidents, a mechanistic calculation code called SIMMER [30] and fast-running calculation tools [31–33] (compared with SIMMER) are developed. However, in this mechanistic approach, the chemistry of the fuel and the resulting interaction products with sodium, possibly formed, are not yet taken into account. To improve the models in these codes, a more accurate description of the phases forming at the different stages of the accident, is required.
In this section, the experimental campaigns CABRI and SCARABEE are shortly reviewed to identify the cases in which a reaction between the irradiated fuel and sodium could occur.
The conditions in which the fuel could interact with sodium are summarised in table
1.3 and are discussed in the following section.
Table 1.3: Summary of the interaction conditions between irradiated fuel and sodium
Accident
Sodium MOX Volatile fission products
Chemical state Temperature (K) Chemical state Temperature (K) Chemical state Localisation ULOF-fuel
ejection Liquid/Gas 𝑇~1200 Liquid T>3100
Gas Liquid/solid
Cover gas plenum Cold parts reactor UTOP-fuel
ejection Liquid 670>T>820 Liquid T>3100
Gas Cover gas plenum Liquid/solid - Cold parts reactor - Liquid sodium UTOP-fuel
ejection- low enthalpy fuel
Liquid 670>T>820 Liquid/Solid <3100
Gas Cover gas plenum Liquid/solid
- Cold parts reactor - JOG compounds in liquid sodium TIB-two pools-propagation to other subassemblies
Liquid/Gas T>1200 Liquid >3100 Gas Liquid/solid
Cover gas plenum Cold parts reactor
15 The CABRI experiments: ULOF and UTOP severe accident cases
To investigate experimentally the phenomenology of fuel materials degradation modes under severe accident conditions, extensive experimental campaigns were performed in the CABRI facility over the period 1973-2001. Many results were collected, especially during fuel transient and post-failure stages, as reported in the chapter 2.24 of the Comprehensive Nuclear Materials written by Papin in 2012 [26].
A short summary of the results on the interactions between sodium and irradiated fuel is presented hereafter to understand: (i) where the interaction takes place, (ii) which materials interact with sodium and (iii) the physico-chemical reaction conditions. ULOF and UTOP scenarii are considered at the same time, as the main cause of the interaction between the fuel and the sodium comes from the fuel ejection into the primary sodium coolant system. In case of UTOP, this fuel ejection is due to cavity formation whereas in the ULOF case, it is due to sodium vaporisation near the cladding leading to a loss of tightness. For the interaction with sodium, the main difference is the temperature and chemical state of sodium (biphasic liquid-gas for ULOF, liquid for UTOP).
In both cases, fuel ejection might happen as reported in figure 1.7. The ejected fuel mostly under droplet form, interacts with liquid or biphasic sodium. Therefore, the interaction between high-temperature fuel droplets ejected from the fuel pin at T>3100 K and liquid sodium at 670<T<820 K has to be investigated for UTOP [26]. In ULOF scenario, the difference comes from the biphasic state (liquid + gas) of the sodium.
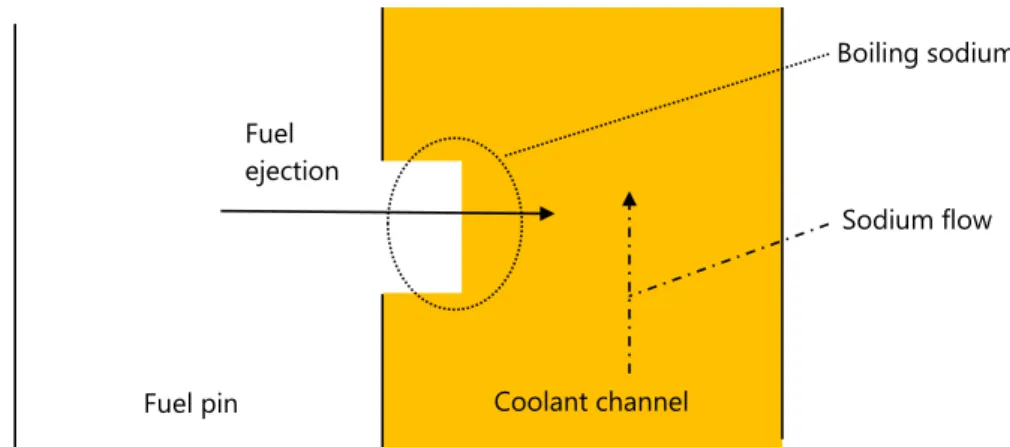
This interaction leads to high temperature exchange between sodium and liquid fuel with sodium vaporisation, pressure increase and mechanical energy release. However, data on the resulting composition and structure of the formed phases are not available. In severe accident studies, the thermodynamic quantity called “fuel enthalpy” corresponding to the pellet heat-up during an accident is often used. For low fuel enthalpy in case of UTOP scenario, the first part of the ejected fuel is the outer part of the pellet [26], enriched in fission products where the JOG layer is located. Therefore, the solid fuel is directly ejected in liquid sodium, as shown in figure 1.8. Therefore, the interaction between sodium, fission product compounds in the JOG layer and the solid fuel has to be investigated at temperatures under 1200 K where sodium is still liquid.
16 Figure 1.8: Schematic representation of fuel ejection from the fuel pin into the coolant channel.
SCARABEE program: TIB severe accident case
In the SCARABEE program (1983-1990) [34], experiments were performed to assess the phenomenology of a severe accident in case of a TIB scenario. When the cladding melts, the liquid steel drains downward the coolant channel, freezes and creates a steel blockage [35] (figure 1.9). On top of this resolidified material, a liquid steel cladding pool forms that does not mix with the fuel. As the temperature is still increasing, the fuel starts to melt. Metallic fission products such as ruthenium for example, that were located in metallic precipitates in the fuel, relocate in the liquid steel pool. Finally, two pools form: one containing the cladding materials and the metallic fission products, the other one, the liquid MOX fuel. This is called the “two pools” phenomenon.
The liquid fuel pool is called “boiling pool” (figure 1.9) as fertile uranium that vaporizes is mixed in this pool. Steel droplets can also vaporise due to the high temperature. In this case an upper steel blockage occurs due to the relocation of partly molten material. Finally, the boiling pool containing liquid fuel will extend radially after the hexagonal tube melting and will react with sodium and other subassemblies.
As the cladding materials and the metallic fission products are unlikely reacting with sodium in severe accident conditions [35], they are not considered in the present study.
Figure 1.9: Evolution of a subassembly under a TIB scenario as described by Kayser et al. [34].
Fuel pin Coolant channel
Fuel ejection
Boiling sodium
Sodium flow
Figure 1.9: Evolution of a subassembly under a TIB scenario as described by Kayser et al. [34].
Sodium Fuel Hexagonal Tube Liquid Steel Liquid Fuel Solid Fuel Upper steel Blockage Boiling Pool
Sodium Boiling Clad melting Fuel melting Steel boiling Liquid
Steel
Liquid Steel
17
1.1.4. Conclusion
The chemistry of the irradiated MOX fuel under operating conditions has been described. The main phases are:
- the fuel matrix (U,Pu,FPs)O2-x with FPs: Ce, Nd, Gd, La ….
- the secondary fission product phases,mainly (Ba,Sr)(Zr,Mo,U,Pu)O3,
- the Five Metals Particles (Mo, Ru, Pd, Rh, Tc) and (Pd,Te) rich precipitates;
- the JOG layer enriched in (Cs, I, Te, Mo, O) located in the pellet rim, mainly constituted of Cs2MoO4 but also of other phases still not yet well known.
The main scenarii of severe accidents have been shortly reviewed. The cases where the fuel would be in contact with the sodium are the following ones:
- Liquid oxide fuel at temperature>3100 K in contact with liquid and gas sodium at the vaporisation temperature of sodium or between 670 K and 820 K;
- Solid oxide fuel at T<3100 K in contact with liquid sodium between 670K and 820K At lower temperature, the solid phases forming during the cooling stage of these molten materials have to be predicted for the management of the radioactive materials after the accident.
Among the fission products, the volatile ones (I, Cs, Te) are released in the cover gas or condensed on the cold parts of the vessel. Fission products forming secondary oxide phases (Ba, Sr, Mo) will generally stay in the fuel and possibly react with sodium. Metallic fission products and cladding will not be considered for this study as there is no interaction with sodium.
To conclude, the temperature and chemical composition of the systems that have to be studied to cover the different possible reactions in severe accident conditions are wide. Moreover, there is a need to predict the composition of the phases in both gas and liquid states at very high temperature and in solid state for the compounds forming at low temperature. Thus, the thermodynamic modelling of this system is required to describe such a large chemical system within a large composition and temperature range.
This computational tool shall bring more accurate physico-chemical input data on the materials involved in severe accident conditions. Moreover, this description could be further integrated in the SIMMER code to improve the modelling and prediction of the fuel pin degradation phenomena.
The TAF-ID (Thermodynamic Advanced Fuels – International Database) [23] developed in the frame of the TAF-ID joint project coordinated by the OECD/NEA allows the accurate description of the irradiated MOX fuel chemistry [9,22,23]. However, sodium is not yet implemented in the database. Thus, there is a need to extend the database with fuel-sodium systems.
![Figure 2.3: Na-O-U phase diagram section between the theoretical composition “Na 2 UO 3 ” and Na 4 U VI O 5 along the O/(U+Na)=1 composition line [2]](https://thumb-eu.123doks.com/thumbv2/123doknet/14553413.725868/47.892.259.595.174.528/figure-phase-diagram-section-theoretical-composition-composition-line.webp)
![Figure 2.4: Calculated Na-O-U phase diagram at 900 K and 1 bar by Smith et al [6] (red line), and comparison with the phase equilibria suggested by Blackburn [1] (black dotted line)](https://thumb-eu.123doks.com/thumbv2/123doknet/14553413.725868/48.892.152.754.609.1030/figure-calculated-diagram-smith-comparison-equilibria-suggested-blackburn.webp)
![Figure 2.7: Ternary Na-O-Pu phase diagram at 1073 K obtained by Pillon in black line [2]](https://thumb-eu.123doks.com/thumbv2/123doknet/14553413.725868/52.892.225.624.97.460/figure-ternary-phase-diagram-obtained-pillon-black-line.webp)
![Figure 2.8: Ternary Na-O-Pu phase diagram at 800°C obtained by Pillon in black lines [2] and by Smith in red dotted lines [3] .](https://thumb-eu.123doks.com/thumbv2/123doknet/14553413.725868/54.892.109.798.558.1012/figure-ternary-phase-diagram-obtained-pillon-smith-dotted.webp)
![Figure 2.11: Pseudo-binary diagram between Na 2 MO 3 and Na 4 MO 5 reported by Pillon [2]](https://thumb-eu.123doks.com/thumbv2/123doknet/14553413.725868/60.892.241.603.371.731/figure-pseudo-binary-diagram-na-mo-reported-pillon.webp)