RESEARCH OUTPUTS / RÉSULTATS DE RECHERCHE
Author(s) - Auteur(s) :
Publication date - Date de publication :
Permanent link - Permalien :
Rights / License - Licence de droit d’auteur :
Institutional Repository - Research Portal
Dépôt Institutionnel - Portail de la Recherche
researchportal.unamur.be
University of Namur
Effects of stocking density on growth, yield and profitability of farming Nile tilapia,
Oreochromis niloticus L., fed Azolla diet, in earthen ponds
Abou, Youssouf; Fiogbé, Emile D.; Micha, Jean Claude
Published in:
Aquaculture Research
DOI:
10.1111/j.1365-2109.2007.01700.x
Publication date:
2007
Document Version
Publisher's PDF, also known as Version of record
Link to publication
Citation for pulished version (HARVARD):
Abou, Y, Fiogbé, ED & Micha, JC 2007, 'Effects of stocking density on growth, yield and profitability of farming
Nile tilapia, Oreochromis niloticus L., fed Azolla diet, in earthen ponds', Aquaculture Research, vol. 38, no. 6, pp.
595-604. https://doi.org/10.1111/j.1365-2109.2007.01700.x
General rights
Copyright and moral rights for the publications made accessible in the public portal are retained by the authors and/or other copyright owners and it is a condition of accessing publications that users recognise and abide by the legal requirements associated with these rights. • Users may download and print one copy of any publication from the public portal for the purpose of private study or research. • You may not further distribute the material or use it for any profit-making activity or commercial gain
• You may freely distribute the URL identifying the publication in the public portal ?
Take down policy
If you believe that this document breaches copyright please contact us providing details, and we will remove access to the work immediately and investigate your claim.
Effects of stocking density on growth, yield and
profitability of farming Nile tilapia,
Oreochromis
niloticus
L., fed
Azolla
diet, in earthen ponds
Youssouf Abou1,2, Emile D Fiogbe¤1& Jean-Claude Micha2
1Unite¤ de Recherche sur les Zones Humides, De¤partement de Zoologie et Ge¤ne¤tique, Faculte¤ des Sciences et Techniques, Universite¤ d’Abomey-Calavi Cotonou, Be¤nin,West Africa
2Research Unit in Organismic Biology, URBO/FUNDP, University of Namur,61, rue de Bruxelles, Namur, Belgium
Correspondence: Y Abou, Research Unit in Organismic Biology, URBO/FUNDP, University of Namur, 61, rue de Bruxelles, 5000 Namur, Belgium. E-mail: [email protected]
Abstract
Two consecutive experiments were conducted to study the e¡ects of stocking density on growth, food utilization, production and farming pro¢tability of Nile tilapia (Oreochromis niloticus) ¢ngerlings (initial mean weight:16.2 ! 0.2 g) fed Azolla, as a main com-ponent in diet. In experiment 1, ¢sh were hand-fed twice daily with three isonitrogenous (28.5% crude protein) and isocaloric (14.5 kJ g"1) diets A30, A35
and A40 containing 30%, 35% and 40% Azolla, re-spectively, for 90 days. Diets were formulated by mix-ing Azolla with locally available by-products. No signi¢cant di¡erences were found in growth para-meters and production (P40.05). Total investment cost was signi¢cantly higher with A30 (Po0.05), but same pro¢tability values were obtained with all diets (P40.05). In experiment 2, three stocking den-sities, 1, 3 and 5 m" 2, were assigned to three
treat-ments T1, T2and T3respectively. Fish were hand-fed
twice daily with diet A40. The ¢nal mean weight (89.53^115.12 g), the mean weight gain (0.81^ 1.10 g day"1), the speci¢c growth rate (1.90^2.20%
day"1) and the apparent food conversion ratio
(1.29^1.58) were a¡ected by stocking density, with signi¢cant di¡erence (Po0.05) at 5 m" 2, compared
with the other densities. Stocking density did not af-fect survival rate (P40.05).Yield and annual produc-tion increased with increasing stocking density, ranging from 7.10 ! 0.90 to 25.01 ! 1.84 kg are"1
and 28.79 ! 3.66 to 101.42 ! 7.48 kg are"1year"1,
respectively, with signi¢cant di¡erences between all densities (Po0.05). Higher stocking density resulted
in higher gross return and lower cost of ¢sh produc-tion, with signi¢cant variations (Po0.05).The net re-turn increased with increasing stocking density (Po0.05). However, both densities of 3 and 5 m" 2
produced the same pro¢tability values. On the basis of growth values and economic return, it was con-cluded that Nile tilapia could be raised at a density of 3 ¢sh m" 2 with A40 to improve production and
generate pro¢t for nutritional security and poverty alleviation in rural areas.
Keywords: stocking density, growth, production, food utilization, pro¢tability, Azolla, Oreochromis niloticus, earthen pond
Introduction
Fish is a main source of animal protein in Southern Be¤nin. In recent years, natural stocks have declined due to environmental perturbations and man-made changes through‘acadjas systems’, dumping of agro-chemical and industrial pollutants, and indiscrimi-nate and destructive ¢shing practises in lakes and la-goons. These not only reduces abundance and ¢sh size but also results in an increased price on the market. As expected, ¢sh consumption per capita has dropped, to about 9.4 kg year"1nowadays (FAO
2006). Therefore, further growth in aquaculture pro-duction is needed to maintain the present per capita supply of aquatic products in the future, given that the supply through traditional ¢sheries cannot grow
Aquaculture Research, 2007, 38, 595^604 doi:10.1111/j.1365-2109.2007.01700.x
r 2007 The Authors
any further (FAO 2000). Southern Be¤nin has a large area of wetlands of about 2000 km2, which are
con-sidered to be suitable for ¢sh farming and where, un-fortunately, these activities practiced in rural areas have failed due to high-feed cost. Indeed, ¢sh were fed with diets containing high-cost ¢sh meal with £uctuating quality (Olvera-Novoa, Capos, Sabido & Martinez Palacios 1990). According to FAO (2002), the long-term sustainability of aquaculture may be threatened by its present over-dependance on ¢sh meal and ¢sh oil. Thereby, development of viable and low-cost technologies could help to promote aquacul-ture in the area, as well as increase yields and pro¢t-ability. In that way, many e¡orts have concentrated on replacing animal protein sources such as ¢sh meal with cheaper plant protein in ¢sh diets (Ng & Wee 1989; Pouomogne, Takam & Pouemegne 1997; Fasakin, Balogun & Fasuru 1999; Fasakin, Balogun & Fagbenro 2001; Adebayo, Fagbenro & Jegede 2004). Recently, the successful use of the aquatic fern Azolla as a component of ¢sh diets has been widely demonstrated in both aquaria and tanks (El-Sayed 1992, 1999; Leonard, Breyne & Michaj 1998; Fiogbe¤, Micha & Van Hove 2004). However, data on its use in semi-intensive systems are very scarce. Our previous results showed that Azolla could be incorporated in more than 20% in diet for Nile tilapia Oreochromis ni-loticus (Abou, Fiogbe¤ & Micha, in press). Therefore, to minimize diet costs and enhance pro¢t, high propor-tions of this fern could be used to formulate low-cost practical diets for O. niloticus. Nevertheless, Micha and Leonard (2001^2002) suggested a level of 50% in diet as an upper limit for maintaining growth of Nile tilapia.
In Be¤nin rural areas, as in most developing coun-tries, human population growth is outpacing animal production. To meet current needs for ¢sh products, farmers resort to increase ¢sh stocking density. There is no research literature on tilapia stocking density in Be¤nin wetlands. However, it is well estab-lished that overstocking can cause stress, which leads to enhanced energy requirements and causes reduced growth (Siddiqui, Howlader & Adam 1989) and food utilization (Leatherland & Cho 1985), but understocking will result in failure to maximize production.
Hence, the aims of this study are to determine the e¡ects of stocking density on growth, production and farming pro¢tability of Nile tilapia fed low-cost Azol-la-diet. It is expected that both ¢sh management practices sustain production and improve revenue for nutritional security and poverty alleviation.
Materials and methods
Study site and experimental design
The two experiments were carried out at the rural demonstration site (6129015.1200N 213706.4200E) of the
Research Unit onWetlands of Abomey-Calavi Univer-sity, in Porto-Novo suburb, Be¤nin, West Africa. They were conducted in succession in the same set of nine stagnant earthen ponds with an average surface area of 100 m2and a depth of 1m. Ponds were ¢lled
con-tinuously from the water table. They were randomly assigned to three treatments. In experiment 1, ¢sh were stocked at 1m" 2and each treatment receives
one of the three diets A30, A35 and A40. The daily ration was calculated according to Me¤lard (1986) and adjusted fortnightly on the basis of ¢sh biomass. Daily rations were divided into two parts, each was hand-distributed at 08:00 and 16:00 hours, respec-tively, for 90 days. In experiment 2, three stocking densities, 1, 3 and 5 m" 2, were assigned to three
treatments T1, T2and T3respectively. Fish were fed
with diet A40, as used in experiment 1. Daily rations were divided into two parts, each hand distributed at 08:00 and16:00 hours, respectively, for 90 days. Daily rations were calculated according to Me¤lard (1986) and adjusted fortnightly.
Diet formulation and methods for biochemical analysis
Three isonitrogenous (28.5% CP) and isocaloric (14.5 kJ kg"1) diets were formulated containing 30%
(A30),35% (A35) and 40% (A40) Azolla, using locally available ¢sh meal, maize bran, palmseed cake, cot-tonseed cake, brewery dra¡ and the aquatic fern Azol-la. The Azolla strain used is Azolla ¢liculoides Lam., which is the most suitable strain for ¢sh and the more productive and easiest to grow under local condi-tions.
Proximate composition of ingredients, formulation and proximate composition of experimental diets are shown in Tables1and 2. One-half litre of warm water in which the binder was dissolved was added to1kg of each diet thus formulated and mixed. The dough ob-tained after 2 min of mixing was cut in paste and sun-dried at a temperature of 30^35 1C for about 2 days. After drying, the paste is manually broken into smaller particles of about 5 mm (passage through a 5 mm sieve). These were preserved in the refrigerator ( "1 1C) until used for feeding ¢sh.
Ingredients and experimental diets analysis were performed using the nitrogen content method (N # 6.25, Kjeldahl method) for crude protein, and the Soxhlet apparatus method according to Folch, Lees and Sloane-stanley (1957) for lipid content. Total ash content was determined by samples incineration
at 550 1C for 12 h. Moisture was measured by drying samples in an oven at 105 1C for 24 h (AOAC 1990). Gross energy was calculated using conversion fac-tors of 23.0, 38.1 and 17.2kJ g"1for protein, lipids and
carbohydrates (Tacon 1990).
Water quality
During both experiments, water-quality parameters were monitored fortnightly in the ponds.Water tem-perature, dissolved oxygen (DO) and pH were mea-sured at a depth of 10 cm at the following times: 08:00, 11:00, 14:00 and 17:00 hours, using an oxy-thermometer (WTW Oxi 197i, WTW, Weilheim, Ger-many, precision: ! 0.01 1C and ! 0.01mg L"1) and
a pH metre (WTW pH 330i, precision: ! 0.01) respec-tively. Values for water transparency were obtained using a Secchi disc. Nitrate, nitrite, ammonium and orthophosphates levels were measured using spec-trophotometric methods according to APHA (1992). Estimation of chlorophyll a concentration was car-ried out according to standard methods described in APHA (1992). To estimate zooplankton abundance in experimental ponds, 20 L of water were collected in three points of each pond and ¢ltered through a 55 mm plankton net to obtain a concentrated sample. The samples were preserved immediately with 5% formalin. The absolute abundance of zooplankton was estimated by counting samples in a Dolfus cell under a binocular magnifying glass ( # 40).
Estimation of growth, survival, production and feed utilization
For each experiment, about 40% of ¢sh in ponds were sampled fortnightly and weighed to calculate the
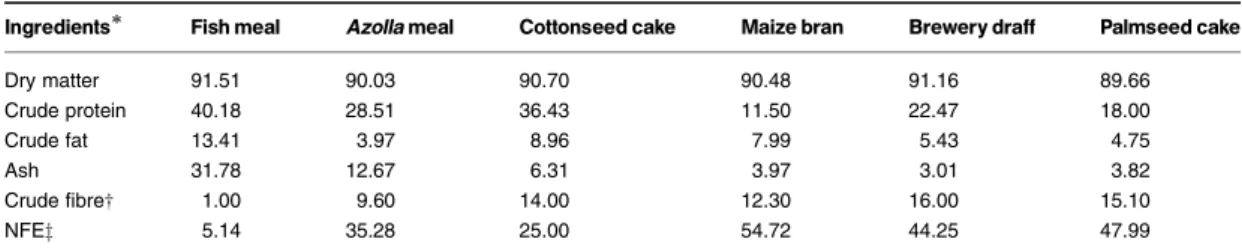
Table 1 Proximate composition of ingredients (% dry matter basis) used in preparation of the diets for feeding Oreochromis niloticus in stagnant earthen ponds
Ingredients! Fish meal Azolla meal Cottonseed cake Maize bran Brewery draff Palmseed cake
Dry matter 91.51 90.03 90.70 90.48 91.16 89.66 Crude protein 40.18 28.51 36.43 11.50 22.47 18.00 Crude fat 13.41 3.97 8.96 7.99 5.43 4.75 Ash 31.78 12.67 6.31 3.97 3.01 3.82 Crude fibrew 1.00 9.60 14.00 12.30 16.00 15.10 NFEz 5.14 35.28 25.00 54.72 44.25 47.99 !Available locally, supplied by Ovograin Feeds Depot (Abomey-Calavi, Be¤nin,West Africa).
wAccording to Ovograin Feeds Depot (Abomey-Calavi, Be¤nin, West Africa) and Leonard (1997) for ingredients and Azolla ¢liculoides respectively.
zNitrogen-Free Extract (NFE) calculated as: 100 " (%moisture1%protein1%lipid1%ash1%crude ¢bre).
Table 2 Formulation (%) and proximate composition (% dry matter) of experimental diets used for feeding Oreochromis niloticus in stagnant earthen ponds
Experimental diets
A30 A35 A40
Ingredients Fish meal 15 10 10 Azolla 30 35 40 Maize bran 8 6 6 Cottonseed cake 22 30 27 Palmseed cake 8 8 4 Brewery draff 15 09 11 Binder! 1 1 1 Salt (NaCl) 1 1 1 Proximate composition Dry matter 90.36 90.07 90.20 Crud protein 28.62 28.46 28.50 Lipid 7.08 6.55 6.40 Ash 11.18 10.65 11.22 Crude fibrew 10.70 11.05 10.82 NFEz 32.78 33.36 33.26 Gross energy‰ (kJ g" 1) 14.91 14.78 14.71
Cost of feedz (US$ kg" 1) 0.39 0.34 0.33
!Cassava starch was used as binder.
wCalculated according to Ovograin Feeds Depot (Abomey-Calavi, Be¤nin, West Africa) and Leonard (1997) for ingredients and Azol-la ¢liculoides respectively.
zNitrogen-Free Extract (NFE) calculated as: 100 " (%moistur-e1%protein1%lipid1%ash1%crude ¢bre).
‰According to Tacon (1990).
zIncluding handling and process (for comparison, US$ 1 5CFA 494.82, December 2006).
Aquaculture Research, 2007, 38, 595^604 Stocking density improve yield and pro¢tability of Nile tilapia YAbou et al.
r 2007 The Authors
individual mean weight and to adjust the daily ration for the following 2 weeks. At the end of the trials, the ¢sh were harvested using repeated netting, and counted. Growth in terms of ¢nal mean weight (FMW), daily weight gain (DWG), speci¢c growth rate (SGR) and apparent food conversion ratio (AFCR) were estimated. Daily weight gain was calculated as total weight gain/experiment duration. Speci¢c growth rate and AFCRwere calculated as follows, ac-cording to Brown (1957) and Castell and Tiews (1980) respectively:
SGR ð% day"1Þ ¼ ðln W
2" ln W1Þ # 100=ðT2"T1Þ
whereW1is the initial live body weight (g) at time T1
(day) andW2is the ¢nal live body weight (g) at timeT2
(day):
AFCR ¼ Feed fed ðdry weightÞ=Live weight gain Survival rate, net yield and annual production were evaluated as described below
Survival rate ð%Þ ¼ Number of fish harvested # 100=Number of fish stocked Net yield ðkg are"1Þ ¼ Biomass gain ðkgÞ=
surface area ðareÞ Production ðkg are"1year"1Þ
¼ ½Biomass gain ðkgÞ # 365(=½surface area ðareÞ # time ðdaysÞ(
Economical evaluation
For economical analyses of each treatment, the re-sults of the experiments were extrapolated to 1 year, assuming that 1 man-day (8 h) of labour is US$ 4.04 (for comparison, US$ 1 5CFA 494.82, at December
2006). The cost of feed ingredients and the cost of ¢n-gerlings were based on the wholesale market price during the experimental periods. Values of total in-vestment cost (TC) consisted of variable costs (VC) and ¢xed costs (FC). The gross return (GR) (value of total output) was based on the price of US$ 2.43 kg"1of unprocessed fresh ¢sh, as
marketable-size tilapia sold on the national market. Then the following pro¢tability indicators were calculated:
Return above variable costs ðRAVCÞ ¼ GR " VC Net return ðNRÞ ¼ GR " TC
Profitability ¼ NR=TC Statistical analysis
The mean values for growth parameters, survival, yield, production, water quality, chlorophyll a and zooplankton abundance for each treatment in each experiment were tested using one-way analysis of variance (ANOVA1) after verifying the homogeneity of
variance using ‘Hartley’s test’ (Hartley 1959). Before analysing survival rate, percentage data were arcsin transformed. Signi¢cant results from ANOVA1 test
were further analysed using Duncan’s New Multiple Range Test (Duncan 1955) to detail any di¡erence among treatments. All statistical analyses were performed withSPSS(SPSS, Chicago, Illinois, USA).
Results Experiment 1
There were no signi¢cant di¡erences in water quality among treatments (Table 3). Also, growth
para-Table 3 Mean values ( ! SD) of water-quality parameters in the ponds during both experiments
Parameters
Experiment 1 (Azolla level) Experiment 2 (fish m" 2)
A30 A35 A40 1 3 5
Secchi disc (cm) 42.2 ! 8.8a 40.4 ! 7.2a 45.1 ! 2.1a 35.0 ! 1.4a 42.4 ! 5.6b 51.3 ! 1.1c Temperature (1C) 28.8 ! 0.2a 28.9 ! 0.1a 29.0 ! 0.1a 28.9 ! 1.7a 28.7 ! 1.8a 28.8 ! 1.7a pH 6.61 ! 0.11a 6.40 ! 0.29a 6.46 ! 0.20a 6.56 ! 0.11a 6.45 ! 0.29a 6.42 ! 0.20a Dissolved oxygen (mg L" 1) 4.48 ! 0.24a 4.66 ! 0.26a 4.44 ! 0.10a 5.15 ! 0.87a 4.02 ! 0.63b 3.20 ! 0.71c Nitrates (mg L" 1) 0.12 ! 0.01a 0.10 ! 0.02a 0.11 ! 0.02a 0.24 ! 0.05a 0.29 ! 0.01a 0.30 ! 0.06a Nitrites (mg L" 1) 0.01 ! 0.00a 0.01 ! 0.00a 0.01 ! 0.00a 0.01 ! 0.00a 0.01 ! 0.00a 0.02 ! 0.00a Ammonium (mg L" 1) 0.46 ! 0.07a 0.42 ! 0.01a 0.48 ! 0.07a 0.49 ! 0.03a 0.74 ! 0.16b 1.10 ! 0.07c Orthophosphates (mg L" 1) 2.22 ! 0.15a 2.53 ! 0.41a 2.32 ! 0.23a 2.48 ! 0.69a 2.80 ! 0.40a 2.79 ! 0.78a Chlorophyll a (mg L" 1) 14.9 ! 2.4a 14.5 ! 1.6a 13.5 ! 1.9a 17.38 ! 2.15a 15.26 ! 1.40b 11.55 ! 1.89c Zooplankton (number L" 1) 933 ! 102a 848 ! 105a 894 ! 174a 906 ! 80a 708 ! 71b 561 ! 48c
meters, yield and production were not signi¢cantly di¡erent (Table 4, Fig.1, P40.05).The investment cost decreased with increasing ¢sh density. This cost is signi¢cantly higher with diet A30 (Po0.05), com-pared with those for A35 and A40 who did not di¡er (P40.05). However, the pro¢tability index showed the same values (Table 5, P40.05).
Experiment 2
Water quality and plankton assessment
Water quality parameters in experiment 2 are given in Table 3. Dissolved oxygen and zooplankton abun-dance were signi¢cantly di¡erent among the treat-ments (Po0.05). Decreasing values with increasing ¢sh density were observed. Secchi disc transparency and ammonium concentrations increased with
in-creasing stocking density (Po0.05). Temperature, pH, nitrates, nitrites and orthophosphates did not dif-fer signi¢cantly among treatments (P40.05). Similar chlorophyll a concentrations were obtained at 1 and 3 ¢sh m" 2, and were signi¢cantly higher than that
obtained at 5 ¢sh m" 2(Po0.05).
Growth, production and feed utilization
As shown in Table 4 and Fig. 2, stocking density has signi¢cant e¡ects on growth rates. Final mean weight, DWG and SGR decreased with increasing density, with signi¢cant di¡erence between treat-ment notably among the highest density (5 ¢sh m" 2)
and both others (Po0.05) who did not di¡er signi¢-cantly (P40.05). Fish survival was acceptable at all stocking densities, and was not a¡ected by stocking density (P40.05). Net ¢sh yields and annual produc-tion showed a positive relaproduc-tionship with stocking density, and the di¡erences were signi¢cant (Po 0.05) between the three densities. The lowest yield (7.10 ! 0.90 kg are"1) and production (28.79 ! 3.66
kg are"1year"1) were recorded at the lowest
stock-ing density, and the highest yield (25.01 ! 1.84 kg are"1) and production (101.42 ! 7.48 kg are-1year "1) at the highest stocking density.
The same increasing trend e¡ects of stocking den-sity (Po0.05) were obtained with the feed utilization e⁄ciency, expressed as AFCR. Values ranged from 1.29 ! 0.08 at the lowest stocking density to 1.34 ! 0.07 and 1.58 ! 0.07 at the densities of 3 and 5 ¢sh m" 2respectively.
Economic analysis
Total investment cost, gross return and net return were directly related to stocking density. The highest
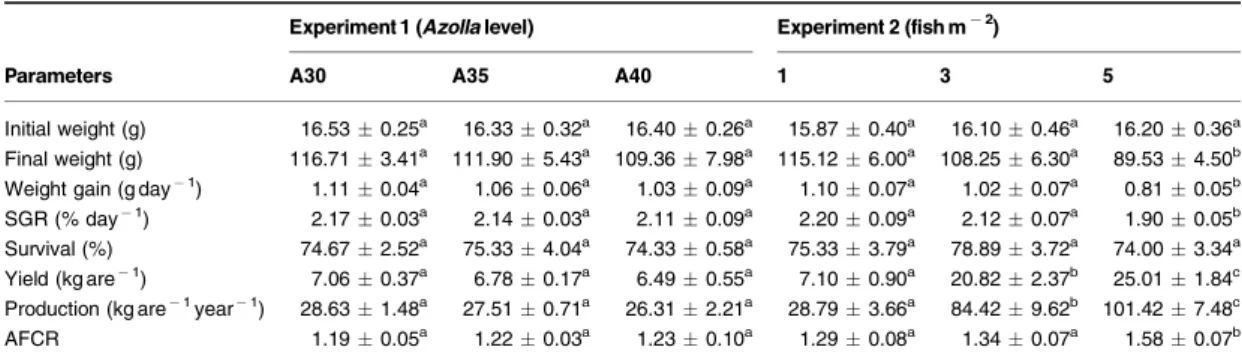
Table 4 Growth performance, survival, production and feed utilization of Nile tilapia (Oreochromis niloticus) fed Azolla diets (experiment 1) and reared at three stocking densities (experiment 2) for 90 days in stagnant earthen ponds
Parameters
Experiment 1 (Azolla level) Experiment 2 (fish m" 2)
A30 A35 A40 1 3 5
Initial weight (g) 16.53 ! 0.25a 16.33 ! 0.32a 16.40 ! 0.26a 15.87 ! 0.40a 16.10 ! 0.46a 16.20 ! 0.36a Final weight (g) 116.71 ! 3.41a 111.90 ! 5.43a 109.36 ! 7.98a 115.12 ! 6.00a 108.25 ! 6.30a 89.53 ! 4.50b
Weight gain (g day" 1) 1.11 ! 0.04a 1.06 ! 0.06a 1.03 ! 0.09a 1.10 ! 0.07a 1.02 ! 0.07a 0.81 ! 0.05b
SGR (% day" 1) 2.17 ! 0.03a 2.14 ! 0.03a 2.11 ! 0.09a 2.20 ! 0.09a 2.12 ! 0.07a 1.90 ! 0.05b Survival (%) 74.67 ! 2.52a 75.33 ! 4.04a 74.33 ! 0.58a 75.33 ! 3.79a 78.89 ! 3.72a 74.00 ! 3.34a Yield (kg are" 1) 7.06 ! 0.37a 6.78 ! 0.17a 6.49 ! 0.55a 7.10 ! 0.90a 20.82 ! 2.37b 25.01 ! 1.84c
Production (kg are" 1year" 1) 28.63 ! 1.48a
27.51 ! 0.71a 26.31 ! 2.21a 28.79 ! 3.66a 84.42 ! 9.62b 101.42 ! 7.48c AFCR 1.19 ! 0.05a 1.22 ! 0.03a 1.23 ! 0.10a 1.29 ! 0.08a 1.34 ! 0.07a 1.58 ! 0.07b
In each line for each experiment, means with the same letters as superscripts are not signi¢cantly di¡erent (P40.05). Data are means ( ! SD) of three replicates.
0 20 40 60 80 100 120 140 0 15 30 45 60 75 90 Days
30% Azolla 35% Azolla 40% Azolla
Weight (g)
Figure 1 Fortnightly mean individual weight of Nile tila-pia fed in earthen ponds for 90 days with diets containing three levels of Azolla ¢liculoides.
Aquaculture Research, 2007, 38, 595^604 Stocking density improve yield and pro¢tability of Nile tilapia YAbou et al.
r 2007 The Authors
density required the highest total investment cost and also provided the highest revenue (Table 5). Den-sities of 3 and 5 ¢sh m" 2provided the lowest cost of
¢sh production and the highest farming pro¢tability. Both these two densities showed the same cost of ¢sh production and farming pro¢tability.
Discussion
In experiment 1, water quality, growth parameters and production values were quite similar among ¢sh fed with the three diets. The SGRs obtained were very
similar to those reported by Fasakin et al. (1999) for Nile tilapia-fed diets (30% CP) containing 20% and 30% of duckweed Spirodella polyrrhiza L. Schleiden. The growth and production values obtained here were slightly lower than those reported previously when feeding Nile tilapia with diets containing 0%, 10% and 20% Azolla in the same ponds (Abou et al., in press). However, these values were acceptable for Nile tilapia fed in tropical wetland ponds, indicating that A30, A35 and A40 could be used for rearing this ¢sh in rural areas. Diet A30 showed signi¢cantly higher investment cost and the lowest cost is asso-ciated with A40. In rural areas of Be¤nin, poor people lack capital and Azolla will not be a limitant, as the fern spontaneously grow with high productivity in Be¤nin marshlands. As the goal of this experiment is to develop suitable approach for low-cost investment in practical ¢sh feed, diet A40 appears cost e¡ective to boost revenue.
In experiment 2, water transparency was consis-tently higher at high densities, possibly due to the re-duction in phytoplankton by ¢sh feeding pressure, as shown by the lower chlorophyll a concentration in these ponds. The reduction in zooplankton abun-dance at high densities could be also due to high predation by ¢sh. Dissolved oxygen signi¢cantly decreased with increasing stocking density. Similar results were observed byAhmed (1993) and Rahman and Rahman (2003) who also reported lower DO in fertilized ponds with supplementary feed for carp ¢n-gerling. The lower values for DO might be primarily attributed to lower photosynthetic activity and high
Table 5 Costs, returns and pro¢tability of feeding Nile tilapia with threeAzolla diets, and rearing at three stocking densities
Parameters
Experiment 1 (Azolla level) Experiment 2 (fish m" 2)
A30 A35 A40 1 3 5
Fixed costs (US$)
Feeding 10.2 10.2 10.2 10.2 10.2 10.2 Pond management 14.4 14.4 14.4 14.4 14.4 14.4 Harvest procedures 3.1 3.1 3.1 3.1 3.1 3.1 Variable costs (US$)
Feed cost 4.8 ! 0.3 4.0 ! 0.1 3.8 ! 0.0 4.3 ! 0. 1 12.4 ! 0.2 19.5 ! 0.6 Fingerlings cost 5.05 5.05 5.05 5.05 15.16 25.26 Investment cost (US$) 37.5 ! 0.3a
36.8 ! 0.1b
36.6 ! 0.0b
37.0 ! 0.1a
55.2 ! 0.2b
72.4 ! 0.6c
Fish production (US$ kg" 1) 1.1 ! 0.0a
1.1 ! 0.0a
1.1 ! 0.1a
1.1 ! 0.1a
0.5 ! 0.0b
0.5 ! 0.0b
Gross return (US$)) 85.7 ! 3.4a
82.8 ! 1.7a 79.9 ! 5.3a 85.4 ! 8.5a 252.2 ! 24.0b 325.6 ! 17.1c RAVC (US$)) 75.9 ! 3.6a 73.7 ! 1.7a 71.1 ! 5.3a 76.1 ! 8.5a 224.7 ! 23.8b 280.9 ! 16.5c
Net return (US$) 48.2 ! 3.6a 46.0 ! 1.7a 43.4 ! 5.3a 48.4 ! 8.5a 197.0 ! 23.8b 253.2 ! 16.5c
Profitability (%) 1.3 ! 0.1a 1.3 ! 0.1a 1.2 ! 0.1a 1.3 ! 0.2a 3.6 ! 0.4b 3.5 ! 0.2b
In each line for each experiment, means with the same letters as superscripts are not signi¢cantly di¡erent (Po0.05). Data are means ( ! SD) of three replicates.
RAVC, return above variable costs.
3 m 5 m 1 m 0 20 40 60 80 100 120 140 0 15 30 45 60 75 90 Days Weight (g)
Figure 2 Fortnightly mean individual weight of Nile ti-lapia reared in earthen ponds for 90 days at three stocking densities (1, 3 and 5 ¢sh m" 2) and fed with the same diet
oxygen consumption by ¢sh. This could explain the accumulation of ammonium at high densities. De-spite these variations in water quality, their values are within the tolerable range for survival and pro-duction of Tilapia in tropical waters (Beveridge 1996; Me¤lard1999).
Final mean weight, DWG and SGR were negatively correlated (Po0.05) with stocking density. However, no signi¢cant di¡erences in growth parameters (P40.05) were found between the densities of 1 and 3 m" 2. The explanations for the e¡ects of stocking
density on ¢sh growth are very complex, as many in-terdependent factors are concerned. Published re-search literature on the e¡ects of stocking density on growth in O. niloticus in stagnant earthen ponds in the tropics is particularly scarce. Stocking density is already cited as an inhibitory factor for ¢sh growth (Helser & Almeida 1997; Irwin, O’Halloran & FitzGer-ald 1999), due to competition for food (Helser & Almeida 1997; Irwin et al. 1999; Islam 2002), space limitation (Ewing, Sheahan, Lewis & Palmisano 1998) and low DO (Yi, Lin & Diana 1996). Huang and Chiu (1997) argued that tilapia is a territorial and ag-gressive ¢sh, so that the density e¡ects on growth might be explainable by their competition for terri-tories, as well as by the permanent stress caused by crowding. This last observation has been reported by Ruane, Carballo and Komen (2002) and Ruane and Komen (2003) in common carp Cyprinus carpio (L.). This chronic stress leads to impaired ¢sh growth, probably due to the mobilization of dietary energy by the physiological alterations elicited by stress responses (Kebus, Collins, Brown¢eld, Amundson, Kayes & Malison 1992). Increasing stocking density may also result in a deterioration of water quality (Pankhurst & Van der Kraak 1997). Hence, the lower growth performances obtained in our study at 3 and 5 ¢sh m" 2could be due to lower DO values observed
in these treatments.
In the present study, AFCR is density dependent; i.e. higher ¢sh density resulted in higher AFCR. Simi-lar observations have been made in caged farming by Cruz and Ridha (1989) and Watanabe, Clark, Dun-ham,Wicklund and Olla (1990) with O. niloticus and Florida Red tilapia, respectively, as well as with the cat¢sh Pangacius sutchi (AlmazaŁn-Rueda 2004). In the literature, inverse relationships between stocking density and feed e⁄ciency have been signalled by some authors as the result of decreasing e⁄ciency in search for food (Vijayan & Leatherland 1988) or water quality (Soderberg, Meade & Redell 1993). In this study, the amount of feed given in all ponds was
on the basis of the ¢sh stocked and the di¡erences be-tween the amounts of feed provided per capita was quite insigni¢cant. Hence, the lower growth at high density could be due to a reduced availability of nat-ural food in the ponds, as Rahman, Mazid, Rahman, Khan, Hossain and Hussain (2005) found. These statements, combined with the lower DO, could result in increasing AFCR. Diana, Lin and Schneeberger (1991) indicate that there is an adequate protein level from natural food that can sustain growth, until a critical biomass of ¢sh is reached. This may mean that ¢sh biomass at 5 m" 2is greater than the natural
food capacity of ponds.
On the other hand, growth of Nile tilapia is primar-ily dependant on the absolute protein intake (g protein kg"1day"1) (Tacon & Cowey 1985; Bowen
1987) rather than on the dietary protein level (Yaku-pitiyage 1989). Considering the fact that density-in-duced stressors reduce ¢sh appetite for feed, which could result in feed not being utilized (Alan"r" 1996; Alan"r" & Br"nn"s 1996), one could explain the in-crease in AFCR at the density of 5 m" 2by the loss of
an amount of feed that simply ends up in sediment. Despite the higher values observed with increasing stocking density, the lower AFCR values obtained in our study indicate a better food utilization e⁄ciency. Our values are close to those reported by Yi et al. (1996) in Nile tilapia cultured for 90 days in ponds stocked at 2 m" 3and containing a 4 m3cage stocked
at either 60 or 70 ¢sh m" 3.
Survival rates were not a¡ected by stocking den-sity, which is consistent with Daungsawasdi, Chom-chei,Yamorbsin and Kertkomut (1986) who reported that mortality in Nile tilapia raised in cages was not dependent on stocking density. Other reports on cat¢sh support these ¢ndings (Haylor 1992; Islam, Rahman & Tanaka 2006). However, care should be taken with that result, as the e¡ects of density on survival rate will be entirely dependent on the range of stock densities.
There was a strong trend for net yield and annual production to increase with increasing stocking den-sity. These ¢ndings are in agreement with those re-ported by Cruz and Ridha (1989) and Watanabe et al. (1990) for tilapias. Similar production scenarios were also obtained with many other species such as cat¢sh (Engle & Valderrama 2001; Islam et al. 2006) and sil-ver perch (Rowland, Allan, Hollis & Pontifex 2004). The positive relationship between stocking density and yield has been described in culture-based ¢sh-eries in reservoirs (Phan & De Silva 2000; Sugunan & Katiha 2004; Nguyen, Bui, Nguyen, Truong, Le,
Aquaculture Research, 2007, 38, 595^604 Stocking density improve yield and pro¢tability of Nile tilapia YAbou et al.
r 2007 The Authors
Abery & De Silva 2005). Culture of all these species in cages or in reservoirs showed that the highest stock-ing density led to the highest biomass.
Production estimation, which are based on bio-mass estimates adjusted for mortality and corrected for growth, is the basis for estimating the economic revenue from ¢sh culture operations. Obviously, feed and ¢ngerling costs increase with increasing stock-ing density, resultstock-ing in higher total investment costs at high densities. The increasing pattern of produc-tion with increasing stocking density resulted in a si-milarly increasing pattern of gross return. For that reason, the cost of ¢sh produced decreased at high densities, as the amount of feed given per ¢sh was closely the same in the study. Also, net return in-creased with increasing stocking density. As a result, the pro¢tability index was higher at the high densi-ties.
Fish growth is lower at 5 than at 3 ¢sh m" 2, but
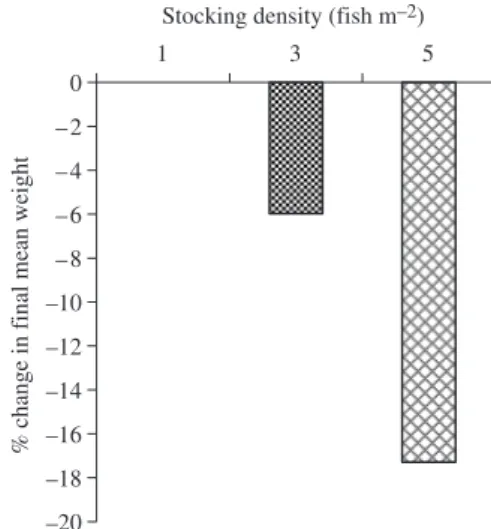
similar values for pro¢tability were obtained with both culture practices. Surely, the percentage reduc-tion in FMWs between the two densities (Fig.3) is suf-¢cient to in£uence the marketable price over time. However, because market size was not reached, we did not consider the consumer’s choice for ¢sh size in our pro¢tability analysis, as it proved di⁄cult to in-troduce this factor in numerical terms in simple cost balancing. When this can be carried out, ¢sh pro-duced at 5 m" 2will be obviously priced much lower.
Hence, net return and, as a consequence, pro¢tability
will be low. Finally, based on its growth performance, low-cost investment and pro¢tability value, the den-sity of 3 m" 2appears to be the most cost e¡ective.
Stocking density had negative e¡ects on both growth and feed utilization e⁄ciency, but positively sustains ¢sh production. This study clearly indicates that feeding Nile tilapia with A40 at 1 and 3 m" 2
re-sulted in rapid growth and better food utilization. High densities improve yield, production and pro¢t-ability. It was concluded that diet A40 and a stocking density of 3 m" 2could be used to minimize ¢sh
pro-duction cost and improve farm pro¢tability of Nile tilapia in stagnant earthen ponds.
Acknowledgments
This study was supported by grants from the General Direction for Development Cooperation (DGCD/BTC) of Belgium, the International Society of Limnology (SIL, TX, USA) and the FUNDP-University of Namur, Belgium. The authors thank the ¢shermen of Louho, in Porto-Novo suburb, Be¤nin, for their technical knowledge. Special thanks to Mr Pierre Azonsou who graciously allowed us to use his nine ponds for our experiments.
References
AbouY., Fiogbe¤ E.D. & Micha J.-C. A preliminary assessment of growth and production of Nile tilapia, Oreochromis nilo-ticus L., fed Azolla-based-diets in earthen ponds. Journal of Applied Aquaculture 19, in press.
Adebayo O.T., Fagbenro O.A. & Jegede T. (2004) Evaluation of Cassia ¢stulata meal as replacement for soybean meal in practical diet for Oreochromis niloticus ¢ngerlings. Aquaculture Nutrition 10, 99^104.
Ahmed Z.F. (1993) Electivity index and dietary overlap of Catla catla (Ham.) in fertilized, and fed and fertilized ponds of Ban-gladesh. MSc thesis, Faculty of Fisheries, Bangladesh Agri-cultural University, Mymensingh, 78pp. The Progressive Fish-Culturist 52,158^161.
Alan"r" A. (1996) The use of self-feeders in rainbow trout (Oncorhynchus mykiss) production. Aquaculture 145, 1^20.
Alan"r" A. & Br"nn"s E. (1996) Dominance in demand-feed-ing behaviour in Arctic charr and rainbow trout: the ef-fect of stocking density. Journal of Fish Biology 48, 242^ 254.
AlmazaŁn-Rueda P. (2004) Towards assessment of welfare in African cat¢sh, Clarias gariepinus: the ¢rst step. PhD thesis, Wageningen University, the Netherlands,151pp.
–20 –18 –16 –14 –12 –10 –8 –6 –4 –2 0 1 3 5
Stocking density (fish m–2)
% change in final mean weight
Figure 3 Percentage (%) change in ¢nal mean indivi-dual weight of Nile tilapia fed with same Azolla diet at three stocking densities. Percentage at each density was obtained by comparing the ¢nal individual mean weight at this density with that of the previous density.
AOAC. (1990) O⁄cial Methods of Analysis,15th edn. Associa-tion of O⁄cial analytical chemists, Arlington,VA, USA. APHA. (1992) Standard Methods for the Examination of
Water and Wastewater, 18th edn. American Public Health Association,Washington, DC, USA.
Beveridge M.C.M. (1996) Cage Aquaculture, 2nd edn. Fishing News Books, Oxford, UK, 346pp.
Bowen S.H. (1987) Dietary protein requirements of ¢shes-a reassessment. Canadian Journal of Fisheries and Aquatic Science 44,1995^2001.
Brown M.E. (1957) Experimental studies on growth. In: The Physiology of Fishes, Vol. I (ed. by M.E. Brown), pp. 361^ 400. Academic Press, NewYork, USA.
Castell J.D. & Tiews K. (1980) (eds.) Report on the EIFAC, IUNS and ICES Working Group on the Standardization of Methodology in Fish Nutrition Research, Hamburg, Federal Republic of Germany, 21^23 March, 1979, EIFAC Technical Paper, p. 26.
Cruz E.M. & Ridha M. (1989) Preliminary study on the production of tilapia, Oreochromis spilurus (Gˇnther), cultured in seawater cages. Aquaculture and Fisheries Management 20, 381^388.
Daungsawasdi S., Chomchei C., Yamorbsin R. & Kertkomut B. (1986) Net Cage Culture of Tilapia and Puntius in Klong Praew Irrigation Tank. Technical Paper NIFI No. 64. Bang-khen, Bangkok,Thailand,10pp.
Diana J.S., Lin C.K. & Schneeberger P.J. (1991) Relationship among nutrient inputs, water nutrient concentrations, primary production, and yield of Oreochromis niloticus in ponds. Aquaculture 92, 323^341.
Duncan D.B. (1955) Multiple range and multiple F-tests. Biometrics 11,1^42.
El-Sayed A.F.M. (1992) E¡ects of substituting ¢sh meal with Azolla pinnata in practical diets for ¢ngerling and adult Nile tilapia Oreochromis niloticus (L). Aquaculture and Fisheries Management 23,167^173.
El-Sayed A. (1999) Alternative dietary protein sources for farmed tilapia, Oreochromis niloticus spp. Aquaculture 179,149^168.
Engle C.R. & Valderrama D. (2001) E¡ect of stocking density on production characteristics, costs, and risk of producing ¢ngerling channel cat¢sh. North American Journal of Aquaculture 63, 201^207.
Ewing R.D., Sheahan J.E., Lewis M.A. & Palmisano A.N. (1998) E¡ects of rearing density and raceway conforma-tion on growth, food conversion, and survival of juvenile spring chinook salmon. The Progressive Fish-Culturist 60, 167^178.
FAO (2000) The State of theWorld Fisheries and Aquaculture. FAO, Rome, Italy.
FAO (2002) The State of the World Fisheries and Aquaculture. FAO, Rome, Italy.
FAO (2006) The State of the World Fisheries and Aquaculture. FAO, Rome, Italy.
Fasakin E.A., Balogun A.M. & Fasuru B.E. (1999) Use of duckweed, Spirodela polyrrhiza L. Schleiden, as a protein
feedstu¡ in practical diets for tilapia, Oreochromis niloticus L. Aquaculture Research 30, 313^318.
Fasakin E.A., Balogun A.M. & Fagbenro O.A. (2001) Evalua-tion of sun-dried water fern, Azolla africana, and duck-weed, Spirodela polyrrhiza, in practical diets for Nile Tilapia, Oreochromis niloticus, ¢ngerlings. Journal of Ap-plied Aquaculture 11, 83^92.
Fiogbe¤ E.D., Micha J.-C. & Van Hove C. (2004) Use of a natural aquatic fern, Azolla microphylla, as a main component in food for Omnivorous-phytoplanktonophagous tilapia, Or-eochromis niloticus L. Journal of Applied Ichthyology 20, 517^520.
Folch J., Lees M. & Sloane-Stanley G.H.S. (1957) A simple method for the isolation and puri¢cation of total lipids from animal tissues. Journal of Chemistry 226, 497^509. Hartley H.O. (1959) Smallest composite designs for quadratic
response surface. Biometrics 15,611^624.
Haylor G.S. (1992) Controlled hatchery production of Clarias gariepinus (Burchell): growth and survival of larvae at high stocking density. Aquaculture and Fisheries Manage-ment 23, 303^314.
Helser T.E. & Almeida F.P. (1997) Density-dependent growth and sexual maturity of silver hake in the northwest Atlantic. Journal of Fish Biology 51,607^623.
HuangW.-B. & ChiuT.-S. (1997) E¡ects of stocking density on survival, growth, size variation, and production of Tilapia fry. Aquaculture Research 28,165^173.
Irwin S., O’Halloran J. & FitzGerald R.D. (1999) Stocking den-sity, growth and growth variation in juvenile turbot, Scophthalmus maximus (Ra¢nesque). Aquaculture 178, 77^88.
Islam M.S. (2002) Evaluation of supplementary feeds for semi-intensive pond culture of mahseer, Tor putitora (Hamilton). Aquaculture 212, 263^276.
Islam M.S., Rahman M.M. & Tanaka M. (2006) Stocking den-sity positively in£uences the yield and farm pro¢tability in cage aquaculture of sutchi cat¢sh, Pangasius sutchi. Journal of Applied Ichthyology 22, 441^445.
Kebus M.J., Collins M.T., Brown¢eld M.S., Amundson C.H., Kayes T.B. & Malison J.A. (1992) E¡ects of rearing density on stress response and growth of rainbow trout. Journal of Aquatic Animal Health 4,1^6.
Leatherland J.F. & Cho C.Y. (1985) E¡ect of rearing density on thyroid and interrenal gland activity and plasma hepatic metabolite levels in rainbow trout, Salmo gairdneri, Richardson. Journal of Fish Biology 27,583^592. LeonardV. (1997) Use of an aquatic fern (Azolla ¢liculoides) in
two species of tropical ¢sh (Oreochromis niloticus andTila-pia rendalli). Doctoral dissertation, Catholic University of Louvain, Louvain-la-Neuve, Belgium, 276pp.
Leonard V., Breyne C. & Micha J.-C. (1998) Digestibility and transit time of Azolla ¢liculoides Lamarck in Oreochromis aureus (Steindachner). Aquaculture Research 29,159^165. Me¤lard Ch. (1986) Bases biologiques de l’e¤levage intensif du
Tilapia du Nil O. niloticus. Cahiers d’Ethologie Applique¤e 5, 1^224.
Aquaculture Research, 2007, 38, 595^604 Stocking density improve yield and pro¢tability of Nile tilapia YAbou et al.
r 2007 The Authors
Me¤lard Ch. (1999) Choix des sites, qualite¤ de l’eau et e¤cosyste'me d’e¤levage en aquaculture. CEFRA. Universite¤ de lie'ge^ station d’Aquaculture deTihange, Lie'ge, Belgium. Micha J.-C. & Leonard V. (2001-2002) Digestibility of the
aquatic fern Azolla ¢liculoides Lamarck in two species of tilapia: the phytoplanktonophagous Oreochromis niloticus (L.) and the macrophytophagous Tilapia rendalli (Boulen-ger). Bulletin des Se¤ances de l’Acade¤mie Royale des Sciences d’Outre-Mer 47,147^157.
NgW.K. & Wee K.L. (1989) The nutritive value of cassava leaf meal in pellet feed for Nile tilapia. Aquaculture 83, 45^58. Nguyen H.S., Bui A.T., Nguyen D.Q.,Truong D.Q., Le L.T., Ab-ery N.W. & De Silva S.S. (2005) Cultured-based ¢sheries in small reservoirs in northern Vietnam: e¡ect of stocking density and species combinations. Aquaculture Research 36,1037^1048.
Olvera-Novoa M.A., Capos S.G., Sabido M.G. & Martinez Pa-lacios C.A. (1990) The use of alfalfa leaf protein concen-trates as protein source in diets for tilapia (Oreochromis mossambicus). Aquaculture 90, 291^302.
Pankhurst N.W. & Van der Kraak G. (1997) E¡ects of stress on reproduction and growth of ¢sh. In: Fish Stress and Health in Aquaculture (ed. by J.K. Iwama & A.D. Pickering), pp.73^93. Cambridge University Press, Cambridge, UK. Phan P.D. & De Silva S.S. (2000) The ¢sheries of the Ea Kao
reservoir, southern Vietnam: a ¢shery based on a combi-nation of stock and recapture, and self^recruiting popula-tions. Fisheries Management and Ecology 7, 251^254. Pouomogne V., Takam G. & Pouemegne J.-B. (1997) A
preli-minary evaluation of cacao husks in practical diets for ju-venile Nile tilapia (Oreochromis niloticus). Aquaculture156, 211^219.
Rahman M.R. & Rahman M.A. (2003) Studies on the growth, survival and production of calbasu (Labeo calbasu Ham.) fry at di¡erent stocking densities in primary nur-sing. Bulletin of Sciences, University Ryuyus, Japon 76, 245^255.
Rahman A.M., Mazid M.A., Rahman R.M., Khan M.N., Hos-sain M.A. & HusHos-sain M.G. (2005) E¡ect of stocking density on survival and growth of critically endangered mahseer, Tor putitora (Hamilton), in nursery ponds. Aquaculture 249, 275^284.
Rowland S.J., Allan G.L., Hollis M. & Pontifex T. (2004) Pro-duction of silver perch (Bidyanus bidyanus) ¢ngerlings at
three stocking densities in cages and tanks. Aquaculture 229,193^202.
Ruane N.M. & Komen H. (2003) Measuring cortisol in the water as an indicator of stress caused by increased load-ing density in common carp (Ciprinus carpio). Aquaculture 218,685^693.
Ruane N.M., Carballo E.C. & Komen J. (2002) Increased stocking density in£uences the acute physiological stress response of common carp Ciprinus carpio (L.). Aquaculture Research 33,777^784.
Siddiqui A.Q., Howlader M.S. & Adam A.B. (1989) Culture of Nile tilapia, Oreochromis niloticus (L.), at three stock-ing densities in outdoor concrete tanks usstock-ing drainage water. Aquaculture and Fisheries Management 20, 49^58.
Soderberg R.W., Meade J.W. & Redell L.A. (1993) Growth, survival, and food conversion of Atlantic salmon reared at four di¡erent densities with common water quality. The Progressive Fish-Culturist 55, 29^31.
SugunanV.V. & Katiha P.K. (2004) Impact of stocking on yield in small reservoirs in Andhra Pradesh, India. Fisheries Management and Ecology 11,65^69.
Tacon A.G.J. (1990) Standard Methods for the Nutrition and Feeding of Farmed Fish and shrimp. Argent Laboratories Press,Washington, DC, USA, 454pp.
Tacon A.G.T. & Cowey C.B. (1985) Protein and amino acid re-quirements. In: Fish Energetics-New Perspectives (ed. by P. Tyler & P. Calow), pp. 155^184. John Hopkins University Press, Baltimore, MD, USA.
Vijayan M.M. & Leatherland J.F. (1988) E¡ect of stocking den-sity on the growth and stress-response in Brook charr, Salvelinus fontinalis. Aquaculture 75,159^170.
WatanabeW.O., Clark J.H., Dunham J.B.,Wicklund R.I. & Olla B.I. (1990) Production of ¢ngerling Florida red tilapia (Tilapia hornorum # T. mossambica) in £oating marine cages. The Progressive Fish-Culturist 52,158^161. Yakupitiyage A. (1989) Quantitative and qualitative aspects of
energy acquisition of the Cichlid ¢sh, O. niloticus, L. PhD thesis, Institute of aquaculture, University of stirling, Scotland, UK.
Yi Y., Lin C.K. & Diana J.S. (1996) E¡ects of stocking densities on growth of caged Nile tilapia (Oreochromis niloticus) and on yield of small tilapia in open pond water in earthen ponds. Aquaculture 146, 205^215.