Keywords: country planning, VHR satellite image, orthorectification, classification
ABSTRACT: This paper presents some results of the SPIDER project currently achieved in and around the city of Liège located in a hilly landscape. A Quick Bird image bundle product acquired on the 26th September 2003 is used. Digital spatial data like Very High Resolution (VHR) satellite images could be provided to the public authorities of the Walloon region thanks to the Walloon cartographic gateway. In urban context and especially in hilly region, such images must be orthorectified using a Digital Surface Model (DSM). A 1 m resolution DSM was elaborated by exploiting all the 3D data available in the study area. Firstly, a TIN was generated from vector data (points, lines and polygons) selected, on the one hand, from the 1:50 000 (DTED-WGS) and the 1:10 000 (DTM-10000, Top10v-GIS) cartographic database provided by the Belgian NGI and, on the other hand, from the 1:1 000 3D topographic database of the Walloon region (PICC). Then the TIN was rasterised and the DSM airborne LIDAR acquired along the main river-valleys is superimposed on the result. The ortho-image was then produced. The public authorities consider it as an end-product by itself which could be used in the place of the obsolete aerial orthophotos in the fast changing urban areas. Normally, the ortho-image of Liège should be available on the map server of the Walloon region in 2005, in order to check its usefulness for local and regional authorities. Moreover the local planning agency wish to take the opportunity of this study to update the spatial databases covering industrial and business development areas delineated on the urban plan.
1 INTRODUCTION
This paper presents some results of the SPIDER project (Improving SPatial Information extraction for local and regional DEcision makers using very high resolution Remotely sensed data) currently achieved in and around the city of Liège (Belgium). The differences with the study previously completed – in the same project – on the city of Ghent are twofold. First of all, Liège is located in a hilly landscape (main valley-slopes’ height reaches more than 200 m) whereas the relief of Ghent is totally flat (Figure 1). Secondly, Liège belongs to the Walloon region while Ghent is a part of the Flemish region. Because land and city planning are matters which come under regional authorities, the legal approach and the available spatial data differ from one region to the other.
In the study case of Liège, our purpose is to produce a Very High Resolution (VHR) orthorectified satellite image from a QuickBird image bundle product acquired on the 26th September 2003 using the 3D database of the Walloon region. Furthermore, we want to place this product at the disposal of the local public administrations thanks to the spreading of digital spatial data available for the whole Walloon region through Internet (or through Intranet for sensitive data). This means that municipal administrations could use this image and GIS facilities in their daily work with people having only a basic knowledge of GIS and without buying expensive equipment. A simple internet
The usefulness of VHR images for public administrations in an
urban hilly region
Marc Binard, Yves Cornet & Jean-Paul Donnay
Laboratory SURFACES – Unit of Geomatics, University of Liège, Belgium 17, allée du 6-Août (B5), B-4000 Liège
connexion enables the local agencies to display and download spatial data for planning purposes. The usefulness of VHR orthorectified satellite images will thus be assessed for this purpose. The URL of the Walloon cartographic gateway is:
http://cartographie.wallonie.be/PortailCarto/Maquette/index.php
On this server, display, query and download of the following data are possible: – locating data (railway, motorway, street and river networks),
– administrative divisions (provincial and municipal),
– 3-D topographic database of the PICC (Projet Informatique de Cartographie Continue), but the whole cover is not yet available,
– two kinds of raster data: firstly, LIDAR data and, secondly, aerial orthophotos on the whole region.
The spatial resolution of the orthophotos varies from 0.4 to 0.8 m. As they become obsolete, VHR satellite images could potentially be used in their place if multispectral and panchromatic QuickBird images are merged. The resolution of the image is thus 0.64 m. Then, the usefulness of ortorectification is justified by the VHR of the satellite data, but also by the combination of the hilly context and the urban and suburban characteristics of the area. The urban characteristics imply the use of an accurate DSM instead of a DTM. Moreover, its cell size should be as close as possible to the one of the image and to fulfil the requirements of the potential use of the image by the administrations. As the only available DSM with the required resolution is the LIDAR DSM produced on a part of the area, it was decided to create a DSM at the same resolution for the whole area. We used all the coherent 3D data of the region to get a high density of observations in order to restore the high frequencies of this context, with breaklines and urban objects height.
This paper presents how the existing database of the Walloon cartographic gateway can help to produce such an ortho-image.
Figure 1. Location of the Ghent and Liège test sites on a shaded relief map of Belgium (Regions are delimited by white lines).
2 DSM BUILDING
2.1 Data description, management and GIS pre-processing Three 3-D geodatabases were used (Figure 2).
Figure 2. 3-D Sources (from left to right) aerial LIDAR, NGI (1:10 000 & 1:50 000) and PICC (1:1 000).
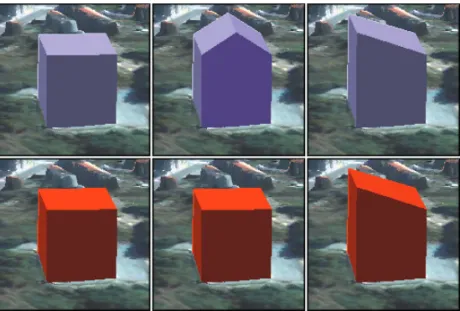
PICC is a 3D topographic database produced by the Cartographic and Topographic Direction of the Ministère de l’Equipement et de Transports (MET). The stored data are mainly man-made features like building roofs at the cornice height, road border and centre lines, walls, hydrologic, electric and sewer networks objects. But some isolated trees and several level points in pasture, crops and forest area are also stored. The scale of this cartographic project is 1:1 000. The 3D-accuracy is ~25 cm (http://internet.win.be/). The PICC database is divided in “tiles” of 1 000 ha (A. Collignon 1995, El Osta et al. 1998). This structure implies a huge data management and spatial processing phase. Thirty-one “tiles” were downloaded in the 2D structure from exported format of the Walloon gateway. It is noteworthy that this 2D data collection contains z-value needed for the DSM production. But the initial 3D geometry must be restored by submitting this database to an intensive GIS processing. Concerning the buildings polygons, the z-value of each vertex is taken at the cornice level. This means that buildings mainly look like a rectangle parallelepiped volume (Figure 3). The only exception occurs when the building has only one section inclined roof.
Figure 3. Modelling of building shape in the PICC 1:1 000 3-D database (Real shapes on the top and models on the bottom).
Three sets of data of the National Geographic Institute (NGI) were also used covering 18 “tiles” of the 1:10 000 vector data squaring. These sets are the DTM-10000, TOP10V-GIS and DTED-WGS products of NGI (http://www.ngi.be). The DTM-10000 product contains 3D features consisting in points, valley axe lines, breaklines and polygons. The 3D geometry was thus well defined without any other GIS pre-processing. The accuracy of the data is variable depending on the way of production. In the majority of the study area, they were restored in 3D by photogrammetric technics from 1:21 000 and 1:6 000 aerial photos. Their geometric accuracy is ~1 m. The TOP10V-GIS is a 1:10 000 scale cartographic product. From this, we only used the contour lines. Thirdly, the DTED-WGS was also used in the southern part of our study area where all the other sources of data are missing. This is created from contour lines digitized on the 1:50 000 map. The grid produced by the NGI from these contour lines in a Plate Carrée reference frame with a cell size of 2″ in longitude and 1″ in latitude. It was reprojected in the Belgian Lambert reference frame and interpolated at a 10 m resolution in this reference system.
From the Service d’Etudes Hydrologiques (SETHY) of the MET, we also obtained airborne LIDAR data acquired along the navigable rivers from the valley floor until ~20 m elevation along the valley-slopes (Figure 1). Heights from the first and last echoes are available. In this research only the first echo had to be used because the height of trees must be included in the DSM. The spatial resolution of this DSM is 1 m and the height accuracy is 13 cm (Dierickx & Da Col, 2002, Da Col, 2003). Forty “tiles” were merged together. This DSM was superimposed on the DSM obtained from the former data sets.
2.2 DTM and DSM creation
Two TIN (Triangulated Irregular Network) were built. The first one represents the ground level surface using some of the PICC features and the 1:10 000 NGI vector data. The second surface is the envelope surface above the ground level produced from the buildings polygons and other elevated objects. For both surfaces, the objects selection in the PICC database was based on the attribute modalities corresponding to the feature types. As the final resolution of the DSM is 1 m, objects with a thickness smaller than 1 m were ignored (fences, walls, masts, etc.). We didn’t use the z-value of trees because only the height of “remarkable” trees is available in the PICC and moreover these trees are defined as point features.
2.3 Integration of the two products with the other data
The two TIN were rasterised at 1 m resolution using linear interpolation method to produce one DTM and one intermediate DSM. Pixels of this intermediate DSM located outside of the elevated object polygons were set to “0”. The superimposition of this DSM on the other DTMs produces a DSM with a steep decrease in elevation at the buildings edges.
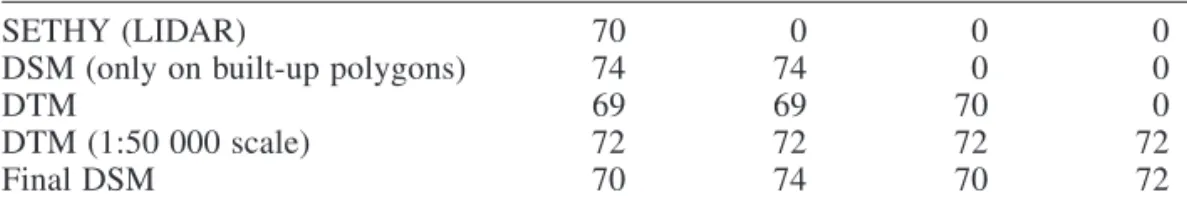
The area not covered by the LIDAR campaign was also set to “0” on the LIDAR DSM. The 1:50 000 DTM was used in the absence of other data, according to the following superimposition rule: For each pixel of the stack, the first value greater than “0” among the 4 values corresponding to this pixel was assigned to the final output with the following priority order between layers: SETHY (LIDAR), Intermediate DSM, 1:10 000 DTM and 1:50 000 DTM (Table 1).
Table 1. Illustration of the applied rule to obtain the final DSM
SETHY (LIDAR) 70 0 0 0
DSM (only on built-up polygons) 74 74 0 0
DTM 69 69 70 0
DTM (1:50 000 scale) 72 72 72 72
Final DSM 70 74 70 72
2.4 Characteristics of the QuickBird image
The panchromatic and multispectral bands of the QuickBird image acquired on the 26th September 2003 were merged using a local statistics matching method, the Intensity Normalized Ratio band
per band or INRbpb algorithm (Cornet 2003), with a convolution window of 11 * 11 pixels. For a Belgian site, we were very lucky to get a cloud-free image. At the opposite, the geometric configuration of the sun illumination and satellite view direction is not optimal. The sun azimuth of 161.2° and elevation of 36.9° generate shadows not located in the occluded zones parts of the image in relation with the satellite view angle of 13.3° off-nadir and the satellite azimuth of 346.5°.
3 ORTHORECTIFICATION PROCESS
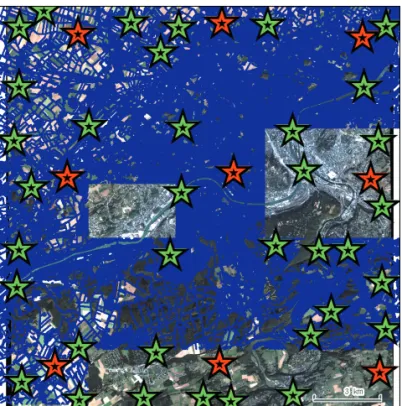
In Liège, contrary to the work done in Ghent where a GPS survey was achieved, we exploited several points of 3D database of the PICC and time and money were thus saved to perform the image orientation. The selection of Ground Control Point (36 GCP) or Check Points (9 CP) candidates was done visually by displaying the features of the PICC geodatabase on the QuickBird image (Figure 4). Aerial orthophotos were used in areas without PICC data. The software used for the orthorectification is the “ORTHOBASE” module of ERDAS (LPS – Leica Photogrammetry Suite). The values of the Root Mean Square (RMS) error were 1.15 m for × and 0.61 m for y. After this orientation, the ortho-image was created using, on one hand, the 1 m DSM and, on the other hand, the 1/50 000 DTM.
Figure 4. Location of the 36 GCP (green/light stars) and of the 9 check points (red/dark stars).
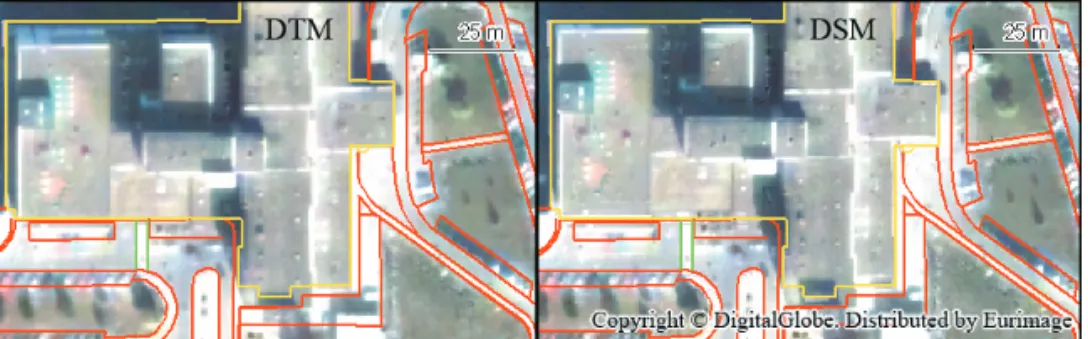
On the left of the Figure 5, it’s obvious that the corners of the hospital better fit the vector data on the orthorectification using the DSM than the one using the DTM.
4 APPLICATIONS AND PRODUCTS
As the main purpose of the SPIDER project is to promote the use of VHR images in the administration, several applications have been set up:
* Ortho-image on the Walloon Gateway. The ortho-image and particularly the fused true colour composite can be seen as an end-product by itself which can be used as a surrogate for obsolete aerial orthophotos in the fast changing urban areas. In this case, the ortho-image of Liège will
normally be available on the map server of the Walloon region in 2005, in order to check its usefulness for local and regional authorities. Unfortunately, some copyright issues arise to put the image on the server in an Intranet at a reasonable price. We hope that negotiations will succeed before the end of the project.
* DSM. The DSM is also a useful product in daily country planning, more particularly in association with the ortho-image. Moreover, DSM construction allows to check very efficiently the coherence of the dataset downloadable by the users. It can be considered as a quality control operation. For example, a point with a wrong z-value of “0” is automatically seen on the raster DSM (Figure 6). Figure 5. The hospital corners fit better the vector with orthorectification done with DSM (right).
Figure 6. DSM with wrong “z” value (left) and DSM after correction (right).
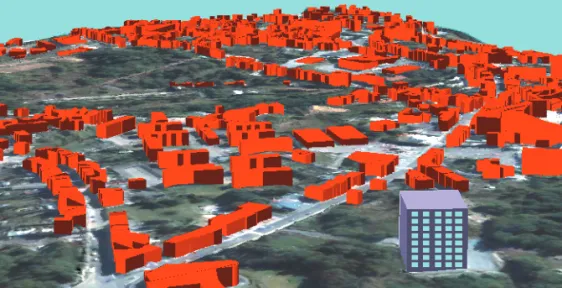
* 3D-shapes of the buildings. As shown in Figure 3, the general shape of buildings is available. Moreover, in the database, the following attributes are available for more than 120 000 buildings: street name, id-code of the building, ZIP code, village and municipality name, building use, perimeter and surface area. For more than 165 000 other buildings only the perimeter and the covered area are known. This 3D information is particularly useful in 3D views (see next point). * 3D-view products. The use of the ortho-image draped on the DSM allows the creation of 3D views (Figure 7) modelling the landscape like it should be seen from a particular point of view. Simulations of the impact on the landscape of a new building can thus be done by changing for example the extrusion parameters in regard to the building height.
* Free spaces available inside of business parks. A special request was done by the regional administration to know the availability of free spaces inside of the business parks and to validate existing spatial information. At the local level, we gathered information from one of the agencies in charge of the development of the Alleur park (see Figure 8a & b). We show the information collected at the regional level in the bottom of the same figure. Firstly, vectors coming from the “Plan de Localisation Informatique” (PLI) having as sources the raster plans from the cadastre administration that are rectified to fit as best as possible the Belgian Lambert projection (most of the cadastre plans in Belgium were surveyed in local coordinates systems). Secondly, the 1: 1 000 database of the PICC is shown on the Figure 8d. One can note on it that the PICC database elaborated from aerial photos of 1995 in this example, need some updates. For example, the limits of the building located at the western part of the park are available on the business park
Figure 7. Simulation of the impact of a new building on the landscape.
Figure 8. Free spaces in Business Parks are easily interpreted on the QuickBird image recorded the 26th September 2003 – Vectors database gathered at local (a, b) and at regional (c, d) levels.
Free of use
Already sold Out of the SPI area management
Building Parcel 500 m
(a) Status of parcels in business park plan (SPI) May 2005
(b) Business Park Database on QuickBird (SPI) May 2005
(c) Cadaster on QuickBird (PLI) August 2003 (d) 1: 1 000 Database on QuickBird (PICC) 1995
database (8b) and on the PLI (8c) but are not available on the PICC (8d). The same observation can be done for the building located 200 m in the northeast direction of point 2. In fact, it is obvious that “free” spaces are still available: 1.6 ha for parcel 1, and respectively 3.7 and 7.4 ha for parcels 2 and 3. At this stage, the necessity to use image classification is not really needed because the large parcels size make visual interpretation process very efficient. But it is more complicated to know if the parcels 2 and 3 are intentionally “frozen” to allow the extension of the existing companies or if new buildings constructions are planned in the coming months. In any case, a field validation done in May 2005 shows that these parcels are still used for agricultural purpose.
* Validation of the DSM obtained from an IKONOS stereopair. The DSM is currently used as a reference DSM for the validation of another DSM obtained by one of the SPIDER teams of the University of Ghent from the IKONOS stereopair (Devriendt et al., 2005) acquired on 3rd
September 2004. This DSM covers less than one half of the total ortho-image (only 142 of the 315 km2). Presently, it’s available at 10 m resolution but it will be soon available at 1 m resolution for some parts of the area. This DSM is also used to perform height and structural validations of a DSM extracted from a SPOT5-HRS pair (Cornet et al., 2005).
5 CONCLUSION
An added value is always given to the VHR images when they are used in association with spatial geodatabases. Here, the 3D vector databases allow, on the one hand, the DSM creation and GCP selection and, on the other hand, the orthorectification of the VHR image. A good quality ortho-image is a multi-purposes product and the list of applications is not closed. It is also possible to make applications involving other spatial databases like administrative divisions or socioeconomic information for example census track delineations.
ACKNOWLEDGEMENTS
The Belgian Science Policy Office is gratefully acknowledged for funding the work that is presented in this paper (project SR/00/02). We also thank the providers of the 3-Ddata bases (SETHY, NGI and MET) who allowed the use of the data for free. The authors also wish to thank the other teams of the SPIDER project. More information about the SPIDER project is available at the URL www.vub.ac.be/spider.
REFERENCES
Collignon, A. 1995. The Continuous Cartography Project: A 3D Management Tool for the Walloon Region. GIS Europe, June 1995, 28-30.
Cornet, Y., Schencke, C., de Béthune, S., Binard, M. & Muller, F. 2003. Stratégies de fusion d’images P/XS basées sur les principes colorimétriques et d’égalisation de statistiques locales, Bulletin de la Société Française de Photogrammétrie et Télédétection, no. 169, 2003, p. 35-45.
Cornet, Y., Grevesse, J., Binard, M., Peeters, C., Tihon, G., Bastin, T. & Donnay J.-P. 2005. DSM from SPOT5-HRS images: extraction and validation. Workshop 3D Remote Sensing, EARSeL 2005, Porto, 10-11 June 2005.
Da Col, A. 2003. Validation du MNT laser du SETHY. Rapport interne, SURFACES, Université de Liège, Mars 2003, 8 p.
Devriendt, D., Goossens, R., Binard, M. & Cornet, Y. 2005. Accuracy assessment of an IKONOS derived DSM over urban and suburban area. Workshop 3D Remote Sensing, EARSeL 2005, Porto, 10-11 June 2005.
Dierickx, Ph., Da Col, A. 2002. Utilisation des techniques sonar et laser dans le cadre de la connaissance des zones d’inondations. AM/FM BELUX News, no. 24, Novembre 2002, 13-16.
El Osta, E., Heymans, L. & Paquet, F. 1998. Le fond de plan PICC généralisé et l’aménagement du territoire en Wallonie. Bulletin de la Société géographique de Liège, 34, 1998, 95-104.