HAL Id: tel-03198787
https://tel.archives-ouvertes.fr/tel-03198787
Submitted on 15 Apr 2021HAL is a multi-disciplinary open access
archive for the deposit and dissemination of sci-entific research documents, whether they are pub-lished or not. The documents may come from teaching and research institutions in France or abroad, or from public or private research centers.
L’archive ouverte pluridisciplinaire HAL, est destinée au dépôt et à la diffusion de documents scientifiques de niveau recherche, publiés ou non, émanant des établissements d’enseignement et de recherche français ou étrangers, des laboratoires publics ou privés.
Regulated activity of a bacterial transenvelope
machinery : the LPS Transport System
Tiago Baeta
To cite this version:
Tiago Baeta. Regulated activity of a bacterial transenvelope machinery : the LPS Transport System. Biomolecules [q-bio.BM]. Université Grenoble Alpes [2020-..], 2020. English. �NNT : 2020GRALV037�. �tel-03198787�
1
THÈSE
Pour obtenir le grade de
DOCTEUR DE L’UNIVERSITÉ GRENOBLE ALPES
Spécialité : Chimie BiologieArrêté ministériel : 25 mai 2016
Présentée par
Tiago BAETA
Thèse dirigée par Jean-pierre SIMORRE (CNRS), et co-encadrée par Cédric LAGURI (CNRS)
préparée au sein du Laboratoire Institut de Biologie Structurale dans l'École Doctorale Chimie et Sciences du Vivant
Activité régulée d’une machinerie de
transenveloppe bactérienne : le système de
transport du LPS
Regulated activity of a bacterial transenvelope
machinery: the LPS Transport System
Thèse soutenue publiquement le 11 décembre 2020, devant le jury composé de :
Monsieur Jean-pierre SIMORRE
DIRECTEUR DE RECHERCHE, UMR5075 – Institut de Biologie Structurale, Directeur de thèse
Madame Cécile Morlot
DIRECTRICE DE RECHERCHE, UMR5075 – Institut de Biologie Structurale, Président
Madame Alessandra POLISSI
PROFESSEUR, Université de Milan, Examinatrice Madame Carine TISNE
DIRECTRICE DE RECHERCHE, UMR8261 – Université de Paris
(Institut de Biologie Physico-Chimique IBPC), Rapportrice
Madame Sophie ZINN-JUSTIN
DIRECTRICE DE RECHERCHE, UMR9198 – Institut de Biologie Intégrative de la Cellule (IB2C), Rapportrice
3 “Nothing in Biology Makes Sense Except in the Light of Evolution”
4
Acknowledgements
Working and writing this manuscript has been one of the most difficult things I have done in my life. But it is finished.
To all my friends (here and back home), family, loved ones. I do not need to say who you are, you know it already. This chapter is almost closing and a new one about to begin.
I would like to thank Alicia Vallet & Adrien Favier for all the support in the NMR platform (IBS), Isabel, Lionel & Karine for all the wet lab help, Catherine Bougault & Beate Bersch for the scientific discussions, and all the NMR group for the support, knowledge and expertise given along this project.
I do not know where the road will take me next, but I know where it wants to end, and for me that is all that matters. All of us have hopes and dreams, and I hope that everyone of us may see them fulfilled.
I have once been told, an awfully long time ago, something that sticked with me. Now I replicate this advice to whoever reads this: “make yourself the favor of being happy”.
5
Agradecimentos
Trabalhar e escrever neste, e para este manuscrito, foi uma das coisas mais difíceis que já fiz na minha vida. Mas está terminado.
Para os meus amigxs, família, amadxs (aqui e em casa). Não preciso de vos enunciar, vocês sabem quem são. Este capítulo está prestes a chegar ao fim e um novo está quase a começar.
Gostava de agradecer à Alicia e ao Adrien pela ajuda na plataforma de RMN (IBS), à Isabel, Lionel & Karine pela ajuda no laboratório, à Catherine (Cathy) e Beate pelas discussões científicas, e a todo o grupo RMN pelo suporte, conhecimento e experiência dada ao longo deste projeto.
Não sei onde a estrada me vai levar a seguir, mas sei onde quero que acabe, e para mim isso é tudo o que importa. Todxs temos desejos e sonhos, e espero que cada um de nxs os veja concretizados.
Há muito tempo atrás disseram-me uma vez algo que permaneceu comigo. Deixo agora o mesmo para qualquer pessoa que leia isto: “façam o favor de ser felizes”.
6
Abstract (English)
Bacteria display several intrinsic mechanisms which confers them the ability to cope with disadvantageous situations, such as nutrient deprivation, environmental inter/intra-species competition, managing adaptation to detrimental conditions, and handling effects of antibacterial compounds.
In a global context of antibiotic resistance accelerated by anthropogenic activities, gram negative bacteria display intrinsic resistance mechanisms. The complex and dynamic multilayered envelope, coated with lipopolysaccharides (LPS), confers these bacteria increased survivability. Biosynthesis of these complex glycolipids is initiated in the cytoplasm, and its transport proceeds along the inner membrane, periplasm, until reaching the outer membrane, with a dedicated biosynthetic pathway and transport machinery.
The Lipopolysaccharide Transport (Lpt) machinery comprises seven fundamental proteins (LptA to LptG) that span the entire envelope. More specifically, at the inner membrane, LptB2FG ABC transporter couples ATP hydrolysis with LPS extraction. LptB2 cycles ATP while LptF/G interact with LPS and carry it towards LptC and LptA in the periplasm.
This machinery uses a conserved architecture with dedicated jellyroll domains present on LptF, LptG, LptC and LptA that assemble into a bridge that allow LPS flow to the outer membrane.
Molecules that would disrupt protein-protein interactions between the different jellyroll domains of the Lpt system could become potent cell wall inhibitors. Thanatin, a natural occurring antimicrobial peptide, has been described as targeting the jellyroll domains of the machinery. We screened its effect in the disruption of LptC-LptA complex. Thanatin binds to LptA but not LptC and inhibits the assembly of the complex at low nM concentrations, showing the potential of targeting Lpt Jellyroll-jellyroll interactions.
The network of interactions between the Inner membrane complex, LptB2FG and periplasmic LptC and LptA is not fully understood. LptB2FG was produced in detergent micelles and within nanodisc particles, to probe interactions with LptC and LptA at an atomic scale, using Nuclear Magnetic Resonance (NMR) and biophysical techniques.
In the assembly of the LptB2FGCA bridge, LptC and LptF interact mostly through the jellyroll domains. A mutation in the LptF jellyroll (R212 residue) rendered LptC presence facultative in vivo.
Biophysical and biochemical characterization showed unaltered interaction of mutant LptB2FG with LptC and LptA, whereas ATPase activity showed lack of regulation by
7 presence of its partners. This led us to propose that R212 is a checkpoint in the LptF jellyroll, acting as a hub for LptB2FG to sense proper assembly of the machinery.
When LptB2FGCA complex is assembled in vitro, LptB2 was found capable of catalyzing phosphotransfer between ADP molecules, generating ATP and AMP, a novel activity (Adenylate Kinase) previously undescribed for this protein. Being a topic of very recent interest in the literature, the role of dual-function transporters is not understood. To characterize the balance between ATPase and AK, we mutated LptB2 on key ABC motifs to probe possible location for AK activity. LptB2FG studied in nanodisc particles, suggests that balance between activities depends on the dynamic assembly of LptB2FGCA, with regulatory mechanisms possibly not being shared between both activities. Structural characterization of LptB2 in apo and nucleotide bound-state was initiated.
This project, focused on the essential Lpt system, sheds light on the importance of protein-protein interactions as targets for designing future antimicrobial compounds. It could also be worth evaluating if dual-function transporters, involved in cell wall synthesis and drug export, are valid targets for future drug screenings.
Key-words: Antibiotics, Gram-negative bacteria, Cell wall, Regulation, Lipopolysaccharides, LPS Transport Machinery
8
Abstract (Français)
Les bactéries présentent plusieurs mécanismes qui leur confèrent la capacité de faire face à des situations difficiles.
Dans un contexte global de résistance aux antibiotiques, les bactéries à Gram négatif présentent des mécanismes de résistance intrinsèque. L'enveloppe multicouche complexe et dynamique, enrobée de lipopolysaccharides (LPS), confère à ces bactéries une capacité de survie accrue. La biosynthèse de ces glycolipides est initiée dans le cytoplasme et son transport se déroule depuis la membrane interne jusqu'à la membrane externe, avec une voie de biosynthèse/transport dédiée.
La machinerie de transport des lipopolysaccharides (Lpt) comprend sept protéines fondamentales (LptA à LptG) qui couvrent toute l'enveloppe. Au niveau de la membrane interne, le transporteur LptB2FG couple l'hydrolyse de l'ATP avec l'extraction du LPS. LptB2 est directement en charge de l’hydrolyse de l’ATP tandis que LptF/G interagit avec le LPS et le transporte vers LptC/LptA dans le périplasme.
Cette machinerie utilise une architecture conservée avec des domaines de jellyroll dédiés présents sur LptF/G/C/A qui s'assemblent en un pont permettant au LPS de s'écouler vers la membrane externe.
Les molécules qui seraient capables de perturber les interactions entre protéines et les différents domaines jellyroll du système, pourraient devenir de puissants inhibiteurs de la construction de la paroi cellulaire. La thanatine, un peptide antimicrobien naturel, a été décrite comme ciblant les domaines jellyroll de la machinerie. Nous avons examiné son effet dans la perturbation du complexe LptC/A. La thanatine se lie pas à LptC mais uniquement à LptA et inhibe l'assemblage du complexe à faible concentration (de l’ordre du nao molaire), démontrant ainsi le potentiel des interactions entre les jellyrolls du système LptC.
Le réseau d'interactions entre LptB2FG et LptC/A n'est pas entièrement compris. Le LptB2FG a été produit dans des micelles de détergents et dans des particules de type nanodisque, pour sonder les interactions avec LptC et LptA à l'échelle atomique, à l'aide de diverses techniques biophysiques.
Dans l'assemblage du pont LptB2FGCA, LptC/F interagissent principalement à travers les domaines jellyroll. Une mutation dans le résidu R212 de LptF a rendu la présence de la protéine LptC facultative in vivo.
La caractérisation biophysique/biochimique a montré une interaction inchangée du mutant LptB2FG avec LptC et LptA, tandis que l'activité ATPase a montré un manque de régulation
9 par la présence de ses partenaires. Cela nous a conduit à proposer que R212 soit un point de contrôle dans LptF pour que LptB2FG détecte le bon assemblage de la machinerie.
Lorsque le complexe LptB2FGCA est assemblé in vitro, LptB2 s'est avérée capable de catalyser le phosphotransfert entre deux molécules d'ADP, générant de l'ATP et de l'AMP, et représentant une nouvelle activité (Adenylate Kinase) jusqu'alors non décrite pour cette protéine. Étant un sujet très récent dans la littérature, le rôle des transporteurs à double fonction n'est pas encore bien compris. Pour caractériser l'équilibre entre ATPase et Adenylate Kinase, nous avons muté LptB2 sur des motifs ABC clés pour sonder l'emplacement de l'activité Adenylate Kinase. L’étude du complexe LptB2FG préparé dans des particules de nanodisques, suggère que l'équilibre entre les activités dépend de l'assemblage dynamique de LptB2FGCA. La caractérisation structurale de LptB2 dans sa forme apo et lié aux nucléotides a été initiée.
Ce projet, axé sur le système Lpt essentiel pour la survie bactérienne, met en lumière l'importance des interactions protéine-protéine comme cibles pour la conception de futurs composés antimicrobiens. L’intérêt de cibler des transporteurs à double fonction, à la fois impliqués dans la synthèse de la paroi cellulaire et l'exportation de médicaments, pourrait aussi représenter une piste prometteuse pour la recherche future de nouvelles drogues.
Mots-clés: Antibiotiques, Gram-negative bacterie, Paroi cellulaire, Régulation, Lipopolysaccharides, Machinerie de transport de LPS, Lipopolysaccharides
10
Table of Contents
Acknowledgements ... 4 Agradecimentos ... 5 Abstract (English) ... 6 Abstract (Français) ... 8 Table of Contents ... 10 List of Figures ... 14 List of Tables ... 23 INTRODUCTION ... 24I. Antibiotics discovery and rising resistance mechanisms ... 24
1.1. Rise of Antibiotic Resistance ... 24
1.1.1. Anthropogenic activities accelerate the emerging resistance ... 24
1.1.2. Discovery and main hallmarks in antibiotic Development ... 26
1.1.2. Antibiotics and Mode of Action – Cell Wall inhibitors ... 29
1.2. Mechanisms of Antibiotic Resistance ... 31
1.2.1. Resistance through antibiotic modifications ... 31
1.2.2. Resistance through changes on targets ... 33
1.2.3. Resistance through permeability control – efflux pumps ... 34
1.2.4. Resistance dissemination mechanisms ... 36
II. Gram-negative bacteria are impermeable to many compounds ... 37
2.1. WHO establishes a Priority Pathogens List ... 37
2.2. The Gram-negative Cell Wall ... 39
2.2.1. Inner Membrane and periplasm Membrane ... 40
2.2.2. Gram-negative display an extra layer – the outer membrane ... 42
2.3. Lipopolysaccharide is responsible for permeation of the outer membrane ... 43
2.3.1. LPS biosynthesis and assembly ... 44
2.3.1.1 Constitutive pathway for lipid A formation: the Raetz Pathway ... 45
2.3.1.2. Core polysaccharide: the inner and outer cores ... 48
2.3.1.3. MsbA flips the nascent LPS into the inner membrane ... 49
2.3.1.4. Assembly of smooth-LPS: incorporation of O-antigen ... 51
2.3.2. Importance of LPS for bacterial survivability and interactions with the Host ... 53
2.3.2.1. TLR4 recognizes LPS and triggers inflammatory response ... 55
2.3.2.2. LPS structural diversity contributes to evasion of Host’s immune defences... 56
2.3.2.3. Sensing of envelope instability triggers proteome reshuffle ... 57
11
2.4. Building the envelope – the Lpt machinery ... 60
2.4.1. Transporters as a pathway for cargo shipment ... 61
2.4.1.1. Transporter Systems exchange molecules between environments ... 61
2.4.1.2. ABC transporters ... 63
2.4.1.2.1. Transporters with coupled ATPase and Adenylate Kinase activities ... 65
2.4.1.3. Nucleotide-Binding Domains and ATP hydrolysis ... 66
2.4.1.4. Models of Substrate Translocation ... 68
2.4.2. Inner-Membrane partners LptB2FG/C ... 70
2.4.3. LptA bridges IM and OM Lpt complexes ... 75
2.4.4. The Outer-Membrane translocon LptDE ... 76
2.4.5. Current model of LPS transfer ... 77
2.4.5.1. The β-jellyroll fold physically bridges both membranes ... 77
2.4.5.2. The PEZ model revisited ... 78
2.5. Molecules that target the Lpt synthesis/transport machinery ... 80
III. Framework of Thesis Project ... 82
3.1. Structural Biology – correlating Structure with Function ... 82
3.1.1. Nuclear Magnetic Resonance (NMR) ... 82
3.1.2. Other Biophysical techniques ... 85
3.1.2.1. X-ray crystallography in structural determination ... 85
3.1.2.2. SEC-MALLS and SPR measure affinity between proteins ... 86
3.2. Main objective of Thesis project... 87
IV. Assembly of LptB2FG-LptC-LptA is essential for LPS transport ... 88
IV.1 Results ... 90
4.1. LptC-LptA interaction is disrupted by the natural antimicrobial peptide thanatin ... 90
4.2. LptF-LptC interaction is a checkpoint for Lpt machinery ... 93
4.2.1. Expression of LptF and LptG periplasmic domains ... 93
4.2.2. Expression/purification of LptB2FG inner membrane complex and LptB2FR212GG, for which LptC becomes non-essential in vivo ... 101
4.2.3. LptB2FR212GG interacts with LptC and LptA as the wild-type complex but its ATPase activity is not regulated by assembly with LptC and LptA ... 106
4.2.3.1. LptB2FG forms a stable complex with LptCm ... 106
4.2.3.2. LptB2FR212GG interacts with LptAm with the same affinity as the wild type ... 108
4.2.3.3. NMR investigation of LptA and LptC binding to LptB2FG complex ... 109
4.2.3. R212 position is a checkpoint sensing proper assembly of the Lpt “bridge” ... 112
IV.2. Conclusion and Discussion ... 115
12
V. LptB2 is an ATPase that displays Adenylate Kinase ... 133
V.1. Results ... 135
5.1. Functional characterization of the dual-activity of LptB2 ... 135
5.1.1. Expression, purification, and solubility ... 135
5.1.2. LptBY13W/E163Q/E163A display strong changes in activity profiles ... 139
5.1.3. Equilibrium modulation between ATPase and AK activity of LptB2FG ... 142
5.1.3.1. Full LptB2FG system accelerates ATPase activity ... 142
5.1.3.2. LptB2FG assembly with LptC and LptA stimulates AK activity ... 144
5.1.3.3. H195A and R212G impact differently the balance between ATPase/AK... 147
5.2. Structural probing of AK active site ... 149
5.2.1. Initial NMR experiments with 15N wt/E163A LptB ... 149
5.3.2. Nanocrystallization trials ... 151
5.3.2.1. Preliminary Crystal structure of LptB wt with Magnesium-Ap5A ... 152
V.2. Conclusion and Discussion ... 154
VI. Future Perspectives ... 159
6.1. Protein-protein interactions as a drug target: structural conservation of Lpt jellyrolls ... 159
6.2. Further validation of LptB2FGCA as a system for disruption of PPI ... 161
6.2.1. Structural characterization of the LptAQ62L-thanatin complex ... 161
6.2.2. Improvement of structural characterization on the LptFGCA network for LPS transport ... 161
6.3. Validation of AK activity for setting up screenings of AK inhibitors ... 163
6.3.1. Structural Pinpointing the AK active site with LptB2FG-Ap4A/Ap5A and cryo-EM ... 163
6.3.2. Possible role of AK in Time-resolved LPS transport ... 164
6.3.3. Setup of AK screening with available chemical libraries ... 165
VII. References ... 166
VIII. Materials and Methods ... 185
8.1. Screening inhibitory effect of Thanatin in LptC/A complex... 185
8.2. Interaction experiments to assay LptF-LptC checkpoint... 185
8.2.1. Production of LptB2FG/LptB2FR212GG ... 185
8.1.1.1. LptB2FG plasmids ... 185
8.1.1.2. Protein expression ... 185
8.1.1.3. Complex purification ... 185
8.1.1.3.1. Protein solubilization in n-Dodecyl β-D-maltoside (DDM) detergent ... 185
8.1.1.3.2. Protein solubilization in Styrene-Maleic Acid (SMA) copolymers... 187
8.2.2. Production of LptCΔ1-23/LptAΔ160 ... 188
13
8.2.2.2. LptAΔ160 plasmid construction, expression, and purification ... 190
8.2.3. Production of LptF/LptG plasmids ... 190
8.2.3.1. Bacterial Expression and Purification ... 191
8.2.4. EM, SEC-MALLS and SPR experiments with LptB2FG/LptB2FR212GG ... 193
8.2.4.1. LptB2FG dispersion and size estimation by Electron Microscopy (negative staining) 193 8.2.4.2. SEC-MALLS of LptB2FG/LptB2FR212GG complex with LptCm/LptAm ... 193
8.2.4.3. LptB2FG/LptB2FR212GG interaction with LptAm by SPR ... 193
8.2.5. NMR experiments ... 194
8.2.5.1. NMR spectra of LptB2FG with LptAm/LptCm ... 194
8.2.5.2. NMR spectra of LptG/F periplasmic domains ... 195
8.3. Equilibrium between ATPase/AK of LptB2... 195
8.3.1. LptB2/LptB2FG plasmid construction ... 195 8.3.2. Expression conditions ... 195 8.3.3. Purification of LptB proteins ... 196 8.3.4. Purification of LptB2FG proteins ... 197 8.3.5. ATPase/AK experiments ... 197 8.3.5.1. LptB2/LptB2FG/LptB2FGC experiments ... 197 8.3.5.2. NMR experiments ... 198 8.3.6. Structural studies ... 198
8.3.6.1. NMR experiments with LptB2 wt/E163A ... 198
8.3.6.1. LptB2 crystallization trials ... 199
8.3.6.2. LptB2 X-ray diffraction and structure determination ... 199
IX. Supporting Annexes ... 200
14
List of Figures
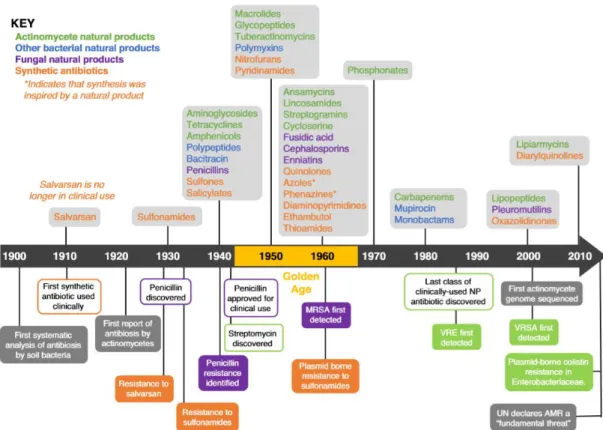
Figure 1 – Timeline of antibiotic development research, focusing on the main hallmarks. Green and
blue colours indicate natural products with bacterial origin, purple indicates natural products with fungal origin, and orange indicates synthetically developed compounds. In boxes with the same colour code, there is indication of the first report of resistance towards a specific antibiotic of the mentioned background (MRSA - methicillin-resistant Staphylococcus aureus; VRE – Vancomycin-resistant enterococci; VRSA – Vancomycin-Vancomycin-resistant Staphylococcus aureus). Adapted from 17... 27
Figure 2 – Main targets of clinically used antibiotics (adapted from 23), specifically aiming for nucleic
acid synthesis, protein expression, DNA replication and cell wall synthesis and homeostasis. ... 29
Figure 3 – Main examples of mechanisms through which pathogenic bacteria acquire antibiotic
resistance [adapted from (adapted from 23). Description indicates antibiotic (square), target protein (circle), susceptible cell line (blue) and resistant cell line (orange). ... 37
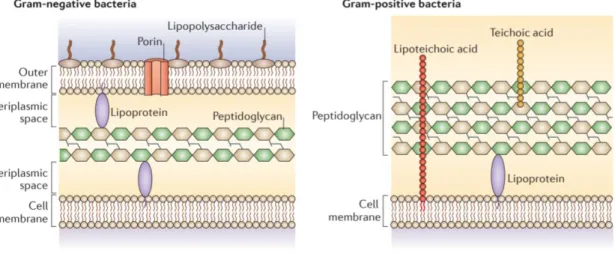
Figure 4 – Architectural differences between gram-positive and gram-negative cell wall. Adapted
from 55 ... 40
Figure 5 – Division and elongation machineries, respectively divisome and elongasome. Figure
adapted from 63. ... 42
Figure 6 – General view of LPS structure, with its three main moieties (O-specific glycan chain, the
[outer and inner] core region, and the lipid A). The first two constitute the glycan region of LPS, and the latter the lipid region. Adapted from 73. ... 44
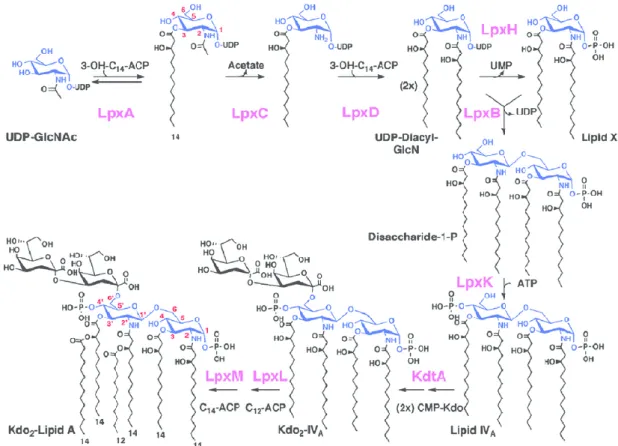
Figure 7 – Schematic overview of LPS synthesis and transport, with main events depicted: initially
the Raetz pathway generates Lipid A-Kdo2; the core assembly by the action of rfa/waa proteins; transport of the lipid A-core by MsbA which flips these molecules into the periplasmic side of the IM; O-antigen synthesis (here only depicted the ABC-dependent for representation purposes, the other two are further discussed below); the ligation of the lipid A-core with O-antigen by the WaaL ligase; and transport ensued by the Lpt machinery. Figure adapted from 77. ... 45
Figure 8 – The Raetz Pathway in Escherichia coli, with the synthesis reactions for lipid A, the lipid
moiety of LPS. In purple there are indications of the enzymes responsible for each step. Figure adapted from 81 ... 46
Figure 9 – Display of the rfa/waa locus in positive sense (right-pointing arrows) and negative sense
(left-pointing arrows), with the 3 operons waaA, gmhD and waaQ, responsible for the maturation of the core oligosaccharide in E. coli W3110. Proteins that assemble the inner core backbone are displayed in blue, the inner core-modifying proteins are displayed in red and outer core-modifying proteins are displayed in green. Adapted from 88. ... 49
Figure 10 – X-ray crystallography structure of E. coli MsbA in complex with LPS and an inhibitor (PDB
15 Figure 11 – Cryo-EM structural model (PDB 6BPL) of MsbA with lipid A (yellow) modelled into the
cavity. The red dashed line indicates the entry and pathway that LPS performs along its initial transport. Image adapted from 99. ... 51
Figure 12 – The 3 different pathways for O-antigen assembly and maturation across the inner
membrane of gram-negative: the Wzy-dependent, the ABC transporter and the synthase pathways. [O] stands for an O-antigen unit, repeated “n” times; S stands for sugar, and NDP is the nucleotide carrier. Adapted from 89. ... 52
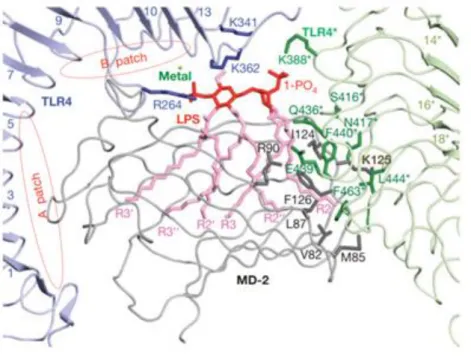
Figure 13 – Crystal structure of LPS-TLR4-MD-2 resolved at 3.1Å (PDB 3FXI), showing the interactions
between MD-2 (grey) and TLR4 (blue/green) that form the pre-complex, and the regions of interaction with LPS (red) in the hydrophobic groove. Panel adapted from 118. ... 56
Figure 14 – The Lipopolysaccharide transport (Lpt) machinery, responsible for transport of LPS
molecules from the cytoplasm (where its synthesis begins) towards and into the outer membrane. Proteins are colour-coded: LptA (red), LptB (green), LptC (blue), LptD (purple), LptE (yellow), LptF (orange) and LptG (cyan). ... 61
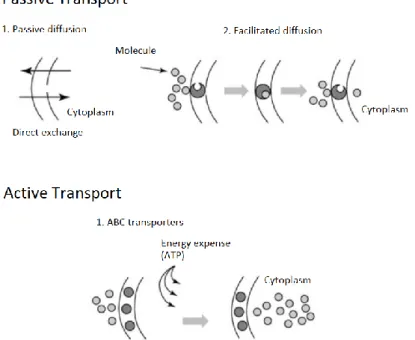
Figure 15 – Examples of transport classification according to type of transporter: passive transport
allows direct or facilitated diffusion, while active transport (such as the action of ABC transporters) drive cargo transport through the expense of energy (ATP hydrolysis). ... 63
Figure 16 – Representative structure of an ABC transporter, with the two Nucleotide-Binding
Domains (NBDs, in pink/purple), and the two Transmembrane Domains (TMDs, in green/yellow). Coupling helixes transmit the conformational changes of the NBDs upon nucleotide hydrolysis to the TMDs, driving the transport. Image adapted from 158. ... 64
Figure 17 – Proposed model for the MsbA ATPase-AK dual-activity, responsible for LPS flipping. The
additional active site is postulated to be located, in each monomer, close to the ATP-binding site. Image was adapted from 95. ... 65
Figure 18 – Representative scheme of one nucleotide-binding domain, with each of the conserved
NBD domains and a docked ATP molecule. ... 67
Figure 19 – Main mechanisms proposed for ABC exporters: the Alternating Access model (top panel)
and the Outward-only Model (bottom panel). In the figure, “T” and “D” letters in red represent, respectively, ATP and ADP. The first model is usually related to export of drugs, while the second model is usually for glycolipid molecules. ... 69
Figure 20 – Structural model of LptB2FG from K. pneumoniae (PDB 5L75), showing each protein
colour-coded: LptG in yellow and LptF in cyan forming the heterodimer (each transmembrane helix is numbered from one to six), and LptB2 (each monomer in green/blue). Estimated dimensions are
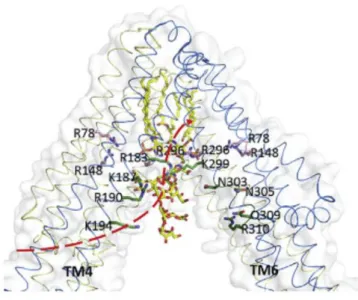
16 Figure 21 – Same structural model as Figure 20, in which electrostatic potential was plotted into the
structure, with negative in red and positive in blue. The inside cavity through which LPS is thought to enter via the lateral gate is mainly composed of positive residues (blue), that interact with negative charged groups of the lipid A. Image adapted from 149. ... 72
Figure 22 – Structural models of LptB2 originally from E. coli K12 (6MHU and 6MI8, for apo- and
bound- form respectively). Each monomer is coloured differently (pink and brown), evidencing the two conformations: the apo state with no nucleotide (NTD) bound, and the bound-form which evidences a more closed structure. ... 73
Figure 23 – Structure of LptC (PDB 3MY2) from E. coli. The N-terminal region lacks the first 23
residues, which compose the transmembrane helix which crosses the membrane and is responsible for modulating LPS access into LptB2FG and tunes ATPase activity of LptB2. The transmembrane helix
can be seen in PDB structure 6MIT, yet there are residues missing in the ensemble. ... 74
Figure 24 – Crystal structure of a LptA complex, composed of 2 monomers (each coloured in purple
and yellow) from E. coli (PDB 2R19). C-terminal (C-ter) residues R159-L169 that interact with the N-terminal (N-ter) residues Q34-L45, are depicted in sticks. ... 75
Figure 25 – Structure of LptDE “plug-and-barrel” from K. pneumoniae (PDB 5IV9), with each protein
colour-coded accordingly. N- and C-terminal regions are indicated. LptE is fixed inside LptD’s lumen and helps controlling LPS access to the lateral gate composed by the β1/26 of LptD. ... 76
Figure 26 – Proposed PEZ model for LPS transport. LptB2FG transforms chemical energy into
mechanical energy (through ATP hydrolysis) that pushes LPS molecules into the C-terminal region of jellyrolls of the Lpt partners, until reaching LptDE where it is translocated into the outer membrane. ... 78
Figure 27 – Schematic representation of LPS flow through LptB2FGC complex. LPS enters through the
lateral gate TMD5F-TMD1G, and lipid A negative sugar moieties (phosphorylated glucosamines) interact extensively with positive residues of LptF inside the cavity. LptF residues S157 and I234 establish a “gate” that blocks LPS passage unless ATPase activity forces the molecule to advance, upon dimerization of LptB2 and translocation of mechanical motion to LptFG. The mechanism
through which LPS passes from the LptF jellyroll to LptC’s jellyroll is not understood. All proteins are labelled and colour-coded (left structure was modelled from the PDB 6MIT from E. cloacae, while right structure was adapted from 184 also from the same organism). ... 79
Figure 28 – The Lpt machinery for LPS transport (LptA-G). Each protein is depicted as a different
colour. All periplasmic partners present a jellyroll fold which tends to permit association from N-to-C-terminal………..88
Figure 29 – LptAm-thanatin complex (green/orange respectively) superimposed with LptA-LptA
dimer (PDB 2R1A). Thanatin’s binding site on the mutant LptA is equal to the region through LptA oligomerizes (from N- to C-terminal). Figure adapted from 1………90
17
Figure 30 – Representative scheme for the BATCH system performance, showing both plasmids
carrying the T25 (orange) and T18 (blue) domains. The interaction of proteins of interest X and Y restores synthesis of cAMP synthesis due to reconstitution of the catalytic domain of the Adenylate Cyclase. Increasing cAMP levels will lead to induction of expression of the inducible promoter and expression of the probing gene. Image adapted from 2………91
Figure 31 – Disruption of LptCm–LptAm interaction seen with NMR (A) and SPR (B). In both types of
experiments, we verified that LptCm did not interact with thanatin as negative control………92
Figure 32 – Representative protein sequence alignment of LptF and LptG, from E. coli K12. Alignment
was performed using ClustalX 2.1 3, taking the protein sequences from the publicly available protein
database in NCBI. Residues are displayed with a colour code, with symbols “*”, “:” or “.” Indicating fully conserved, strongly conserved or weakly conserved position, scored according to ClustalX 2.1 parameters. Absence of a symbol at a specific position indicates no conservation. Above/below LptF/LptG sequences, indication of secondary motifs (α helices or β sheets) are indicated, based on the information of LptB2FG structural model 5X5Y (P. aeruginosa). Dashed red lines indicated
beginning/end of jellyroll domains………..94
Figure 33 – Structural representation of LptF (yellow/orange) and LptG (blue) jellyroll domains,
depicting constructs used in this project (colour-code combination for different LptF proteins) (PDB:5X5Y from P. aeruginosa)………..96
Figure 34 – (Top panel) Chromatogram profile and representative SDS-PAGE 15% of Size-Exclusion
Chromatography of LptG, of 95 mg injected in a HiLoad® 26/600 Superdex® 75 column. A single peak is observable with a presence of a small deviation, corroborating the expected size (kDa) for obtained elution volumes of two species (monomer and dimer). (Bottom panel) A single band of approximately 16 kDa was seen in the protein gel………..97
Figure 35 – [1H, 15N]-2D-BTROSY spectrum of an 15N labelled LptG sample at 88 μM, in MES buffer,
pH 6.5. Experiment was ran at 25°C in a 700 MHz spectrometer, for 1h……….98
Figure 36 – (Top panel) Chromatogram profile and representative SDS-PAGE 15% of Size-Exclusion
Chromatography of LptF_1, of 4.1 mg injected in a Superdex® 75 10/300 GL column. Four peaks are observable, 1 before the column void volume (9 ml), and the other 2 corroborating the expected size (kDa) for obtained elution volumes of two species (approximately 67 kDa for peak 2, 29 kDa for peak 3, and 13.7 kDa for peak 4). (Bottom panel) A single band of approximately 15 kDa was seen in the protein gel……….99
Figure 37 – [1H, 15N]-2D-SOFAST spectra of 200 μM of 15N labelled LptF expressed from LptF_1, in Tris
buffer pH 8.0. Experiment was recorded at 25°C at 600 MHz for 30 minutes. The chemical shifts observed are concentrated in a proton width range of less than 2 ppm around 8.5 ppm, the area of the amide protons more sensitive to structure. In this case, the spectrum is characteristic of an unstructured protein………..100
18
Figure 38 – Representative SDS-PAGE 15% of fractions along the purification protocol of LptB2FG.
Mutant complex displays similar pattern. Black box indicates LptB band (more intense) in the membrane fraction, and 1 hour after in the soluble fraction with buffer supplemented with 1% DDM………...101
Figure 39– (Top panel) S200 16/60 Size Exclusion Chromatography Profile for LptB2FG (dark blue)
and LptB2FR212GG (light blue) from a batch extraction of 4L (each). Expected Molecular Weight for
both complexes is approximately 130 kDa plus 95 kDa of DDM micelles (186 molecules of DDM per micelle approximately). (Bottom panel) Representative SDS-PAGE 15% obtained for a DDM purification of wt complex. Right-side gel of a western blot using an antibody against LPS. Results equal for LptFR212G-harboring complexes……….……….………..102
Figure 40 – SDS-PAGE 15% of solubilization assays of E. coli membrane pellets expressing LptB2FG
with SZ25010 and SZ30010, tested with increasing concentrations. The initial lane (-) corresponds to membranes without any component, and the second lane (+DDM) is the detergent-extracted fraction to compare the profile of solubilization with the SMA copolymers. Smear in the SMA-containing lanes is due to the polymers……….……….……….……….…………..………..103
Figure 41 –(Top panel) Representative S200 16/60 Size Exclusion Chromatography Profile for
SMA-LptB2FG (dark blue) and LptB2FR212GG (light blue) from a batch extraction of 3L (each). Expected
Molecular Weight for both complexes is approximately 130 kDa. (Bottom panel) Representative SDS-PAGE 15% obtained for a SMA purification of wt complex……….……….………104
Figure 42 – Representative image of Electron Microscopy negative staining of LptB2FG (wt and
R212G) samples extracted with DDM detergent and SMA co-polymers. Two staining dyes were used, but since they displayed no differences, all images are displayed with Uranyl Acetate staining. For each sample, a total of 5 copper-mesh grids were analysed. Scale indicated corresponds to 100 nm……….……….……….……….……….……….……….………..…………105
Figure 43 – Elution profile of LptB2FG complexes (wt – B2FG, LptFR212G-harboring – B2FGm). The top
region of the panel corresponds to total elution profile, while the bottom panels are a zoom between elution volumes 10 and 13 ml. Samples were injected in 40 μl at 1 mg/ml in a S200 10/300 GL SEC column. The dotted line represents the maximum absorbance at 280 nm detected according to the elution volume (in ml). Colour code indicates full complex particle (red), protein(s) alone(s) (blue) and DDM micelles (green). Bottom table corresponds to discriminated elution volumes and particle sizes……….……….……….……….……….……….…….…………...107
Figure 44 – (A) Association-dissociation curves of LptAm when binding/dissociating to functionalized
surface with LptB2FG complex (wt on the left side, and R212G mutant on the right side). Used
concentrations of LptAm are displayed on the bottom of the A panel in colour code; (B) Estimation of KD (binding affinity constant) of LptB2FG-LptA Δ160 in steady state. Blue points are the RU at
19
Figure 45 – [1H-13C]- SOFAST spectrum of 20 μM of [1H-13C]-AILV LptAm (black) in presence of 10 μM
of LptB2FG wt solubilized in DDM (red), ran for 3h. Experiment was recorded at 20°C in an 850 MHz
spectrometer. Presence of DDM detergent creates artifacts, marker with (*)……….110
Figure 46 – Spectrum of 20 μM [1H-13C]-AILV LptCm in presence of 300 μM DDM ([1H, 13
C]-2D-SOFAST pulse sequence in black, ran for 1h30), the minimal DDM concentration that we could work with above the 170 μM Critical Micelle Concentration (CMC); and 10 μM LptCm in presence of 15 μM LptB2FG wt with DDM concentration of 300 μM ([1H, 13C]-2D-SE-HSQC pulse sequence in red, ran
for 15h). All components were prepared in protonating conditions, and were frozen, lyophilized and resuspended in D2O. Experiments were recorded at 20°C in a 700 MHz spectrometer. Artifacts
generated from DDM are signalled with (*)……….……….………111
Figure 47 – ATPase activity of wild-type and R212G mutant LptB2FG and LptB2FGC complexes. (A)
The ATPase activity of LptB2FG and LptB2FR212GG was assessed by measuring the inorganic phosphate
release over time, using 0.2 M purified complexes. (B) The ATPase activity of LptB2FGC and
LptB2FR212GGC was measured using 0.1 M complexes. Data are the initial rate of ATP hydrolysis,
calculated within 5 minutes. When indicated, complexes were incubated with 20x molar excess of LptAm and/or LptCm. Error bars, s. d. (n = three technical replicates)………..113
Figure 48 – (A) Position of residue R212 in LptB2FG when complex is in the ground state, with its
interaction network. (B) Position of residue R212 in LptB2FGC when complex is in a transporter state,
with its interaction network. In this case, R212 switches from interacting with Y230 of LptF, and interacts with Y42 of LptC and E214 of LptF. (C/D) 3D view of this interaction network without/with presence of LptC, and the switching of R212 imposed by LptC presence in the interaction with surrounding residues, evidencing that interaction between R212 and Y42 is in the middle of a large cavity formed by LptF/C, likely through which LPS flows………..……….……….114
Figure 49 – [1H, 15N]-2D-BTROSY spectrum of 200 μM of LptAm (in Tris buffer pH 8.0), sole or titrated
with 0.5, 1.5 and 3 molar equivalents of LptG (each in colour code, respectively). Experiment was recorded at 25°C, in a 600 MHz spectrometer for 1h30……….…………..……….……….………….117
Figure 50 – 1H and 31P-1D-NMR spectra of LptB
2FR212GG incubated with 5 mM ATP/MgCl2 at 20°C. ATP
frequency corresponds to the peak around 8.368 ppm, and ADP around 8.375 ppm. The AMP peak appeared at around 8.41 ppm, and nucleotide presence was confirmed with a 31P experiment in the
700 MHz spectrometer……….……….……….……….……….………..133
Figure 51 – LptB monomer (PDB: 6S8G) visualized with PyMOL (side view), evidencing the designed
mutations around the nucleotide-binding site, with bound AMP-PNP in the pocket (ATPase inhibitor). Structure is originally from Shigella flexneri………135
Figure 52 – SEC-MALLS profiles of LptB proteins, each colour-coded. In each chromatogram, there is
a superimposition of Light Scattering (full line) and Refractive Index (dashed line). Dimer conformation corresponds to the middle peak around 14 ml, while above and below conformations correspond respectively to higher and lower MW complexes………136/137
20
Figure 53 – Representative SDS-PAGE 15% of purified LptB proteins after performing a Bradford
quantification for correction of concentrations………..………138
Figure 54 – [1H]-1D-NMR spectra of LptB proteins, incubated either with ATP or ADP as the sole
initial nucleotide source. Image displays zooms in the frequencies of H35 of the Adenosine (around 8.5 ppm) and H36 of the Ribose (around 4.4 ppm) (HMDB0000538). Spectrum obtained with wt protein is displayed in black while those obtained with mutant proteins are displayed in colour-code accordingly, for both ATP- and ADP- experiments. Peaks are slightly shifted due to reaction which changes the pH………...139
Figure 55 – [1H]-1D-NMR spectra of 0.5 mM ATP with D
2O at pH 7.4 and 25°C. Resonances used as
probe are indicated in the figure in red H35 of the Adenosine (around 8.5 ppm), and in cyan H36 of the Ribose (around 4.4 ppm) (HMDB0000538 4, and Biological Magnetic Resonance Data Bank
bmse000006 5)……….………..140
Figure 56 – LptB nucleotide percentages (ATP, ADP and AMP in colour-code) 17 hours after incubation at 25°C, starting with either with ATP (A) or ADP (B) as the sole nucleotide. Nucleotide levels were detected using a [1H]-1D-NMR pulse sequence in 3 mm tubes at 25°C. Peak integrals for
each specie were normalized against a non-changing peak (H20 from the Adenosine, [HMDB0000538]) in 2 independent experiments………..141
Figure 57 – Real-time kinetics of LptB2FGCA in presence of 5 mM ATP/1 mM MgCl2 extracted from
the pseudo [1H]-2D-NMR experiment. Complex was tested at 5 μM and LptCm/LptAm at 10 μM in
TBS buffer, pH 8.0. Experiment was recorded at 600 MHz, for 16h30. ATP/ADP/AMP are colour-coded, and the initial percentages of the first 500 min were used to calculate ATPase rate………..………143
Figure 58 – Real-time kinetics of LptB2FGCA in presence of 5 mM ADP/1 mM MgCl2. Complex was
tested at 5 μM and LptCm/LptAm at 10 μM in TBS buffer, pH 8.0. Experiment was recorded at 600 MHz, for 16h30. ATP/ADP/AMP are colour-coded, and the initial percentages of the first 500 min were used to calculate AK rate………144
Figure 59 – [1H]-1D-NMR spectra of LptB
2FG/LptB2FGC with/without LptCm/LptAm, incubated either
with ATP or ADP as the sole initial nucleotide source. Image displays zoom in the frequencies of H35 of the Adenosine (around 8.5 ppm) and H36 of the Ribose (around 4.4 ppm) (HMDB0000538). Complex alone is displayed in black while addition of remaining Lpt partners are displayed in colour-code accordingly, for both ATP- and ADP- experiments………145
Figure 60 – Effect of LptC (wt/full and Δ1-23 [m]) and LptAm presence in ATPase (A) and AK (B)
activities of SMALP LptB2FG after incubation for 7 hours at 37°C, starting either with ATP (A panel) or
ADP (B panel) as the sole nucleotide. Nucleotide levels (ATP, ADP and AMP colour-code), were detected using a [1H]-1D-NMR pulse sequence in 3 mm tubes at 25°C. Peak intensities for each
specie were normalized against a non-changing peak (H20) from the adenosine ring, in 2 independent experiments………..……146
21
Figure 61 – [1H]-1D-NMR spectra of LptB
2FG mutants with/without LptCm/LptAm, incubated either
with ATP or ADP as the sole initial nucleotide source. Image displays zoom in the frequencies of H35 of the Adenosine (around 8.5 ppm) and H36 of the Ribose (around 4.4 ppm) (HMDB0000538). Mutant complexes alone are displayed in black while addition of remaining Lpt partners are displayed in colour-code accordingly, for both ATP- and ADP- experiments………..147
Figure 62 – ATPase/AK activities of LptB2FG (LptB2H195AFG on the A panel, and LptB2FR212GG on the B
panel) extracted in SMA after incubation for 7 hours at 37°C with LptCmand LptAm, starting with either ATP or ADP as the sole nucleotide. Nucleotide levels (ATP, ADP and AMP colour-code), were detected using a [1H]-1D-NMR pulse sequence in 3 mm tubes at 25°C. Peak intensities for each
specie were normalized against a non-changing peak (H20) from the adenosine ring, in 2 independent experiments………..148
Figure 63 – Structure of nucleotide analogues Ap5A (A) and AMP-PNP (B), responsible respectively
for AK and ATPase inhibition. Ap4A structure is similar as Ap5A but with 4 central phosphates only……….150
Figure 64 – [1H, 15N]-2D-BTROSY spectrum of LptB
2(E163A) at 300 μM, in presence of 5 mM ADP/MgCl2,
TBS pH 8.0 with 0.5 mM TCEP and no glycerol. Experiment was recorded at 40°C in a 700 MHz spectrometer, for 15h………...150
Figure 65 – Nanodrops with crystals formed after 35 days of incubation at 20°C in a JCSG screening
plate.………..…151
Figure 66 – Preliminary crystal structure of LptB wt co-crystallized with Ap5A. Model presents a
maximum resolution of 2.7 Å, with two monomers (yellow and cyan) forming a dimer, and a third monomer (green) packing in the asymmetric unit. A part of Ap5A was modelled as an ADP molecule on the nucleotide-binding site of the yellow monomer. One phosphate could be modelled into the other two monomers ATPase binding sites (spheres)………..………..152
Figure 67 – Preliminary electron density of one LptB monomer of the resolved crystal structure, with
Ap5A partially occupying the binding pocket (yellow/purple). Residues Y13 (contact with the adenosine of the nucleotide), and E163/H195 in the vicinity interact with the nucleotide or water/magnesium, and were previously mutated showing changes in activity profiles. R92 is an arginine from the other monomer, that possibly stabilizes the nucleotide in the binding pocket………153
Figure 68 – Proposed scheme for the LptB2FG dual-activity. LptF/G/B are colour-coded, and the
proposed cycle for both reactions is below. Image build with PDB structure 6S8G from Shigella
flexneri. It is not known if ATP molecules are necessarily bound in both ATPase sites for the reaction
to occur……….………154
Figure 69 – Structure of the pfSMC (PDB 3KTA) complexed with Ap5A. The ATPase site is indicated
22 Both residues that helped identifying the second active site and affecting the AK reaction are indicated in purple and cyan……….………155
Figure 70 – Top view of LptB2 from Shigella flexneri (PDB 6S8G), with two molecules of ATP bound in
the canonical ATPase site (dark blue). The designed mutations are colour-coded on the right side……….…….156
Figure 71 – Superimposition of all the jellyroll domains from LptA, LptC, LptD, LptF and LptG (each
colour-coded). These were extracted from, respectively, PDB structures 2R19 (E. coli), 6MIT (Enterobacter cloacae), 5IV9 (K. pneumoniae), and 5X5Y (P. aeruginosa, for LptF and LptG). N- and C- terminations are roughly represented, since between proteins there is a slight difference in the location……….………160
Figure 72 – Superimposition of MsbA, LptB2, TmrAB and BmrA NBD proteins, each colour-coded. PDB
codes are, respectively, 5TTP (E. coli), 6S8G (Shigella flexneri), 6RAI (Thermus thermophilus) and 6R81 (Bacillus subtilis). All NBDs in each structure had a nucleotide bound………..164
Figure 73 – Chromatograms of several SEC column mentioned in the current manuscript, derived
from a single injection composed of proteins with known size of Calibration Curve kits (with low and high molecular weight proteins, with sizes indicated at the right side of each profile), to obtain calibration curve for each column (indicated at the top of each chromatogram). Images were obtained from the manufacturer’s guidebook (GE Healthcare).………201
23
List of Tables
Table 1 – Main classes of antibiotics commercially available, with focus on some examples of drugs,
their background origin, target, and range. Adapted from 18. ... 29
Table 2 – Priority Pathogens List assembled by the WHO in collaboration with experts and official
authorities. The list comprises several pathogens, focusing on specific bacterial species or genus and the observed resistance towards several main classes of antibiotics clinically administrated. ... 38
Table 3 – Description of all proteins involved in the Raetz pathway for synthesis of lipid A. ... 46 Table 4 – Description of both bacterial and cell free expression tests carried for all LptF and LptG
plasmids in our lab. Constructs were tested in either bacteria, cell free (or both) according to the methods section... 95
Table 5 – Styrene-Maleic Acid (SMA) products used in this project, with the description of the ratio
between styrene and maleic acid, and the molecular weight (in g/mol). ... 187
Table 6 – List of plasmids for expression trials of LptF and/or LptG periplasmic regions. All sequences
were constructed based on E. coli K12 genome publicly available and based on sequence alignments and structures published from 181. ... 191
Table 7 – LptB2/FG/C atomic models publicly available in the PDB, indicating the species, the
technique used and the PDB code. Lower capital “s” stands for a selenomethionine derivate, while “d” stands for derivate from the molecule……….200
24
INTRODUCTION
I.
Antibiotics
discovery
and
rising
resistance
mechanisms
1.1. Rise of Antibiotic Resistance
1.1.1. Anthropogenic activities accelerate the emerging resistance
The emerging antibiotic resistance poses a challenge to human populations due to prolonged illness, ineffective treatments that burdens patients, higher health care costs, and increased risk of infecting populations 6. Antibiotic resistance-derived selective pressure is a natural event, and antibiotic resistance genes are omnipresent in natural environments, circulating between environmental strains. Despite this, infections passing to human populations and selection of resistant strains are accelerated by anthropogenic activities 6.
Activities such as antibiotic disposal into side-wastes (from medical facilities or industries), the use in agriculture and farming industries have generated major pockets for accumulation of antibiotic resistance genes, that increase the plastic potential for environmental and/or clinical strains to adapt and evolve resistance 7.
Incorrect disposal of waste products from industries and farms leads to accumulation of sewage debris, that usually accumulate in water treatment facilities and harbour genetic diversity of antibiotic-resistance genes 8. It is suggested by previous work that several environmental and geographical factors influence the resistome found in waste waters, yet it is clear that there is spillage between facilities such as hospitals and industries onto the effluxes that will harbour these elements that can be uptaken by environmental species, which indicates a cycle of transmission not only horizontally but vertically 9. Farming industries are one of the best examples for antibiotic misuse, and already some countries around the world implemented strong legislation to circumvent previous uncontrolled policies. Antibiotic administration into cattle and poultry is made either for growth purposes to increase feed conversion efficiency (increase yields of animal products such as milk, meat, etc), or to treat infections 10. In some cases, the drug is given only partially to the sick animals, or to the entire herd as a prophylactic measure, even if not all animals display symptoms. There is also a problem of destabilization of the environmental microbiome, since 40% to 90% of given drugs to animals are excreted in urine and stool, which is then spread due to fertilizers or even in
25
underground running waters. This increases the risk of selecting bacteria naturally harbouring resistance-associated genes, and makes it more prone to spread to humans (and wildlife) in the surroundings 11. Due to these reasons, products from animal farming may carry resistant strains of bacteria, specifically enteric, which, if ingested may colonize the gut and prompt disease development. Commonly traced by local authorities such as the CDC (Centre for Disease Control and Prevention), these are Campylobacter, Salmonella, E. coli and Listeria spp. are the most common foodborne bacteria, causing gastroenteritis, inflammatory bowel disease, meningitis, and can exacerbate other clinical conditions. Stools can also contain livestock-associated methicillin-resistant Staphylococcus aureus (LA-MRSA), a specific group of gram-positive Staphylococcus aureus highly resistant to β-lactam antibiotics, and nowadays common source of infections in the hospital environment (hospital-associated MRSA). This resistance is brought up by a genetic island of resistance called Staphylococcal cassette chromosome mec (SCCmec), a mobile genetic element, where we find among other genes the mecA, expressing a Penicillin-Binding Protein 2a (PBP2a) insensitive to the transpeptidation inhibition of penicillin-like antibiotics such as methicillin. Presence of these strains among animal livestock enhances the possibility for intra- and interspecies spread, which contributes to resistance dissemination 12.
In plant agriculture, there is also spraying of antibiotics in crops to act as pesticides that contributes to destabilize environmental communities and, even though it is a local event, it can become geographically widespread by the same reasons as stated before 13. All of these factors invoke the idea of “one health”, recently underlined by the WHO and the FAO (Food and Agriculture Organization of the United Nations): a triade of stability between human population, wildlife, and the environment. When one side is destabilized, the other two ends will feel some repercussion (and vice-versa).
It is challenging to quantify the global economic impact of drug resistance, specifically due to the varying landscapes communities displayed around the globe. Locally, several countries such as the United States or even the United Kingdom invested largely into programs to tackle drug misuse in different sectors. These investments derived from studies trying to estimate the burden in terms of economy, health, and health system. It is clear that multi-drug resistant pathogens contribute to higher permanence time in the healthcare system – estimated around 6 to 13 days more of hospitalization – and can generate great loss ($8 billion in the USA in 2006) 13.
26 1.1.2. Discovery and main hallmarks in antibiotic Development
By the previous section, one understands that misuse of antibiotics for a long period of time contributed to a selective pressure, leading to resistance.
The word antibiotic indicates “opposing life”, molecules that impair and destabilize the normal growth of bacteria and some protozoans (but not viruses), either killing or arresting growth.
Antibiotics have been used in a multitude of situations, being administrated orally, intra-venously or topically, are of different origins. Compounds isolated in large-scale from bacteria or fungi are designated as natural products. If these natural products are used as a base for forward alterations and to synthetize derivates, the final product is designated as semi-synthetic. If the base molecule has no natural origin – such as the case with triclosan – the final product is a fully synthetic molecule 14.
The use of compounds or extracts with active principles from natural sources to circumvent infections has been described since ancient times by Greeks, Egyptians and Chinese 14. Nevertheless it was the accidental discovery of penicillium by Alexander Fleming in 1928 from a culture of Penicillium notatum (now Penicillium chrysogenum) that is considered the hallmark of modern drug discovery 15.
This discovery, together with other reports of compounds with antimicrobial activity isolated from other bacteria, led Selman Waksman – an Ukrainian biochemist – to start in the 1930s a systematic study of microorganisms – not only bacteria but also fungi – as producers of substances that impair infections. His pioneering trail of experiments of mixing several microorganisms in a batch-growing environment led to the discovery of streptomycin and eventually gained him the Nobel Prize in Physiology and Medicine in 1952 16,17.
Fleming’s et al. works and discoveries initiated the golden age, a period of roughly two decades between the 1940s and the 1960s, where the focus was mostly on natural products from bacteria and fungi (Figure 1), and the synthetic development of antimicrobial drugs started to falter 17. This led to the discovery of several antibiotics such as macrolides and cephalosporins.
27
Figure 1 – Timeline of antibiotic development research, focusing on the main hallmarks. Green and blue
colours indicate natural products with bacterial origin, purple indicates natural products with fungal origin, and orange indicates synthetically developed compounds. In boxes with the same colour code, there is indication of the first report of resistance towards a specific antibiotic of the mentioned background (MRSA - methicillin-resistant Staphylococcus aureus; VRE – Vancomycin-resistant enterococci; VRSA – Vancomycin-resistant Staphylococcus aureus). Adapted from 17.
From recent years and until late 2018, antibiotic development entered in a slowing phase, with 45 antibiotics in the midst of the development pipeline until maximum phase III. Of these, 28 have a natural background and 17 are synthetic 18. The vast majority of these 42 are in the phase II of clinical trials, and some are abandoned due to complications. For example, murepavadin is a synthetic antibiotic with a novel mode of action, inhibiting the LptD and blocking the lipopolysaccharide transport chain. Yet, it displayed some nephrotoxicity early on 19 and it dropped from the development in phase III during late 2019.
There are also some limitations in the current paradigm of antibiotic research and development in a scientific, economic and regulatory way 20. The first one is the lack of new and innovative compounds/scaffolds to diversify the available chemical pool, since the existing diversity comes from semi-synthetic design, implying that the mechanism of action to which resistance already began to arise will not further away from the original background molecule (cross-resistance). This point also connects with the
28
economic forfeit of clinical trials, since majority of the research that produces good targets comes from research/academic centres and small companies – which possess less economic power – while vast majority of drugs inside the four stages of clinical trials are supported by bigger pharmaceutical companies that harbour bigger economic power. The costs of a compound from phase I up to phase III can reach up to $130 million with post-approval trials that continue monitoring the performance, and this can result to a total of $260 million 21. To round the economic challenge that this development ensues, majority of clinical trials yield a very small number of marketable products, with majority capping at phase III, and the development up to this stage is already in the range of millions of dollars, which can be challenging for small and medium-size companies that may be unable to raise the needed capital for possible challenges and follow-up screenings 20.
The small number of drugs that actually manage to pass all stages of clinical trials are then subjected to distinct licensing procedures and financial justification for large-scale manufactures, that arise from different drug authorities – the US Food and Drug Administration being some one of the most famous – that exert different parameters and subject the drug licensing protocols to a long and costly patent period. The large-scale marketing is also affected exclusively on the sales point of view with the existence of generics and to the normalization of application to infections other than the ones exhibiting resistance 20.
All of these points come together and create an exhaustive road towards finding a new compound, also taking into account the characteristics of an ideal molecule: it can display a narrow or broad-spectrum bactericidal activity (against a specific pathogen, or against both gram-negative and gram-positive) and a capacity for penetration in the bacterial cell or structures that protect these (such as biofilms); capable of penetration in the entire human body (including peripheral areas and tissues) and not accumulating at high/toxic concentrations (pharmacodynamics); stable conformation unchanged in vivo (pharmacokinetics), covalently bonding to more than one target (all unrelated), highly reactive with a clear mode of action and producing little toxic side-products, and being effective at low dosage 22. Combining all these characteristics in a novel compound is extremely difficult.
29 1.1.2. Antibiotics and Mode of Action – Cell Wall inhibitors
Since the golden age, several antibiotics of distinct classes were designed and applied in commercial usage. All of them target key events in the bacteria’s cellular homeostasis, such as Nucleic Acid synthesis (folate derivates important for purine and pyrimidine synthesis, DNA gyrase and RNA polymerase), protein synthesis (target on both 50S and 30S ribosomal subunits) and cell wall maintenance (targeting peptidoglycan synthesis) 17,18(Figure 2).
Figure 2 – Main targets of clinically used antibiotics (adapted from 23), specifically aiming for nucleic acid
synthesis, protein expression, DNA replication and cell wall synthesis and homeostasis.
Table 1 – Main classes of antibiotics commercially available, with focus on some examples of drugs, their
background origin, target, and range. Adapted from 18.
Class type Example Origin Range Targets
Fluoroquinolones DNA synthesis inhibitor Nalidixic acid, ciprofloxacin, levofloxacin and gemifloxacin Synthetic Gram-positive, Gram-negative and M. tuberculosis Topoisomerases (DNA replication) Rifamycins
30 RNA synthesis inhibitor Rifamycins, rifampin and rifapentine Natural and semi-synthetic Gram-positive, Gram-negative and M. tuberculosis DNA-dependent RNA polymerase β-lactams Cell Wall synthesis
inhibitors Penicillins, cephalosporins and carbapenems Natural and semi-synthetic Gram-positive and Gram-negative Penicillin-binding proteins (PBPs)
Glycopeptides and glycolipopeptides Cell Wall synthesis
inhibitors
Vancomycin and teicoplanin
Natural and semi-synthetic
Gram-positive Peptidoglycan layer assembly Aminoglycosides Protein synthesis inhibitors Streptomycin and Kanamycin Natural and semi-synthetic Gram-positive and Gram-negative Protein translation (30S ribosome) Tetracyclines Protein synthesis inhibitors Tetracycline and doxycycline Natural and semi-synthetic Gram-positive and Gram-negative Protein translation (30S ribosome) Macrolides Protein synthesis inhibitors Erythromycin and Azithromycin Natural and semi-synthetic Gram-positive and Gram-negative Protein translation (50S ribosome) Phenicols Protein synthesis inhibitors
Chloramphenicol Natural and semi-synthetic
Gram-positive
and
Gram-negative
Protein translation
As we can see from the Table 1, all these classes of compounds have a natural background origin. Not all classes are represented, yet majority of developments of further compounds inside each group have been in the production of alternative chemical groups starting from the same compound landscape (semi-synthetic design). This implies that the range of action is smaller than in comparison with a novel compound, and together with misuse of existing products, there is a clear need for innovative research in finding new molecules 20. Some antibiotics, such as aminoglycosides and macrolides (spiromycin and clindamycin), are not only used to
31
tackle bacterial infections but also against the parasite Toxoplasma gondii 24, and clindamycin also against malaria if used together with other compounds in combinatorial therapeutics. This is thought to be due to the similarity of the translation machinery as seen for other protozoans 25, which makes the large 50S ribosomal particle a target of clindamycin. The binding is close to the active site where new aminoacids are added to the ongrowing peptide chain, inhibiting early chain elongation and impairing growth 26.
One of the main classes of used antibiotics tackle the cell wall synthesis, hampering the integrity of the bacterial cell. -lactams of the penicillins, cephalosporins, and carbapenems families, or glycopeptides are major examples of antibiotics belonging to this class (Figure 2). They target Penicillin Binding Proteins (PBPs) hampering the assembly of the peptidoglycan layer of the envelope by inhibiting the transpeptidation reaction and preventing the cross-linking of N-Acetylglucosamine-N-Acetylmuramic acid-pentapeptide repeats.
-lactam antibiotics are analogues of D-alanyl-D-alanine, the last two residues of the pentapeptide chain, and possess a remarkably similar conformation 27. When present, penicillin competes for the PBP, acylating a critical catalytic serine residue in the active site of the PBP, which is then unable to perform the transpeptidase reaction 28. The accumulation of these acylated PBPs weakens the envelope due to lack of cross-linking reactions, also triggering the action of autolytic hydrolases, which results in the envelope turnover without de novo synthesis29.
Vancomycin, belonging to the group of glycopeptide antibiotics, is responsible for forming hydrogen bonds in the lipid II precursor at the terminal di-alanine residues of the pentapeptide chain, unabling accumulation of transpeptidation sites and thus blocking the transpeptidation activities of PBPs30.
1.2. Mechanisms of Antibiotic Resistance
1.2.1. Resistance through antibiotic modifications
Bacteria produce enzymes that modify the antibiotic molecule, either (1) inactivating it due to introduction of changes in the chemical structure through specific reactions or (2) by destroying the antimicrobial molecule itself, for instances with cleavage of specific chemical bonds which renders the structure inactive to interact with the biological target (Figure 3) 31.


![Figure 6 – General view of LPS structure, with its three main moieties (O-specific glycan chain, the [outer and inner] core region, and the lipid A)](https://thumb-eu.123doks.com/thumbv2/123doknet/14658130.739116/45.892.146.749.109.350/figure-general-structure-moieties-specific-glycan-chain-region.webp)